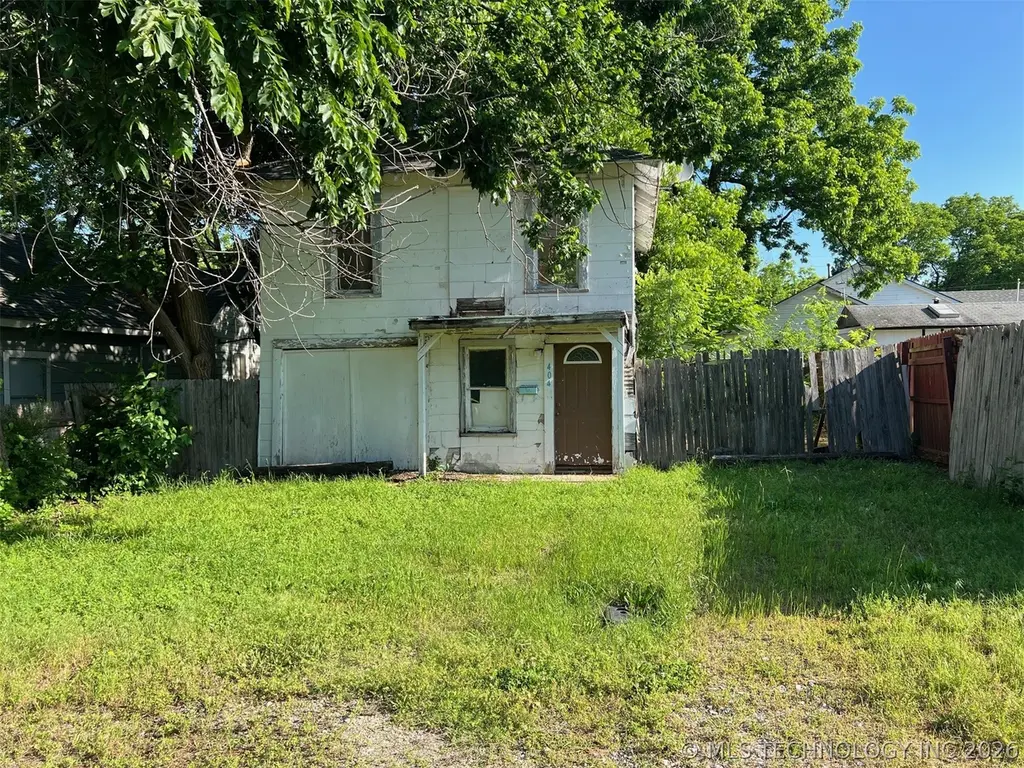
404 W 18th · Ada, OK
Flood risk 1/10 · Minimal
- FEMA flood zone
- X (unshaded)
- Chance of flooding over 30 yrs
- 0.0%
- Est. flood insurance / yr
- $507 – $1,088
Fire risk 7/10 · Major
- Est. fire insurance / yr
- $2,463 – $4,575
Heat risk 6/10 · Moderate
- Hot days now (above 109°F)
- 7 days/yr
- Hot days in 30 yrs
- 19 days/yr
Wind risk 4/10 · Minor
- Chance of severe wind over 30 yrs
- 9.0%
Air-quality risk 2/10 · Minimal
- Unhealthy air days now
- 1 days/yr
- Unhealthy air days in 30 yrs
- 1 days/yr
Risk factors via First Street. Map © Google.
Why this score? — see what drove the D grade
The composite is a weighted blend of 9 inputs, each scored 0–100. Each bar is that input's sub-score; the figure is the points it added to the 100-point composite (weight × sub-score).
- Cash flow +15.0/30.0
- ARV discount +7.5/15.0
- 1% rule +5.0/10.0
- DSCR +5.0/10.0
- Rent growth +3.7/5.0
- Livability +3.5/5.0
- Condition / age +2.5/5.0
- Schools +1.6/10.0
- Appreciation +0.0/10.0
$22,000
🖨 Deal sheet (PDF) 📄 Offer letter ✓ Due diligence
Listing remarks
Selling "As IS" this quaint 2-bedroom home located just blocks from downtown and schools. With a little TLC this home could be a great rental or housing for your ECU student.
Key facts
- Blocks from downtown
- 2,520 sq ft lot
- Built 1915
Tags
Property features AI
Exterior
- Security: No safety shelter
- Utilities: Electricity available; Public water; Public sewer
- Home design: 2-story home
- Construction: Wood siding with wood frame construction; Asphalt/fiberglass roof
- Exterior features: No notable exterior features listed; South-facing
Interior
- Bathrooms: 1 full bathroom
- Interior features: Aluminum-framed windows; No additional interior features listed
- Laundry & utility: Electric water heater
Neighborhood map
What this means for you Summary
Snapshot
- This is a 2-bed/1.0-bath single-family listed at $22k.
Deal economics
- At list price, monthly cash flow is $676 ($8k/yr) — positive.
- The deal already cash-flows at list — no discount required.
- Meets the 1% rule at list price ($1k rent vs $22k).
- Recommended offer: $21k (3.0% below list) — sets the bar for market timing.
- Cap rate 43.2% vs local median 4.0% in Ada — top-decile yield for the area; either an underpriced asset or a hidden risk that comps aren't pricing in. Stress-test before assuming the spread holds.
Location & tenants
- Location reads 70/100 on livability (#41 in OK) — a middle-class / working-renter tenant base. Strengths: cost of living A+, housing A+, health & safety A; Watch: employment D, crime D-, amenities F.
- Ada (town): math 17% / reading 23% proficiency, ranked #177 of 270 in OK (top 66%) — low school quality limits family demand, transient renter base, plan for 1-2y turnover.
- Zoned schools: Ada Ec Ctr (402 students, 0% FRL); Ada Jhs (math 10% / reading 20%, grade F, #220 of 345 statewide, top 65%, 606 students, 0% FRL); Ada Hs (math 27% / reading 42%, grade F, #48 of 447 statewide, top 14%, 540 students, 0% FRL) — zoned schools average 0% FRL vs 53% district-wide (53 pts lower); this property's tenant base skews higher-income than the district average.
- Market conditions: Rents rising fast (+4.8%/yr); 308 active listings in the ZIP; 2 units permitted in Pontotoc County in 2024 (0 in 5+ unit buildings).
Forward outlook
- Local home prices are declining (-3.0%/yr); year-one equity from $152 of loan paydown is wiped out by about $660 of value loss. Plan a longer hold.
- Pontotoc County population projected at +7% by 2050 — modest demand growth; plan on rents tracking national, not racing it.
- At projected returns (-3.0% appreciation + 4.8% rent growth), your $6k cash investment doubles in ~1 year — after that, you're playing with house money.
Negotiation context
- It's been on market 40 days — a 3% lower offer ($21k) is reasonable based on typical stale-listing flexibility.
- Current owner paid $5k; list at $22k implies a 340% gain — meaningful room to come down on a strong offer.
Risks & watch-outs
- Watch-outs: built in 1915 — expect roof / HVAC / electrical / plumbing capex.
- Climate carrying-cost: major wildfire risk; extreme-heat days projected 7→19/yr by 2055 (HVAC capex compounding) — expect insurance premiums to compound above CPI over the hold.
Questions for the listing agent
- It's been on market 40 days. Have you received any prior offers? Is the seller open to a 3% concession, seller financing, or rate buy-down credit?
- Built in 1915 — when were the roof, HVAC, electrical panel, plumbing, and water heater last replaced?
- Is there a deadline driving the sale (1031 exchange, divorce, estate, relocation)? That informs how much negotiation room exists.
- Schools are D-rated, which usually means shorter tenancies and higher turnover. Who's the typical renter profile here, and what's been the actual vacancy rate?
- Crime grade is D in this area — have there been break-ins, vandalism, or insurance claims at this property in the last 3 years? What carrier currently insures it and at what premium?
- The area grade is low — what's the realistic commute time and amenity access for the typical tenant pool here? Any planned neighborhood developments (good or bad) we should know about?
- What's the average days-on-market for RENTAL listings here right now (not sales)? A rising rental-DOM trend means longer vacancies and softer asking-rent achievability than the comps imply.
- What's the recent tenant-quality profile in this submarket — average credit score on applications, eviction rate, late-payment / NSF rate, and stable-employment percentage? A property-management company in the area should have these aggregated.
- How much new for-sale + rental construction is in the pipeline within 1–3 miles? Heavy new supply typically softens prices + rents 12–24 months out; constrained supply supports both.
Investment metrics
- 1% rule
- 4.66% ✓
- Cap rate
- 43.16%
- Cash-on-cash
- 131.66%
- DSCR
- 6.86
- GRM
- 1.8
CMA / ARV
- ARV (on-the-fly)
- $129,480
- Comps found
- 12
Show comp detail 12 sales within ~0.75 mi
| Address | Dist | Beds/Ba | Sqft | Sold | Price | $/sf | Match |
|---|---|---|---|---|---|---|---|
| 730 W 19th St | 0.33mi | 2/1.0 | 1,026 (+3%) | 3mo | $65,000 | $63 | 77 |
| 1209 S Ash Ave | 0.43mi | 3/1.0 (+1) | 996 (0%) | 2mo | $129,500 | $130 | 74 |
| 620 W 23rd | 0.43mi | 3/1.0 (+1) | 1,002 (+1%) | 2mo | $143,000 | $143 | 72 |
| 1031 S Stockton | 0.26mi | 2/1.0 | 1,097 (+10%) | 6mo | $146,000 | $133 | 66 |
| 619 W 14th St | 0.34mi | 3/2.0 (+1) | 934 (-6%) | 6mo | $109,500 | $117 | 60 |
| 301 S Hickory | 0.48mi | 2/1.0 | 1,100 (+10%) | 3mo | $51,500 | $47 | 58 |
| 914 Charles Dr | 0.64mi | 3/1.0 (+1) | 1,047 (+5%) | 1mo | $100,000 | $96 | 56 |
| 223 E 14th | 0.52mi | 2/1.0 | 890 (-11%) | 5mo | $40,000 | $45 | 54 |
| 704 W 21st St | 0.35mi | 3/1.0 (+1) | 1,139 (+14%) | 2mo | $152,000 | $133 | 53 |
| 912 W 13th St | 0.59mi | 3/1.0 (+1) | 1,080 (+8%) | 1mo | $150,000 | $139 | 52 |
| 817 Charles | 0.47mi | 2/1.0 | 850 (-15%) | 2mo | $133,000 | $156 | 52 |
| 517 W 9th St | 0.64mi | 3/1.0 (+1) | 1,134 (+14%) | 4mo | $20,000 | $18 | 39 |
Match score weights: distance 35% · size 25% · config 20% · recency 20%. Top-matched comps best support the ARV.
Projected returns pro-forma
-3.0% appreciation · 4.83% rent growth · sell at horizon
- IRR
- —
- Equity multiple
- 7.72×
- Total profit
- $41,405
- Equity at exit
- $3,280
- IRR
- —
- Equity multiple
- 17.18×
- Total profit
- $99,680
- Equity at exit
- $1,902
Cash invested: $6,160 (down + closing). Projections, not guarantees.
Landlord ↔ Tenant lean methodology
- Overall (STATE)
- 83 Strongly Landlord-Friendly
- State Oklahoma
- 83 Strongly Landlord-Friendly · R+20
- County
- — inherits STATE
- City
- — inherits STATE
ZIP-level market 74820
- Home prices YoY
- -11.5%
- Rents YoY
- 4.8%
- Active inventory
- 308
- Price-to-rent
- 1.8×
Monthly cashflow live
- Estimated rent
- $1,024 medium interval (Pro) →
- Mortgage (P&I)
- −$115
- Tax from tax record
- −$9 /mo · $105/yr
- Insurance
- −$9
- HOA
- −$0
- Vacancy / Maint / Mgmt
- −$215
- Net cashflow
- $676
Break-even live
Sensitivity live
| Price | -10% $688 | -5% $682 | +0% $676 | +5% $670 | +10% $663 |
|---|---|---|---|---|---|
| Rent | -10% $595 | -5% $635 | +0% $676 | +5% $716 | +10% $757 |
| Rate | -1.0pp $687 | -0.5pp $681 | base $676 | +0.5pp $670 | +1.0pp $664 |
UW: 25.0% down · 7.5% · 30yr · 1.5% tax · 5.0% vac · 8.0% maint · 8.0% mgmt
Financing live
Cash to close
- Down payment
- $5,500
- Closing costs
- $660
- Reserves months
- —
- Total cash needed
- —
Loan-product check · same deal, 3 products live
Conventional
25% down · 7.5% · 30yr
- Down + closing
- —
- Monthly P&I
- —
- Monthly cashflow
- —
- DSCR
- —
- Eligible?
- —
Personal DTI + credit; lowest rate.
DSCR
20% down · 8.5% · 30yr
- Down + closing
- —
- Monthly P&I
- —
- Monthly cashflow
- —
- DSCR
- —
- Eligible?
- —
No personal income docs; deal must DSCR.
Hard money
10% down · 12.0% · 12mo
- Down + closing
- —
- Monthly P&I
- —
- Monthly cashflow
- —
- DSCR
- —
- Eligible?
- —
Short-term bridge; refi at stabilization.
Listing history 18 events
-
2026-06-22days on market $22,000 Active 40 DOM
-
2026-06-19days on market $22,000 Active 37 DOM
-
2026-06-18days on market $22,000 Active 36 DOM
-
2026-06-17days on market $22,000 Active 35 DOM
-
2026-06-16days on market $22,000 Active 34 DOM
-
2026-06-15days on market $22,000 Active 33 DOM
-
2026-06-14days on market $22,000 Active 31 DOM
-
2026-06-12days on market $22,000 Active 30 DOM
-
2026-06-09days on market $22,000 Active 27 DOM
-
2026-06-08days on market $22,000 Active 26 DOM
-
2026-06-07days on market $22,000 Active 25 DOM
-
2026-06-05days on market $22,000 Active 22 DOM
-
2026-06-02days on market $22,000 Active 20 DOM
-
2026-06-01days on market $22,000 Active 19 DOM
-
2026-05-31days on market $22,000 Active 18 DOM
-
2026-05-30days on market $22,000 Active 17 DOM
-
2026-05-12$22,000 Active
-
2000-02-11soldstatus $5,000
ⓘ Source: listings_history table (triggers on properties + properties_extension) + one-shot
backfill from property_details.listing_events for pre-trigger history.
Tax reassessment forecast OK · Resets to sale price
- Current annual tax
- $105 · $9/mo
- Projected year-2 tax
- $198 · $16/mo
- Expected delta
- +$93/yr (+$8/mo · 88.6%)
ⓘ Screening estimate from a state-policy table — verify with the county assessor before closing.
Climate risk First Street
- Flood 1/10 Low FEMA zone X (unshaded) · 0% chance over 30 yrs
- Wildfire 7/10 Severe
- Heat 6/10 Major 7 d/yr ≥109°F today · 19 d/yr by 30 yrs out
- Wind 4/10 Moderate 9% chance of damaging wind over 30 yrs
- Air quality 2/10 Low 1 unhealthy d/yr today · 1 by 30 yrs out
Nearby sold comps map
Loading sold comps map…
Walkable amenities ~0.75 mi
Loading nearby amenities…
Taxation est. · year 1
- Rental income
- $12,291
- − Mortgage interest
- −$1,232
- − Property taxes
- −$105
- − Insurance
- −$110
- − Repairs & maintenance
- −$983
- − Management
- −$983
- − Depreciation
- −$640
- Taxable income
- $8,237
- Est. tax owed @ 24.0%
- −$1,977
- After-tax cash flow
- $6,133/yr
For passive investors: Depreciation is non-cash, so a rental often shows a tax loss while cash-flowing — sheltering income. Rental losses are passive: they offset passive income freely, and up to $25,000/yr can offset ordinary (W-2) income if you actively participate and your MAGI is under $100k (phasing out to $0 by $150k); unused losses carry forward. On sale, claimed depreciation is recaptured at up to 25%, and gains may owe capital-gains tax (a 1031 exchange can defer both). Figures are a year-1 estimate at your 24.0% rate — not tax advice; consult a CPA.
Schools (NCES district)
- District
- Ada
- NCES district ID
- 4002430
- Math proficiency
- 17% ▼ -11.00%
- Reading proficiency
- 23% ▼ -8.00%
- Median HH income
- $33,907
- Composite
- 16.36/100
- National rank
- #9203
- State rank
- #177 of 270 in OK
Livability — Ada
- Score
- 70/100
- State rank
- #41
- US rank
- #7835
Category grades
Schools grade is shown separately in the Schools card above.
Census & demographics
- Census place
- Ada, OK
- County
- Pontotoc County · 31,943 people
- City population
- 31,943
- Metro
- Ada, OK
- Population (ZIP)
- 31,943
- Household income
- $62,357
- Rent vs Own
- Severe rent burden
- 774.0
Population outlook (Pontotoc County) Hauer SSP2
- Today (2025)
- 39,521 people
- By 2030
- 40,140 · +1.6%
- By 2040
- 41,242 · +4.4%
- By 2050
- 42,293 · +7.0%
- By 2075
- 44,678 · +13.0%
- By 2100
- 46,015 · +16.4%
Race, ethnicity, and origin ACS 2023
- Neighborhood character
- Diverse neighborhood (Simpson 0.61)
- Race & ethnicity
- White 62% Native American 19% Two or more races 13% Hispanic / Latino 7% Black 3% Asian 1%
- Hispanic origin (detail)
- Mexican 6%
- Common ancestry
- Slovak 3% Lithuanian 2% Italian 1%
- Foreign-born
- 2% · Canada
- Languages at home
- 96% English-only · Spanish 2%
Political lean MEDSL · Pontotoc
- 2024 margin
- Solid R (+46.6) · D 25.7% · R 72.3% · Other 2.1%
- 2008→2024 swing
- -9.9pp toward R · 2008: -36.7pp · 2024: -46.6pp
- All cycles
- 2024: R+46.6 2020: R+43.7 2016: R+45.8 2012: R+38.8 2008: R+36.7
Not yet ingested
- Civics
- —
Market trends
- HPI YoY
- ▼ -32.45%
- Current HPI
- 250.7685
- Rent YoY
- ▲ 4.83%
- Metro
- Ada, OK
- State GDP YoY
- ▲ 1.55%
- F500 in state
- 6
Industry mix (Fortune 500 HQ in OK)
| Industry | F500 HQs | Revenue |
|---|---|---|
| Energy | 3 | $48B |
|
||
Price history
+340.0% since first listed2 events — show timeline
- 2026-05-12 Listed $22,000 MLS Technology, Inc.
- 2000-02-11 Sold (Public Records) $5,000 Public Records
Property tax history
+6.4%/yrLatest (2025): $105 · +2.9% YoY. Source: county tax records.
Cash-flow waterfall
monthlySold comps — $/sqft
last 12 mo · ≤1 miLoading sold comps…