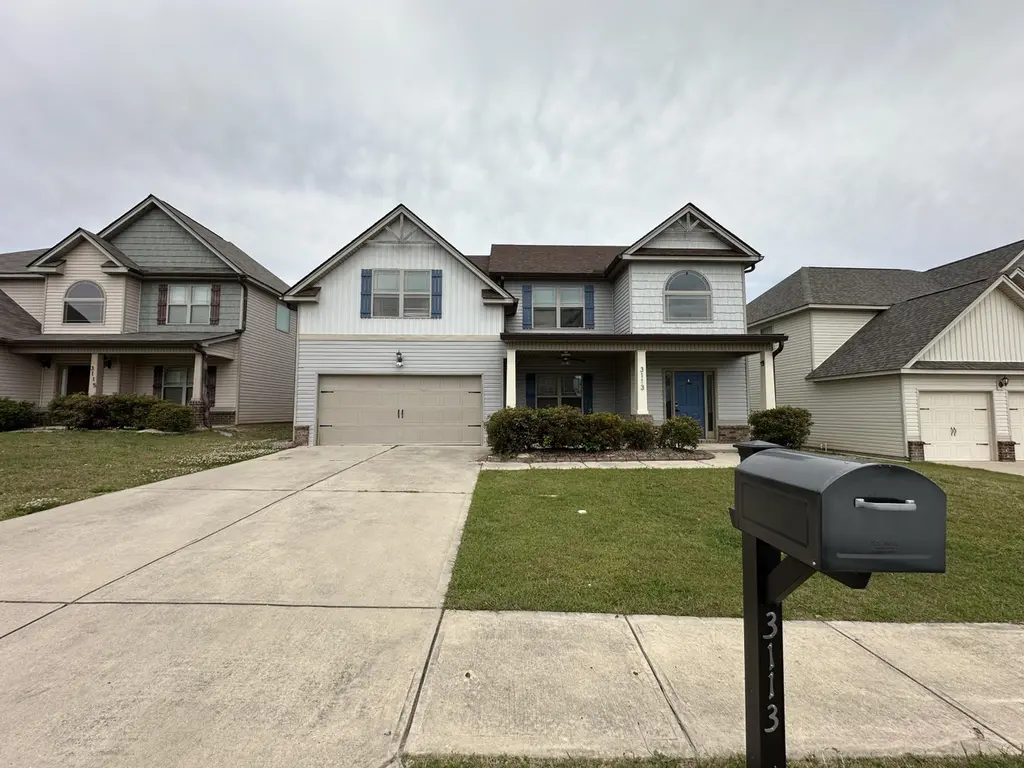
3113 Theodore St · Augusta-Richmond County consolidated government (balance), GA
Flood risk No data
- FEMA flood zone
- —
- Chance of flooding over 30 yrs
- —
- Est. flood insurance / yr
- —
Fire risk No data
- Est. fire insurance / yr
- —
Heat risk No data
- Hot days now (above threshold)
- —
- Hot days in 30 yrs
- —
Wind risk No data
- Chance of severe wind over 30 yrs
- —
Air-quality risk No data
- Unhealthy air days now
- —
- Unhealthy air days in 30 yrs
- —
Risk factors via First Street. Map © Google.
Why this score? — see what drove the D+ grade
The composite is a weighted blend of 9 inputs, each scored 0–100. Each bar is that input's sub-score; the figure is the points it added to the 100-point composite (weight × sub-score).
- Cash flow +19.1/30.0
- ARV discount +8.4/15.0
- DSCR +6.0/10.0
- 1% rule +4.9/10.0
- Rent growth +2.6/5.0
- Livability +2.5/5.0
- Condition / age +2.5/5.0
- Schools +1.3/10.0
- Appreciation +0.0/10.0
$305,900
🖨 Deal sheet 📄 Offer letter ✓ Due diligence
Listing remarks
Seller incentives: 5,000 DOLLAR SELLER CREDIT & 1-Year home warranty included Welcome to 3113 Theodore Street, where comfort and convenience meet in the heart of Augusta. From the moment you arrive, this home feels inviting--a place where natural light fills the living spaces and everyday life flows with ease. You have 5 bedrooms and 3-full baths, formal dining space or flex space, eat in kitchen, and great room. One bedroom and full bath on the main level. Enclosed back porch. You'll find this layout is both functional and warm, perfect for relaxing evenings or gathering with friends and family. The kitchen sits at the center of the home, ready for everything from quick meals to
Key facts
- Enclosed back porch
- Community pool
- Community park
Tags
Property features AI
Finance
- Other: Subdivision: Willhaven; Zoning: ri1; Directions available
- HOA & community: Homeowners association with annual fee of $200; Community pool; Sidewalks; Street lights; Playground
Exterior
- Parking: Attached 2-car garage with garage door opener; Total 2 parking spaces
- Security: Smoke detector(s)
- Utilities: Public water; Public sewer; Cable available
- Home design: Single family residence; Two-story; Entry level: 3
- Construction: Brick, vinyl siding, and frame construction; Composition roof; Slab foundation; Home warranty included; Built year not specified
- Exterior features: Covered, enclosed, screened front and rear porches; Front porch; Rear porch; Fenced yard; Sprinklers in front and rear; Paved road access; View
Interior
- Kitchen: Refrigerator; Range; Dishwasher; Microwave; Disposal; Electric water heater
- Bedrooms: Bedrooms information not specified
- Flooring: Carpet; Vinyl; Hardwood
- Bathrooms: 3 full bathrooms
- Heating & cooling: Heat pump; Fireplace(s); Electric heating; Central air; Ceiling fan(s)
- Interior features: Walk-in closets; Pantry; Eat-in kitchen; Window coverings; Insulated windows; Vented exhaust fan
- Laundry & utility: Washer hookup
Neighborhood map
What this means for you Summary
Snapshot
- This is a 5-bed/3.0-bath single-family listed at $306k.
Deal economics
- At list price, monthly cash flow is $323 ($4k/yr) — positive.
- The deal already cash-flows at list — no discount required.
- To meet the 1% rule (rent ≥ 1% of price), the offer needs to be $302k (1.3% below list).
- Recommended offer: $297k (3.0% below list) — sets the bar for market timing.
- Cap rate 7.6% vs local median 5.3% in Augusta-Richmond County consolidated government (balance) — top-decile yield for the area; either an underpriced asset or a hidden risk that comps aren't pricing in. Stress-test before assuming the spread holds.
Location & tenants
- Location reads: area grade D — affects rentability + tenant quality, not the cash-flow math above.
- Richmond County (urban): math 12% / reading 20% proficiency, ranked #154 of 174 in GA (top 88%) — low school quality limits family demand, transient renter base, plan for 1-2y turnover; 72% free/reduced lunch — lower-income household profile, screen leases tightly.
- Zoned schools: Belair K-8 School (math 18% / reading 20%, grade F, #917 of 1,228 statewide, top 75%, 1,032 students, 98% FRL); Westside High School (math 2% / reading 12%, grade F, #385 of 424 statewide, top 92%, 999 students, 98% FRL) — zoned schools average 98% FRL vs 72% district-wide (26 pts higher); higher-poverty schools than district average — tighter screening recommended.
- Market conditions: Rents flat; 303 active listings in the ZIP; 11 comparable units currently listed for rent nearby; rentals at typical pace (median 24d on market — plan ~3-4 weeks tenant-placement turnaround); 561 units permitted in Richmond County in 2024 (0 in 5+ unit buildings).
- At $3,020/mo this rent would consume 51% of the median local household income ($71k/yr) (locally 2113% of renters already pay >50% of income on rent) — very limited rent-growth headroom before tenants either downsize or default.
Forward outlook
- Local home prices are declining (-3.0%/yr); year-one equity from $2k of loan paydown is wiped out by about $9k of value loss. Plan a longer hold.
- Richmond County population projected to shrink 5% by 2050 — rents likely to lag national; underwrite the cash flow, not the appreciation.
Negotiation context
- It's been on market 38 days — a 3% lower offer ($297k) is reasonable based on typical stale-listing flexibility.
- 8 sale attempts since 14y ago with the ask held roughly flat each time — persistent listings suggest the price (not the market) is what's stuck; bring a comps-based counter.
Questions for the listing agent
- It's been on market 38 days. Have you received any prior offers? Is the seller open to a 3% concession, seller financing, or rate buy-down credit?
- What does the HOA fee cover, when was the last increase, and are there any pending special assessments or reserve-fund shortfalls?
- Is there a deadline driving the sale (1031 exchange, divorce, estate, relocation)? That informs how much negotiation room exists.
- The area grade is low — what's the realistic commute time and amenity access for the typical tenant pool here? Any planned neighborhood developments (good or bad) we should know about?
- What's the average days-on-market for RENTAL listings here right now (not sales)? A rising rental-DOM trend means longer vacancies and softer asking-rent achievability than the comps imply.
- What's the recent tenant-quality profile in this submarket — average credit score on applications, eviction rate, late-payment / NSF rate, and stable-employment percentage? A property-management company in the area should have these aggregated.
- How much new for-sale + rental construction is in the pipeline within 1–3 miles? Heavy new supply typically softens prices + rents 12–24 months out; constrained supply supports both.
Investment metrics
- 1% rule
- 0.99% ✗
- Cap rate
- 7.56%
- Cash-on-cash
- 4.53%
- DSCR
- 1.20
- GRM
- 8.4
CMA / ARV
- ARV (median comp)
- $312,058
- List price
- $305,900
- Delta
- -1.97%
- Verdict
- FAIR
- Comps
- 20 within 1.0 mi
Show comp detail 12 sales within ~0.75 mi
| Address | Dist | Beds/Ba | Sqft | Sold | Price | $/sf | Match |
|---|---|---|---|---|---|---|---|
| 1111 Sims Dr | 0.15mi | 5/3.0 | 2,388 (-7%) | 1mo | $324,000 | $136 | 81 |
| 1001 Hay Meadow Dr | 0.27mi | 5/3.0 | 2,361 (-8%) | 3mo | $312,900 | $133 | 72 |
| 997 Hay Meadow Dr | 0.29mi | 5/3.5 | 2,721 (+6%) | 3mo | $340,000 | $125 | 71 |
| 965 Hay Meadow Dr | 0.37mi | 5/3.0 | 2,361 (-8%) | 1mo | $315,000 | $133 | 69 |
| 2082 Willhaven Dr | 0.30mi | 4/3.0 (-1) | 2,854 (+12%) | 2mo | $308,000 | $108 | 60 |
| 108 Sims Ct | 0.38mi | 4/2.0 (-1) | 2,395 (-6%) | 7mo | $274,900 | $115 | 57 |
| 1152 Rosland Cir | 0.65mi | 4/2.5 (-1) | 2,504 (-2%) | 3mo | $312,000 | $125 | 57 |
| 1152 Rosland Cir | 0.65mi | 4/2.5 (-1) | 2,504 (-2%) | 3mo | $312,000 | $125 | 57 |
| 7069 Summerton Dr | 0.58mi | 4/2.5 (-1) | 2,470 (-3%) | 4mo | $322,400 | $131 | 57 |
| 4020 Pullman Cir | 0.61mi | 4/2.5 (-1) | 2,681 (+5%) | 4mo | $335,000 | $125 | 54 |
| 321 Conal Dr | 0.73mi | 4/2.5 (-1) | 2,624 (+3%) | 4mo | $335,000 | $128 | 51 |
| 5435 Copse Dr | 0.68mi | 4/2.5 (-1) | 2,211 (-14%) | 3mo | $363,000 | $164 | 36 |
Match score weights: distance 35% · size 25% · config 20% · recency 20%. Top-matched comps best support the ARV.
Projected returns pro-forma
-3.0% appreciation · 0.48% rent growth · sell at horizon
- IRR
- -12.1%
- Equity multiple
- 0.57×
- Total profit
- $-36,449
- Equity at exit
- $45,611
- IRR
- -7.1%
- Equity multiple
- 0.60×
- Total profit
- $-34,329
- Equity at exit
- $26,449
Cash invested: $85,652 (down + closing). Projections, not guarantees.
Landlord ↔ Tenant lean methodology
- Overall (STATE)
- 90 Strongly Landlord-Friendly
- State Georgia
- 90 Strongly Landlord-Friendly · R+3
- County
- — inherits STATE
- City
- — inherits STATE
ZIP-level market 30909
- Home prices YoY
- -32.2%
- Rents YoY
- 0.5%
- Active inventory
- 303
- Price-to-rent
- 8.4×
Monthly cashflow live
- Estimated rent
- $3,020 high interval (Pro) →
- Mortgage (P&I)
- −$1,604
- Tax from tax record
- −$314 /mo · $3,768/yr
- Insurance
- −$127
- HOA
- −$17
- Vacancy / Maint / Mgmt
- −$634
- Net cashflow
- $323
Break-even live
UW: 25.0% down · 7.5% · 30yr · 1.5% tax · 5.0% vac · 8.0% maint · 8.0% mgmt
Financing live
Cash to close
- Down payment
- $76,475
- Closing costs
- $9,177
- Reserves months
- —
- Total cash needed
- —
Loan-product check · same deal, 3 products live
Conventional
25% down · 7.5% · 30yr
- Down + closing
- —
- Monthly P&I
- —
- Monthly cashflow
- —
- DSCR
- —
- Eligible?
- —
Personal DTI + credit; lowest rate.
DSCR
20% down · 8.5% · 30yr
- Down + closing
- —
- Monthly P&I
- —
- Monthly cashflow
- —
- DSCR
- —
- Eligible?
- —
No personal income docs; deal must DSCR.
Hard money
10% down · 12.0% · 12mo
- Down + closing
- —
- Monthly P&I
- —
- Monthly cashflow
- —
- DSCR
- —
- Eligible?
- —
Short-term bridge; refi at stabilization.
Rent comps 11 comps
| Address | Beds | Baths | Sqft | Rent | $/sqft | DOM | Units | Dist |
|---|---|---|---|---|---|---|---|---|
| 196 Sims Ct Augusta, GA | 5.0 | 3.0 | 2536 | $2,419 | $0.95 | 14d | 1 | 0.30mi |
| 2017 Willhaven Dr Augusta, GA | 4.0 | 2.5 | 2990 | $5,600 | $1.87 | 44d | 1 | 0.31mi |
| 2017 Willhaven Dr Augusta, GA | 4.0 | 2.5 | 2990 | $5,600 | $1.87 | 23d | 1 | 0.31mi |
| 2308 Trinity Cir Augusta, GA | 5.0 | 3.0 | 2700 | $2,200 | $0.81 | 44d | 1 | 0.32mi |
| 430 Furlough Dr Augusta, GA | 4.0 | 2.5 | 2890 | $2,250 | $0.78 | 23d | 1 | 0.38mi |
| 5412 Copse Dr Augusta, GA | 4.0 | 3.0 | 2664 | $2,200 | $0.83 | 14d | 1 | 0.71mi |
| 5029 Copse Dr Augusta, GA | 4.0 | 2.0 | 2081 | $2,050 | $0.99 | 23d | 1 | 0.78mi |
| 1140 George W Crawford Dr Augusta, GA | 4.0 | 2.0 | 2062 | $2,200 | $1.07 | 44d | 1 | 0.88mi |
| 1210 Belgrove Dr Augusta, GA | 4.0 | 2.5 | 2302 | $2,500 | $1.09 | 23d | 1 | 0.96mi |
| 2323 Belair Spring Rd Augusta, GA | 4.0 | 2.5 | 2076 | $2,235 | $1.08 | 44d | 1 | 0.98mi |
| 2297 Belair Spring Rd Augusta, GA | 4.0 | 2.5 | 2031 | $2,250 | $1.11 | 14d | 1 | 1.03mi |
HOA detail
- Monthly dues
- $17 · $204/yr
Listing history 33 events
-
2026-06-18days on market $305,900 Active 38 DOM
-
2026-06-17price $305,900 Active 37 DOM
-
2026-06-17days on market $315,000 Active 37 DOM
-
2026-06-16days on market $315,000 Active 36 DOM
-
2026-06-15days on market $315,000 Active 35 DOM
-
2026-06-14pricedays on market $315,000 Active 33 DOM
-
2026-06-10days on market $315,900 Active 30 DOM
-
2026-06-09days on market $315,900 Active 29 DOM
-
2026-06-08days on market $315,900 Active 28 DOM
-
2026-06-07days on market $315,900 Active 27 DOM
-
2026-06-03days on market $315,900 Active 23 DOM
-
2026-06-02days on market $315,900 Active 22 DOM
-
2026-06-01days on market $315,900 Active 21 DOM
-
2026-05-31days on market $315,900 Active 20 DOM
-
2026-05-30days on market $315,900 Active 19 DOM
-
2026-05-16price $318,500 1177-char remark
-
2026-05-11historical
-
2026-05-03price $319,500
-
2026-04-06$320,000 Active
-
2026-04-06$319,500 Active 1177-char remark
-
2025-07-26historical
-
2025-07-26historical
-
2025-06-25$300,000
-
2025-06-25$300,000
-
2021-09-07soldstatus $280,000
-
2021-08-30soldstatus $280,000
-
2021-08-30soldstatus $280,000
-
2021-06-29$255,000
-
2021-06-29$255,000
-
2013-04-16soldstatus $172,500
-
2013-04-16soldstatus $172,500
-
2012-06-25$176,165
-
2012-06-25$176,165
ⓘ Source: listings_history table (triggers on properties + properties_extension) + one-shot
backfill from property_details.listing_events for pre-trigger history.
Tax reassessment forecast GA · Resets to sale price
- Current annual tax
- $3,768 · $314/mo
- Projected year-2 tax
- $3,768 · $314/mo
- Expected delta
- $0/yr ($0/mo · 0.0%)
ⓘ Screening estimate from a state-policy table — verify with the county assessor before closing.
Nearby sold comps map
Loading sold comps map…
Walkable amenities ~0.75 mi
Loading nearby amenities…
Taxation est. · year 1
- Rental income
- $36,238
- − Mortgage interest
- −$17,135
- − Property taxes
- −$3,768
- − Insurance
- −$1,530
- − Repairs & maintenance
- −$2,899
- − Management
- −$2,899
- − HOA
- −$204
- − Depreciation
- −$8,899
- Taxable loss
- −$1,095
- Est. tax savings @ 24.0%
- +$263
- After-tax cash flow
- $4,140/yr
For passive investors: Depreciation is non-cash, so a rental often shows a tax loss while cash-flowing — sheltering income. Rental losses are passive: they offset passive income freely, and up to $25,000/yr can offset ordinary (W-2) income if you actively participate and your MAGI is under $100k (phasing out to $0 by $150k); unused losses carry forward. On sale, claimed depreciation is recaptured at up to 25%, and gains may owe capital-gains tax (a 1031 exchange can defer both). Figures are a year-1 estimate at your 24.0% rate — not tax advice; consult a CPA.
Schools (NCES district)
- District
- Richmond County
- NCES district ID
- 1304380
- Math proficiency
- 12% ▼ -9.00%
- Reading proficiency
- 20% ▼ -6.00%
- Median HH income
- $38,069
- Composite
- 13.43/100
- National rank
- #9524
- State rank
- #154 of 174 in GA
Livability — Augusta-Richmond County consolidated government (balance)
No livability data for this city. (Only ~50 U.S. cities are tracked.)
Census & demographics
- Census place
- Augusta-Richmond County consolidated government (balance), GA
- County
- Richmond County · 190,917 people
- City population
- 154,035
- Metro
- Augusta-Richmond County, GA-SC
- Population (ZIP)
- 46,501
- Household income
- $71,364
- Rent vs Own
- Severe rent burden
- 2113.0
Population outlook (Richmond County) Hauer SSP2
- Today (2025)
- 200,753 people
- By 2030
- 200,232 · -0.3%
- By 2040
- 196,813 · -2.0%
- By 2050
- 190,347 · -5.2%
- By 2075
- 172,496 · -14.1%
- By 2100
- 146,284 · -27.1%
Race, ethnicity, and origin ACS 2023
- Neighborhood character
- Diverse neighborhood (Simpson 0.65)
- Race & ethnicity
- Black 44% White 39% Two or more races 9% Hispanic / Latino 6% Asian 3%
- Hispanic origin (detail)
- Mexican 3% Puerto Rican 2%
- Common ancestry
- Slovak 2% Serbian 1% Lithuanian 1%
- Foreign-born
- 6% · Canada, China, South Korea
- Languages at home
- 92% English-only · Spanish 3% Other Indo-European 1% Chinese 1%
Political lean MEDSL · Richmond
- 2024 margin
- Solid D (+36.1) · D 67.8% · R 31.7%
- 2008→2024 swing
- +4.3pp toward D · 2008: 31.8pp · 2024: 36.1pp
- All cycles
- 2024: D+36.1 2020: D+37.2 2016: D+32.4 2012: D+33.8 2008: D+31.8
Not yet ingested
- Civics
- —
Market trends
- HPI YoY
- ▼ -133.14%
- Current HPI
- 280.4587
- Rent YoY
- ▲ 0.48%
- Metro
- Augusta-Richmond County, GA-SC
- State GDP YoY
- ▲ 2.66%
- F500 in state
- 28
Industry mix (Fortune 500 HQ in GA)
| Industry | F500 HQs | Revenue |
|---|---|---|
| Paper / Packaging | 2 | $29B |
|
||
| Retail | 1 | $160B |
|
||
| Transportation / Logistics | 1 | $91B |
|
||
| Airlines | 1 | $62B |
|
||
| Consumer Goods | 1 | $47B |
|
||
| Utilities | 1 | $25B |
|
||
Price history
+73.6% since first listed21 events — show timeline
- 2026-06-17 Price Changed $305,900 Hive MLS
- 2026-06-12 Price Changed $315,000 Hive MLS
- 2026-05-25 Price Changed $315,900 Hive MLS
- 2026-05-16 Price Changed $318,500 Hive MLS
- 2026-05-11 Listing Removed — Hive MLS
- 2026-05-03 Price Changed $319,500 Hive MLS
- 2026-04-06 Listed $320,000 Hive MLS
- 2026-04-06 Listed $319,500 Hive MLS
- 2025-07-26 Listing Removed — Hive MLS
- 2025-07-26 Listing Removed — Hive MLS
- 2025-06-25 Listed $300,000 Hive MLS
- 2025-06-25 Listed $300,000 Hive MLS
- 2021-09-07 Sold (Public Records) $280,000 Public Records
- 2021-08-30 Sold (MLS) $280,000 Hive MLS
- 2021-08-30 Sold (MLS) $280,000 Hive MLS
- 2021-06-29 Listed $255,000 Hive MLS
- 2021-06-29 Listed $255,000 Hive MLS
- 2013-04-16 Sold (MLS) $172,500 Hive MLS
- 2013-04-16 Sold (MLS) $172,500 Hive MLS
- 2012-06-25 Listed $176,165 Hive MLS
- 2012-06-25 Listed $176,165 Hive MLS
Property tax history
+3.0%/yrLatest (2025): $3,768 · +10.0% YoY. Source: county tax records.
Cash-flow waterfall
monthlySold comps — $/sqft
last 12 mo · ≤1 miLoading sold comps…