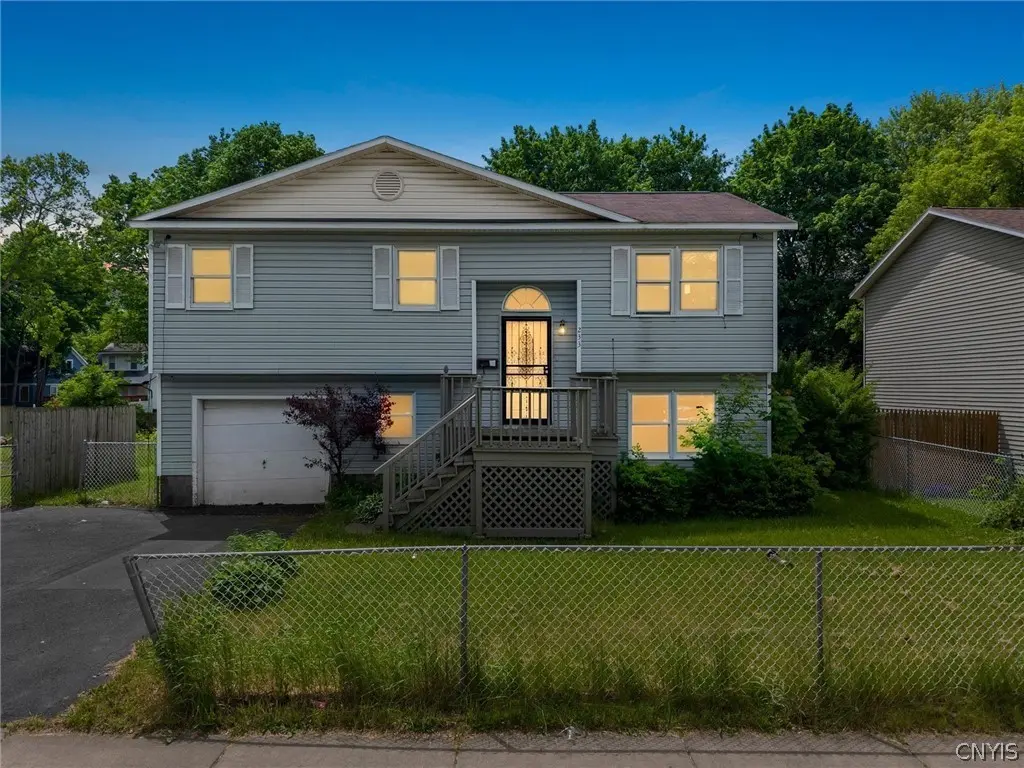
233 W Newell St · Syracuse, NY
Flood risk 1/10 · Minimal
- FEMA flood zone
- X (unshaded)
- Chance of flooding over 30 yrs
- 0.0%
- Est. flood insurance / yr
- $473 – $860
Fire risk 1/10 · Minimal
- Est. fire insurance / yr
- $691 – $1,283
Heat risk 3/10 · Minor
- Hot days now (above 95°F)
- 7 days/yr
- Hot days in 30 yrs
- 16 days/yr
Wind risk 1/10 · Minimal
- Chance of severe wind over 30 yrs
- 0.0%
Air-quality risk 2/10 · Minimal
- Unhealthy air days now
- 0 days/yr
- Unhealthy air days in 30 yrs
- 1 days/yr
Risk factors via First Street. Map © Google.
Why this score? — see what drove the B- grade
The composite is a weighted blend of 9 inputs, each scored 0–100. Each bar is that input's sub-score; the figure is the points it added to the 100-point composite (weight × sub-score).
- Cash flow +28.7/30.0
- DSCR +10.0/10.0
- Appreciation +10.0/10.0
- 1% rule +7.0/10.0
- Livability +3.9/5.0
- Rent growth +2.5/5.0
- Condition / age +2.5/5.0
- Schools +1.8/10.0
- ARV discount +0.0/15.0
$174,900
🖨 Deal sheet 📄 Offer letter ✓ Due diligence
Listing remarks
This home offers a number of recent updates and improvements throughout, providing a great opportunity for the next owner to move in and make it their own. Recent updates include plumbing work, a new furnace, granite kitchen countertops, updated light fixtures, and new flooring upstairs. Much of the interior has also been refreshed with fresh paint and new interior doors throughout most of the home. The lower level has seen significant improvements with all new sheetrock, a newly added bathroom, and a new staircase leading downstairs, creating additional usable living space and flexibility. The garage has also been updated with new sheetrock. The primary suite features both a Jacuzzi tub an
Key facts
- New furnace
- Fresh paint
- New flooring
Tags
Property features AI
Exterior
- Parking: Attached 1-car garage
- Utilities: Public water connected; Sewer connected; Circuit breaker electrical panel
- Home design: Two-story home; Existing/resale property
- Construction: Vinyl siding; PEX plumbing; Poured foundation
- Exterior features: Blacktop driveway; Deck; Near public transit; Rectangular lot (57 x 131)
Interior
- Kitchen: Gas water heater
- Bedrooms: Two main-level bedrooms
- Flooring: Luxury vinyl flooring
- Bathrooms: Two full bathrooms; One main-level bathroom
- Heating & cooling: Gas forced-air heating
- Interior features: Entrance foyer; Combined living and dining area; Primary bedroom with private bath; Programmable thermostat; Finished basement; Bonus room; Recreation room; Laundry room in basement; Basement
- Laundry & utility: Laundry located in basement
Neighborhood map
What this means for you Summary
Snapshot
- This is a 3-bed/1.5-bath single-family listed at $175k.
Deal economics
- At list price, monthly cash flow is $580 ($7k/yr) — positive.
- The deal already cash-flows at list — no discount required.
- Meets the 1% rule at list price ($2k rent vs $175k).
- Recommended offer: $172k (1.5% below list) — sets the bar for market timing.
- Cap rate 10.3% vs local median 8.2% in Syracuse — meaningfully above typical; check what's discounted (condition, days-on-market, listing class) to confirm the premium yield is real.
Location & tenants
- Location reads 77/100 on livability (#187 in NY, #2,869 nationally) — a middle-class / working-renter tenant base. Strengths: amenities A+, commute A+, cost of living A+; Watch: schools D+, crime F, employment D-.
- Syracuse City School District (urban): math 18% / reading 26% proficiency, ranked #590 of 590 in NY (top 100%) — low school quality limits family demand, transient renter base, plan for 1-2y turnover; 74% free/reduced lunch — lower-income household profile, screen leases tightly.
- Market conditions: 67 active listings in the ZIP; 11 comparable units currently listed for rent nearby; rentals at typical pace (median 21d on market — plan ~3-4 weeks tenant-placement turnaround); 616 units permitted in Onondaga County in 2024 (256 in 5+ unit buildings).
Forward outlook
- In year one you build about $19k of equity ($1k loan paydown + $17k appreciation (10.0% local appreciation)).
- Onondaga County population projected to shrink 9% by 2050 — rents likely to lag national; underwrite the cash flow, not the appreciation.
- At projected returns (10.0% appreciation + 3.0% rent growth), your $49k cash investment doubles in ~2 years — after that, you're playing with house money.
- By year 2, paydown + projected appreciation supports a ~$30k cash-out refi (75% LTV) — recoverable capital for the next deal without selling this one.
Negotiation context
- It's been on market 19 days — a 2% lower offer ($172k) is reasonable based on typical stale-listing flexibility.
Questions for the listing agent
- Is there a deadline driving the sale (1031 exchange, divorce, estate, relocation)? That informs how much negotiation room exists.
- Schools are D-rated, which usually means shorter tenancies and higher turnover. Who's the typical renter profile here, and what's been the actual vacancy rate?
- Crime grade is F in this area — have there been break-ins, vandalism, or insurance claims at this property in the last 3 years? What carrier currently insures it and at what premium?
- What's the average days-on-market for RENTAL listings here right now (not sales)? A rising rental-DOM trend means longer vacancies and softer asking-rent achievability than the comps imply.
- What's the recent tenant-quality profile in this submarket — average credit score on applications, eviction rate, late-payment / NSF rate, and stable-employment percentage? A property-management company in the area should have these aggregated.
- How much new for-sale + rental construction is in the pipeline within 1–3 miles? Heavy new supply typically softens prices + rents 12–24 months out; constrained supply supports both.
Investment metrics
- 1% rule
- 1.20% ✓
- Cap rate
- 10.27%
- Cash-on-cash
- 14.21%
- DSCR
- 1.63
- GRM
- 7.0
CMA / ARV
- ARV (on-the-fly)
- $147,392
- Comps found
- 12
Show comp detail 12 sales within ~0.75 mi
| Address | Dist | Beds/Ba | Sqft | Sold | Price | $/sf | Match |
|---|---|---|---|---|---|---|---|
| 129 W Pleasant Ave | 0.17mi | 4/1.5 (+1) | 1,532 (+2%) | 4mo | $160,000 | $104 | 81 |
| 504 W Newell St | 0.34mi | 3/1.0 | 1,545 (+3%) | 0mo | $110,000 | $71 | 77 |
| 183 W Ostrander Ave | 0.26mi | 4/1.0 (+1) | 1,519 (+1%) | 4mo | $63,000 | $41 | 76 |
| 2331 Midland Ave | 0.05mi | 4/1.5 (+1) | 1,664 (+11%) | 3mo | $90,000 | $54 | 72 |
| 118 W Lafayette Ave | 0.27mi | 3/1.5 | 1,373 (-9%) | 6mo | $153,700 | $112 | 68 |
| 303 Marguerite Ave | 0.58mi | 3/1.0 | 1,486 (-1%) | 4mo | $45,000 | $30 | 65 |
| 875 W Lafayette Ave | 0.52mi | 4/1.0 (+1) | 1,568 (+4%) | 4mo | $160,000 | $102 | 59 |
| 147 E Matson Ave | 0.46mi | 4/2.5 (+1) | 1,421 (-6%) | 3mo | $80,000 | $56 | 58 |
| 604 W Ostrander Ave | 0.39mi | 2/2.5 (-1) | 1,320 (-12%) | 1mo | $201,000 | $152 | 52 |
| 237 Evaleen Ave #39 | 0.59mi | 3/1.0 | 1,298 (-14%) | 5mo | $128,750 | $99 | 43 |
| 309 Marguerite Ave | 0.61mi | 2/1.0 (-1) | 1,344 (-11%) | 6mo | $79,000 | $59 | 42 |
| 403 Pacific Ave | 0.67mi | 2/1.0 (-1) | 1,331 (-12%) | 3mo | $130,000 | $98 | 40 |
Match score weights: distance 35% · size 25% · config 20% · recency 20%. Top-matched comps best support the ARV.
Projected returns pro-forma
10.0% appreciation · 3.0% rent growth · sell at horizon
- IRR
- 34.8%
- Equity multiple
- 3.70×
- Total profit
- $132,150
- Equity at exit
- $157,564
- IRR
- 29.9%
- Equity multiple
- 8.35×
- Total profit
- $360,003
- Equity at exit
- $339,792
Cash invested: $48,972 (down + closing). Projections, not guarantees.
Landlord ↔ Tenant lean methodology
- Overall (STATE)
- 15 Strongly Tenant-Friendly
- State New York
- 15 Strongly Tenant-Friendly · D+10
- County
- — inherits STATE
- City
- — inherits STATE
ZIP-level market 13205
- Home prices YoY
- 3.0%
- Active inventory
- 67
- Price-to-rent
- 7.0×
Monthly cashflow live
- Estimated rent
- $2,092 high interval (Pro) →
- Mortgage (P&I)
- −$917
- Tax from tax record
- −$83 /mo · $991/yr
- Insurance
- −$73
- HOA
- −$0
- Vacancy / Maint / Mgmt
- −$439
- Net cashflow
- $580
Break-even live
UW: 25.0% down · 7.5% · 30yr · 1.5% tax · 5.0% vac · 8.0% maint · 8.0% mgmt
Financing live
Cash to close
- Down payment
- $43,725
- Closing costs
- $5,247
- Reserves months
- —
- Total cash needed
- —
Loan-product check · same deal, 3 products live
Conventional
25% down · 7.5% · 30yr
- Down + closing
- —
- Monthly P&I
- —
- Monthly cashflow
- —
- DSCR
- —
- Eligible?
- —
Personal DTI + credit; lowest rate.
DSCR
20% down · 8.5% · 30yr
- Down + closing
- —
- Monthly P&I
- —
- Monthly cashflow
- —
- DSCR
- —
- Eligible?
- —
No personal income docs; deal must DSCR.
Hard money
10% down · 12.0% · 12mo
- Down + closing
- —
- Monthly P&I
- —
- Monthly cashflow
- —
- DSCR
- —
- Eligible?
- —
Short-term bridge; refi at stabilization.
Rent comps 11 comps
| Address | Beds | Baths | Sqft | Rent | $/sqft | DOM | Units | Dist |
|---|---|---|---|---|---|---|---|---|
| 2331 Midland Ave Syracuse, NY | 4.0 | 1.5 | 1664 | $2,300 | $1.38 | 20d | 1 | 0.05mi |
| 147 E Matson Ave Syracuse, NY | 3.0 | 2.5 | 1421 | $2,000 | $1.41 | 20d | 1 | 0.43mi |
| 1330 Midland Ave Syracuse, NY | 4.0 | 1.0 | 1870 | $2,000 | $1.07 | 20d | 1 | 0.64mi |
| 269 W Borden Ave Syracuse, NY | 4.0 | 1.5 | 1800 | $650 | $0.36 | 20d | 1 | 0.69mi |
| 102 Newbury Hollow Ln Syracuse, NY | 2.0 | 1.5 | 1200 | $1,550 | $1.29 | 13d | 1 | 0.69mi |
| 102 Newbury Hollow Ln Syracuse, NY | 3.0 | 2.0 | 2000 | $2,300 | $1.15 | 43d | 1 | 0.69mi |
| 300 Mains Ave Unit Bradford-7 Syracuse, NY | 2.0 | 1.0 | 1200 | $1,100 | $0.92 | 13d | 1 | 0.93mi |
| 260 Robert Dr Syracuse, NY | 3.0 | 1.5 | 1200 | $2,097 | $1.75 | 43d | 1 | 0.98mi |
| 213 Fletcher Ave Unit 2 Syracuse, NY | 3.0 | 1.0 | 1200 | $1,700 | $1.42 | 13d | 1 | 0.98mi |
| 259 Robert Dr Syracuse, NY | 3.0 | 1.5 | 1350 | $699 | $0.52 | 43d | 1 | 1.00mi |
| 154 Seeley Ave Syracuse, NY | 4.0 | 1.0 | 1312 | $2,100 | $1.60 | 13d | 1 | 1.03mi |
Listing history 15 events
-
2026-06-18days on market $174,900 Active 19 DOM
-
2026-06-17days on market $174,900 Active 18 DOM
-
2026-06-16days on market $174,900 Active 17 DOM
-
2026-06-15days on market $174,900 Active 16 DOM
-
2026-06-14days on market $174,900 Active 14 DOM
-
2026-06-13days on market $174,900 Active 13 DOM
-
2026-06-10days on market $174,900 Active 11 DOM
-
2026-06-09days on market $174,900 Active 10 DOM
-
2026-06-08days on market $174,900 Active 9 DOM
-
2026-06-07days on market $174,900 Active 8 DOM
-
2026-06-05days on market $174,900 Active 5 DOM
-
2026-06-02days on market $174,900 Active 3 DOM
-
2026-06-01days on market $174,900 Active 2 DOM
-
2026-05-31remarks 699-char remark
-
2026-05-31$174,900 Active 1 DOM
ⓘ Source: listings_history table (triggers on properties + properties_extension) + one-shot
backfill from property_details.listing_events for pre-trigger history.
Tax reassessment forecast NY · Partial reset (capped growth)
- Current annual tax
- $991 · $83/mo
- Projected year-2 tax
- $1,974 · $164/mo
- Expected delta
- +$982/yr (+$82/mo · 99.1%)
ⓘ Screening estimate from a state-policy table — verify with the county assessor before closing.
Climate risk First Street
- Flood 1/10 Low FEMA zone X (unshaded) · 0% chance over 30 yrs
- Wildfire 1/10 Low
- Heat 3/10 Moderate 7 d/yr ≥95°F today · 16 d/yr by 30 yrs out
- Wind 1/10 Low 0% chance of damaging wind over 30 yrs
- Air quality 2/10 Low 0 unhealthy d/yr today · 1 by 30 yrs out
Nearby sold comps map
Loading sold comps map…
Walkable amenities ~0.75 mi
Loading nearby amenities…
Taxation est. · year 1
- Rental income
- $25,106
- − Mortgage interest
- −$9,797
- − Property taxes
- −$991
- − Insurance
- −$874
- − Repairs & maintenance
- −$2,008
- − Management
- −$2,008
- − Depreciation
- −$5,088
- Taxable income
- $4,338
- Est. tax owed @ 24.0%
- −$1,041
- After-tax cash flow
- $5,920/yr
For passive investors: Depreciation is non-cash, so a rental often shows a tax loss while cash-flowing — sheltering income. Rental losses are passive: they offset passive income freely, and up to $25,000/yr can offset ordinary (W-2) income if you actively participate and your MAGI is under $100k (phasing out to $0 by $150k); unused losses carry forward. On sale, claimed depreciation is recaptured at up to 25%, and gains may owe capital-gains tax (a 1031 exchange can defer both). Figures are a year-1 estimate at your 24.0% rate — not tax advice; consult a CPA.
Schools (NCES district)
- District
- Syracuse City School District
- NCES district ID
- 3628590
- Math proficiency
- 18% ▼ -5.00%
- Reading proficiency
- 26% ▬ 0.00%
- Median HH income
- $32,097
- Composite
- 17.83/100
- National rank
- #9007
- State rank
- #590 of 590 in NY
Livability — Syracuse
- Score
- 77/100
- State rank
- #187
- US rank
- #2869
Category grades
Schools grade is shown separately in the Schools card above.
Census & demographics
- Census place
- Syracuse, NY
- City population
- 152,627
- Population (ZIP)
- 18,562
Population outlook (Onondaga County) Hauer SSP2
- Today (2025)
- 467,894 people
- By 2030
- 463,381 · -1.0%
- By 2040
- 447,697 · -4.3%
- By 2050
- 426,399 · -8.9%
- By 2075
- 373,661 · -20.1%
- By 2100
- 307,967 · -34.2%
Race, ethnicity, and origin ACS 2023
- Neighborhood character
- Diverse neighborhood (Simpson 0.67)
- Race & ethnicity
- Black 44% White 37% Two or more races 10% Hispanic / Latino 6% Asian 3%
- Hispanic origin (detail)
- Puerto Rican 4%
- Common ancestry
- Romanian 2% Italian 2% Swiss 1%
- Foreign-born
- 9% · Canada, China, Vietnam
- Languages at home
- 87% English-only · Spanish 5% Arabic 1% Other Indo-European 1%
Political lean MEDSL · Onondaga
- 2024 margin
- D (+17.3) · D 58.6% · R 41.4%
- 2008→2024 swing
- -3.0pp toward R · 2008: 20.3pp · 2024: 17.3pp
- All cycles
- 2024: D+17.3 2020: D+20.6 2016: D+12.8 2012: D+21.1 2008: D+20.3
Not yet ingested
- Civics
- —
Market trends
- HPI YoY
- ▲ 10.12%
- Current HPI
- 345.8854
- Rent YoY
- —
- Metro
- —
- State GDP YoY
- ▲ 2.60%
- F500 in state
- 92
Industry mix (Fortune 500 HQ in NY)
| Industry | F500 HQs | Revenue |
|---|---|---|
| Financial Services | 10 | $950B |
|
||
| Consumer Goods | 9 | $162B |
|
||
| Insurance | 4 | $225B |
|
||
| Telecommunications | 2 | $144B |
|
||
| Pharmaceuticals | 2 | $112B |
|
||
| Media / Entertainment | 2 | $69B |
|
||
Price history
1 event — show timeline
- 2026-05-30 Listed $174,900 CNYIS
Property tax history
-0.3%/yrLatest (2025): $991 · +0.0% YoY. Source: county tax records.
Cash-flow waterfall
monthlySold comps — $/sqft
last 12 mo · ≤1 miLoading sold comps…