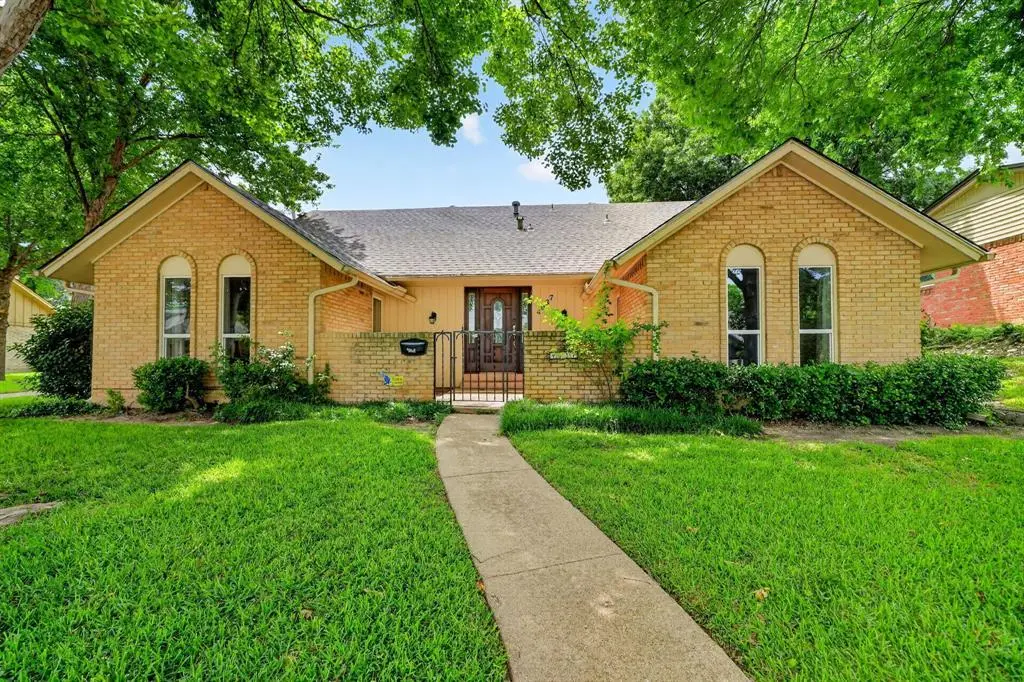
4037 Treeline Dr · Dallas, TX
Flood risk 1/10 · Minimal
- FEMA flood zone
- X (unshaded)
- Chance of flooding over 30 yrs
- 0.0%
- Est. flood insurance / yr
- $507 – $1,088
Fire risk 1/10 · Minimal
- Est. fire insurance / yr
- $1,222 – $2,270
Heat risk 7/10 · Major
- Hot days now (above 110°F)
- 7 days/yr
- Hot days in 30 yrs
- 24 days/yr
Wind risk 6/10 · Moderate
- Chance of severe wind over 30 yrs
- 27.0%
Air-quality risk 2/10 · Minimal
- Unhealthy air days now
- 1 days/yr
- Unhealthy air days in 30 yrs
- 2 days/yr
Risk factors via First Street. Map © Google.
Why this score? — see what drove the F grade
The composite is a weighted blend of 9 inputs, each scored 0–100. Each bar is that input's sub-score; the figure is the points it added to the 100-point composite (weight × sub-score).
- ARV discount +7.7/15.0
- Cash flow +7.1/30.0
- Livability +4.0/5.0
- Rent growth +3.4/5.0
- Schools +2.8/10.0
- 1% rule +2.6/10.0
- Condition / age +2.5/5.0
- DSCR +1.3/10.0
- Appreciation +0.0/10.0
$299,000
🖨 Deal sheet 📄 Offer letter ✓ Due diligence
Listing remarks
Set among the rolling hills and mature trees of Oak Park Estates, this distinctive two-story home blends timeless character with generous living spaces and a welcoming architectural presence. A private courtyard entry and classic iron detailing create a memorable first impression, while the home’s spacious layout offers comfort, flexibility, and enduring appeal. Inside, an open staircase with decorative iron railings serves as a striking focal point. The expansive family room is anchored by a beautiful brick fireplace with an arched opening and oversized hearth, creating a warm and inviting atmosphere for everyday living and entertaining alike. Natural light fills the interior, comple
Key facts
- Open staircase
- Brick fireplace
- Private balcony
Tags
Property features AI
Finance
- Other: Lot is approximately 0.207 acres (less than 0.5 acre); Subdivision: Oak Park Estates; County: Dallas
- Financial info: Second mortgage: No; Loan type: Treat As Clear
- HOA & community: No homeowners association (annual association fee listed)
Exterior
- Parking: Attached 2-car garage; Covered parking for 4 vehicles total; 2-space carport; Concrete driveway; Alley access
- Utilities: City water; City sewer; Municipal Utility District: No
- Home design: Single-family residence; Two-story home; Built in 1969; Property not attached
- Construction: Asphalt roof; Masonry fireplace
- Exterior features: Deck
Interior
- Kitchen: Galley kitchen with built-in cabinets; Water line to refrigerator; Electric range; Dishwasher
- Bedrooms: Four bedrooms total; Primary bedroom on main level with ensuite bath and walk-in closet; Additional bedrooms located on second level
- Bathrooms: Three bathrooms total; Half bath on main level; Primary bathroom on main level
- Heating & cooling: Central heating; Central air conditioning
- Interior features: Cable TV available; High-speed internet available; Walk-in closets; Two living areas; Two dining areas; Total of 11 rooms; One fireplace with gas logs and masonry surround
- Laundry & utility: Main-level laundry room; Electric water heater
Neighborhood map
What this means for you Summary
Snapshot
- This is a 4-bed/2.0-bath single-family listed at $299k.
Deal economics
- At list price, monthly cash flow is $-424 ($-5k/yr) — negative.
- To cash-flow at today's rent, offer at most $224k (25.0% below list).
- To meet the 1% rule (rent ≥ 1% of price), the offer needs to be $226k (24.4% below list).
- Recommended offer: $224k (25.0% below list) — sets the bar for cash-flow.
- Cap rate 4.6% vs local median 2.3% in Dallas — top-decile yield for the area; either an underpriced asset or a hidden risk that comps aren't pricing in. Stress-test before assuming the spread holds.
Location & tenants
- Location reads 81/100 on livability (#24 in TX, #1,380 nationally) — a professional / high-income tenant draw. Strengths: amenities A+, commute A+, housing A+; Watch: crime F.
- Dallas ISD (urban): math 31% / reading 36% proficiency, ranked #559 of 826 in TX (top 68%) — families likely to look elsewhere, expect single-tenant / working-renter base with shorter leases; 83% free/reduced lunch — lower-income household profile, screen leases tightly.
- Zoned schools: John W Carpenter El (math 15% / reading 54%, grade F, #1,994 of 4,322 statewide, top 46%, 184 students, 98% FRL).
- Market conditions: Rents rising (+3.7%/yr); 58 active listings in the ZIP; 16 comparable units currently listed for rent nearby; rentals leasing fast (median 8d on market — plan ~1-2 weeks tenant-placement turnaround); 12,577 units permitted in Dallas County in 2024 (6,829 in 5+ unit buildings).
- At $2,262/mo this rent would consume 52% of the median local household income ($52k/yr) (locally 1594% of renters already pay >50% of income on rent) — very limited rent-growth headroom before tenants either downsize or default.
Forward outlook
- Local home prices are declining (-3.0%/yr); year-one equity from $2k of loan paydown is wiped out by about $9k of value loss. Plan a longer hold.
- Dallas County population projected at +35% by 2050 — long-run rental-demand tailwind backs the buy-and-hold thesis.
Negotiation context
- It's been on market 16 days — a 2% lower offer ($295k) is reasonable based on typical stale-listing flexibility.
- 3 sale attempts with the ask held roughly flat each time — persistent listings suggest the price (not the market) is what's stuck; bring a comps-based counter.
Risks & watch-outs
- Climate carrying-cost: major wind risk, 27% chance of damaging wind over 30y; extreme-heat days projected 7→24/yr by 2055 (HVAC capex compounding) — expect insurance premiums to compound above CPI over the hold.
Questions for the listing agent
- What do current leases actually rent for vs. the listed asking? Can we see a recent rent roll and the last 12 months of T-12 income?
- Built in 1969 — when were the roof, HVAC, electrical panel, plumbing, and water heater last replaced?
- What does the HOA fee cover, when was the last increase, and are there any pending special assessments or reserve-fund shortfalls?
- Is there a deadline driving the sale (1031 exchange, divorce, estate, relocation)? That informs how much negotiation room exists.
- Crime grade is F in this area — have there been break-ins, vandalism, or insurance claims at this property in the last 3 years? What carrier currently insures it and at what premium?
- The area grade is low — what's the realistic commute time and amenity access for the typical tenant pool here? Any planned neighborhood developments (good or bad) we should know about?
- What's the average days-on-market for RENTAL listings here right now (not sales)? A rising rental-DOM trend means longer vacancies and softer asking-rent achievability than the comps imply.
- What's the recent tenant-quality profile in this submarket — average credit score on applications, eviction rate, late-payment / NSF rate, and stable-employment percentage? A property-management company in the area should have these aggregated.
- How much new for-sale + rental construction is in the pipeline within 1–3 miles? Heavy new supply typically softens prices + rents 12–24 months out; constrained supply supports both.
Investment metrics
- 1% rule
- 0.76% ✗
- Cap rate
- 4.59%
- Cash-on-cash
- -6.07%
- DSCR
- 0.73
- GRM
- 11.0
CMA / ARV
- ARV (on-the-fly)
- $300,325
- Comps found
- 12
Show comp detail 12 sales within ~0.75 mi
| Address | Dist | Beds/Ba | Sqft | Sold | Price | $/sf | Match |
|---|---|---|---|---|---|---|---|
| 4021 Treeline Dr | 0.04mi | 3/2.0 (-1) | 1,571 (+7%) | 2mo | $279,000 | $178 | 79 |
| 1908 Vatican Ln | 0.16mi | 3/2.0 (-1) | 1,439 (-2%) | 7mo | $305,000 | $212 | 79 |
| 1811 Canelo Dr | 0.26mi | 4/2.0 | 1,539 (+5%) | 2mo | $274,900 | $179 | 78 |
| 4404 Dove Creek Way | 0.29mi | 3/2.0 (-1) | 1,428 (-2%) | 3mo | $292,900 | $205 | 75 |
| 4523 Hamblen Dr | 0.51mi | 4/2.0 | 1,464 (-0%) | 2mo | $295,000 | $202 | 74 |
| 2223 Tosca Ln | 0.37mi | 3/2.0 (-1) | 1,476 (+1%) | 8mo | $270,000 | $183 | 70 |
| 4407 Alamosa Dr | 0.42mi | 3/2.0 (-1) | 1,556 (+6%) | 6mo | $339,000 | $218 | 60 |
| 1820 Sedona Ln | 0.36mi | 3/2.0 (-1) | 1,584 (+8%) | 11mo | $337,000 | $213 | 56 |
| 2012 Ebbtide Ln | 0.36mi | 3/2.5 (-1) | 1,597 (+9%) | 8mo | $255,000 | $160 | 55 |
| 1516 Driftwood Dr | 0.53mi | 3/2.0 (-1) | 1,581 (+8%) | 9mo | $350,000 | $221 | 49 |
| 4516 Dove Creek Way | 0.38mi | 3/2.0 (-1) | 1,674 (+14%) | 8mo | $360,000 | $215 | 46 |
| 1515 Oak Meadows Dr | 0.69mi | 3/2.5 (-1) | 1,654 (+13%) | 2mo | $310,000 | $187 | 38 |
Match score weights: distance 35% · size 25% · config 20% · recency 20%. Top-matched comps best support the ARV.
Projected returns pro-forma
-3.0% appreciation · 3.71% rent growth · sell at horizon
- IRR
- -25.8%
- Equity multiple
- 0.12×
- Total profit
- $-73,678
- Equity at exit
- $44,582
- IRR
- -20.0%
- Equity multiple
- -0.09×
- Total profit
- $-91,622
- Equity at exit
- $25,852
Cash invested: $83,720 (down + closing). Projections, not guarantees.
Landlord ↔ Tenant lean methodology
- Overall (STATE)
- 87 Strongly Landlord-Friendly
- State Texas
- 87 Strongly Landlord-Friendly · R+5
- County
- — inherits STATE
- City
- — inherits STATE
ZIP-level market 75224
- Rents YoY
- 3.7%
- Active inventory
- 58
- Price-to-rent
- 11.0×
Monthly cashflow live
- Estimated rent
- $2,262 high interval (Pro) →
- Mortgage (P&I)
- −$1,568
- Tax from tax record
- −$516 /mo · $6,190/yr
- Insurance
- −$125
- HOA
- −$2
- Vacancy / Maint / Mgmt
- −$475
- Net cashflow
- $-424
Break-even live
UW: 25.0% down · 7.5% · 30yr · 1.5% tax · 5.0% vac · 8.0% maint · 8.0% mgmt
Financing live
Cash to close
- Down payment
- $74,750
- Closing costs
- $8,970
- Reserves months
- —
- Total cash needed
- —
Loan-product check · same deal, 3 products live
Conventional
25% down · 7.5% · 30yr
- Down + closing
- —
- Monthly P&I
- —
- Monthly cashflow
- —
- DSCR
- —
- Eligible?
- —
Personal DTI + credit; lowest rate.
DSCR
20% down · 8.5% · 30yr
- Down + closing
- —
- Monthly P&I
- —
- Monthly cashflow
- —
- DSCR
- —
- Eligible?
- —
No personal income docs; deal must DSCR.
Hard money
10% down · 12.0% · 12mo
- Down + closing
- —
- Monthly P&I
- —
- Monthly cashflow
- —
- DSCR
- —
- Eligible?
- —
Short-term bridge; refi at stabilization.
Rent comps 16 comps
| Address | Beds | Baths | Sqft | Rent | $/sqft | DOM | Units | Dist |
|---|---|---|---|---|---|---|---|---|
| 4028 Treeline Dr Dallas, TX | 3.0 | 3.0 | 1872 | $3,000 | $1.60 | 7d | 1 | 0.04mi |
| 4027 Ovid Ave Dallas, TX | 3.0 | 2.0 | 1031 | $1,725 | $1.67 | 43d | 1 | 0.35mi |
| 4318 Lashley Dr Dallas, TX | 3.0 | 2.0 | 1562 | $2,100 | $1.34 | 5d | 1 | 0.44mi |
| 3702 Legendary Ln Dallas, TX | 1.0–3.0 | 1.0–2.0 | 990 | $1,099 | $1.11 | 3d | 6 | 0.47mi |
| 1135 Holly Glen Cir Dallas, TX | 3.0 | 2.0 | 1707 | $3,400 | $1.99 | 7d | 1 | 0.65mi |
| 5000 S Hampton Rd Dallas, TX | 1.0–3.0 | 1.0–2.0 | 962 | $1,500 | $1.56 | 1d | 6 | 0.83mi |
| 3288 S Polk St Dallas, TX | 1.0–3.0 | 1.0 | 861 | $1,300 | $1.51 | 43d | 1 | 0.84mi |
| 4921 Jade Dr Dallas, TX | 3.0 | 2.0 | 1720 | $1,800 | $1.05 | 7d | 1 | 0.86mi |
| 621 Tarryall Dr Dallas, TX | 4.0 | 2.0 | 1756 | $2,200 | $1.25 | 7d | 1 | 0.89mi |
| 3504 Fawn Valley Dr Dallas, TX | 1.0–3.0 | 1.0–2.0 | 790 | $1,350 | $1.71 | 15d | 1 | 0.93mi |
| 625 W Pentagon Parkway Cir Dallas, TX | 3.0 | 2.0 | 1371 | $2,150 | $1.57 | 7d | 1 | 0.95mi |
| 3828 Morning Springs Trl Dallas, TX | 3.0 | 2.0 | 1399 | $2,200 | $1.57 | 22d | 1 | 1.04mi |
| 3806 Morning Springs Trl Dallas, TX | 3.0 | 2.0 | 1512 | $2,300 | $1.52 | 18d | 1 | 1.05mi |
| 3702 Conway St Dallas, TX | 2.0–3.0 | 1.5–2.0 | 1033 | $1,595 | $1.54 | 1d | 5 | 1.18mi |
| 620 Lacewood Dr Dallas, TX | 3.0 | 1.0 | 1218 | $1,750 | $1.44 | 2d | 1 | 1.21mi |
| 4918 Rockport Dr Dallas, TX | 3.0 | 2.0 | 1673 | $1,800 | $1.08 | 7d | 1 | 1.41mi |
HOA detail
- Monthly dues
- $2 · $24/yr
Listing history 8 events
-
2026-05-15historical Active Option Contract
-
2026-05-10$299,000 Active
-
2026-04-13historical
-
2026-04-03historical Active Option Contract
-
2026-03-24status Active
-
2026-03-18historical Active Option Contract
-
2026-03-04$299,000 Active
-
2001-08-01soldstatus
ⓘ Source: listings_history table (triggers on properties + properties_extension) + one-shot
backfill from property_details.listing_events for pre-trigger history.
Tax reassessment forecast TX · Resets to sale price
- Current annual tax
- $6,190 · $516/mo
- Projected year-2 tax
- $6,190 · $516/mo
- Expected delta
- $0/yr ($0/mo · 0.0%)
ⓘ Screening estimate from a state-policy table — verify with the county assessor before closing.
Climate risk First Street
- Flood 1/10 Low FEMA zone X (unshaded) · 0% chance over 30 yrs
- Wildfire 1/10 Low
- Heat 7/10 Severe 7 d/yr ≥110°F today · 24 d/yr by 30 yrs out
- Wind 6/10 Major 27% chance of damaging wind over 30 yrs
- Air quality 2/10 Low 1 unhealthy d/yr today · 2 by 30 yrs out
Nearby sold comps map
Loading sold comps map…
Walkable amenities ~0.75 mi
Loading nearby amenities…
Taxation est. · year 1
- Rental income
- $27,142
- − Mortgage interest
- −$16,749
- − Property taxes
- −$6,190
- − Insurance
- −$1,495
- − Repairs & maintenance
- −$2,171
- − Management
- −$2,171
- − HOA
- −$24
- − Depreciation
- −$8,698
- Taxable loss
- −$10,357
- Est. tax savings @ 24.0%
- +$2,486
- After-tax cash flow
- $-2,597/yr
For passive investors: Depreciation is non-cash, so a rental often shows a tax loss while cash-flowing — sheltering income. Rental losses are passive: they offset passive income freely, and up to $25,000/yr can offset ordinary (W-2) income if you actively participate and your MAGI is under $100k (phasing out to $0 by $150k); unused losses carry forward. On sale, claimed depreciation is recaptured at up to 25%, and gains may owe capital-gains tax (a 1031 exchange can defer both). Figures are a year-1 estimate at your 24.0% rate — not tax advice; consult a CPA.
Schools (NCES district)
- District
- Dallas ISD
- NCES district ID
- 4816230
- Math proficiency
- 31% ▼ -16.00%
- Reading proficiency
- 36% ▼ -4.00%
- Median HH income
- $42,881
- Composite
- 28.41/100
- National rank
- #6763
- State rank
- #559 of 826 in TX
Livability — Dallas
- Score
- 81/100
- State rank
- #24
- US rank
- #1380
Category grades
Schools grade is shown separately in the Schools card above.
Census & demographics
- Census place
- Dallas, TX
- County
- Dallas County · 2,612,404 people
- City population
- 1,168,437
- Metro
- Dallas-Fort Worth-Arlington, TX
- Population (ZIP)
- 35,105
- Household income
- $51,919
- Rent vs Own
- Severe rent burden
- 1594.0
Population outlook (Dallas County) Hauer SSP2
- Today (2025)
- 2,979,839 people
- By 2030
- 3,191,823 · +7.1%
- By 2040
- 3,619,611 · +21.5%
- By 2050
- 4,026,915 · +35.1%
- By 2075
- 4,957,073 · +66.4%
- By 2100
- 5,508,725 · +84.9%
Race, ethnicity, and origin ACS 2023
- Neighborhood character
- Diverse neighborhood (Simpson 0.56)
- Race & ethnicity
- Hispanic / Latino 59% Black 29% Two or more races 19% White 9% Native American 1%
- Hispanic origin (detail)
- Mexican 53%
- Common ancestry
- Serbian 1% Slovak 1% Italian 1%
- Foreign-born
- 25% · Canada
- Languages at home
- 47% English-only · Spanish 51% Other Indo-European 1%
Political lean MEDSL · Dallas
- 2024 margin
- Strong D (+22.2) · D 60.2% · R 38.0% · Other 1.8%
- 2008→2024 swing
- +6.9pp toward D · 2008: 15.3pp · 2024: 22.2pp
- All cycles
- 2024: D+22.2 2020: D+31.6 2016: D+26.2 2012: D+15.4 2008: D+15.3
Not yet ingested
- Civics
- —
Market trends
- HPI YoY
- ▼ -285.86%
- Current HPI
- 328.3162
- Rent YoY
- ▲ 3.71%
- Metro
- Dallas-Fort Worth-Arlington, TX
- State GDP YoY
- ▲ 3.95%
- F500 in state
- 110
Industry mix (Fortune 500 HQ in TX)
| Industry | F500 HQs | Revenue |
|---|---|---|
| Energy | 16 | $1,198B |
|
||
| Technology | 5 | $198B |
|
||
| Engineering / Construction | 4 | $72B |
|
||
| Energy Services | 3 | $60B |
|
||
| Utilities | 3 | $41B |
|
||
| Healthcare | 2 | $330B |
|
||
Price history
+0.0% since first listed8 events — show timeline
- 2026-05-15 Contingent — NTREIS
- 2026-05-10 Listed $299,000 NTREIS
- 2026-04-13 Listing Removed — NTREIS
- 2026-04-03 Contingent — NTREIS
- 2026-03-24 Relisted — NTREIS
- 2026-03-18 Contingent — NTREIS
- 2026-03-04 Listed $299,000 NTREIS
- 2001-08-01 Sold (Public Records) — Public Records
Property tax history
+5.0%/yrLatest (2025): $6,190 · -0.4% YoY. Source: county tax records.
Cash-flow waterfall
monthlySold comps — $/sqft
last 12 mo · ≤1 miLoading sold comps…