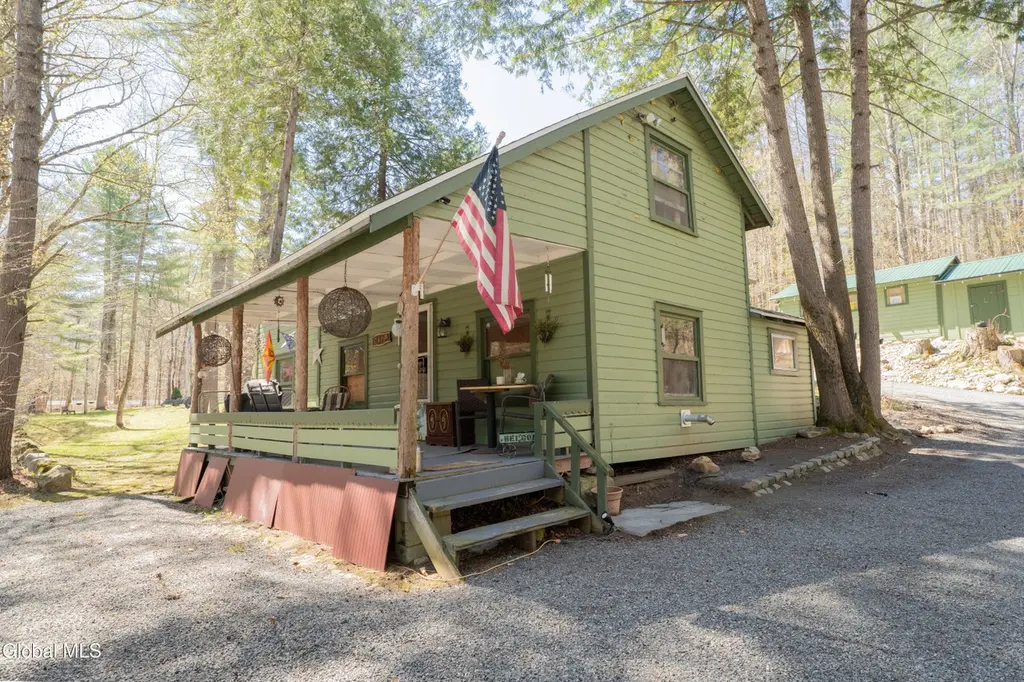
141 River Rd · Northville, NY
Flood risk 1/10 · Minimal
- FEMA flood zone
- —
- Chance of flooding over 30 yrs
- 0.0%
- Est. flood insurance / yr
- —
Fire risk 3/10 · Minor
- Est. fire insurance / yr
- $691 – $1,283
Heat risk 2/10 · Minimal
- Hot days now (above 91°F)
- 7 days/yr
- Hot days in 30 yrs
- 17 days/yr
Wind risk 2/10 · Minimal
- Chance of severe wind over 30 yrs
- 2.0%
Air-quality risk 1/10 · Minimal
- Unhealthy air days now
- 0 days/yr
- Unhealthy air days in 30 yrs
- 0 days/yr
Risk factors via First Street. Map © Google.
Why this score? — see what drove the C+ grade
The composite is a weighted blend of 9 inputs, each scored 0–100. Each bar is that input's sub-score; the figure is the points it added to the 100-point composite (weight × sub-score).
- Cash flow +15.4/30.0
- ARV discount +15.0/15.0
- Appreciation +10.0/10.0
- DSCR +4.7/10.0
- Schools +4.3/10.0
- 1% rule +3.5/10.0
- Livability +3.2/5.0
- Rent growth +2.5/5.0
- Condition / age +2.5/5.0
$239,500
🖨 Deal sheet (PDF) 📄 Offer letter ✓ Due diligence
Listing remarks
Tucked away in a private, park-like wooded setting, this unique property offers a variety of buildings, including a rustic 3-bedroom camp, surrounded by nature and opportunity. The main camp has a charming, cozy feel with a newer roof and heat and some insulation on the first floor, making it ideal to enjoy as-is or remodel and reimagine it into something new! A spacious 26' x 30' pavilion features a concrete floor, power, and an outdoor kitchen, opening to a large fire pit set against the forest--perfect for entertaining or relaxing under the stars. The pavilion could also be used as a carport with covered storage for vehicles or toys. The grounds are thoughtfully laid out and designed for
Key facts
- On demand hot water
- Garage woodshed
- Large fire pit
Tags
Property features AI
Exterior
- Parking: Space for 10 vehicles; Stone parking area; Carport; Driveway
- Utilities: Septic tank
- Home design: Cabin property type
- Construction: Wood siding; Shingle roof
- Exterior features: Front porch; Outdoor lighting; Outdoor kitchen; Outdoor shower; Shed(s); Private, wooded and partially cleared landscaped lot (1.6 acres)
Interior
- Kitchen: Kitchen includes a refrigerator
- Bedrooms: One bedroom on the first floor; Two bedrooms on the second floor
- Bathrooms: Two full bathrooms (both on the first floor)
- Heating & cooling: Electric heating; Pellet stove; Space heater
- Interior features: Five total rooms; Living room with a pellet stove fireplace; Basement with pillar/post/pier foundation
- Laundry & utility: No laundry appliance details provided
Neighborhood map
What this means for you Summary
Snapshot
- This is a 3-bed/1.0-bath single-family listed at $240k.
Deal economics
- At list price, monthly cash flow is $91 ($1k/yr) — positive.
- The deal already cash-flows at list — no discount required.
- To meet the 1% rule (rent ≥ 1% of price), the offer needs to be $203k (15.3% below list).
- Recommended offer: $203k (15.3% below list) — sets the bar for 1% rule.
- Cap rate 6.8% vs local median 2.9% in Northville — top-decile yield for the area; either an underpriced asset or a hidden risk that comps aren't pricing in. Stress-test before assuming the spread holds.
Location & tenants
- Location reads 64/100 on livability (#759 in NY) — a middle-class / working-renter tenant base. Strengths: crime A+, employment A+, housing A; Watch: amenities F, commute F, cost of living F.
- Northville Central School District (rural): math 51% / reading 45% proficiency, ranked #500 of 755 in NY (top 66%) — families likely to look elsewhere, expect single-tenant / working-renter base with shorter leases.
- Zoned schools: Northville Elementary School (math 52% / reading 62%, grade C+, #842 of 2,108 statewide, top 43%, 175 students, 55% FRL); Northville High School (math 37% / reading 42%, grade F, #1,060 of 1,100 statewide, top 97%, 256 students, 44% FRL).
- Market conditions: 51 active listings in the ZIP; 55 units permitted in Hamilton County in 2024 (0 in 5+ unit buildings).
Forward outlook
- In year one you build about $26k of equity ($2k loan paydown + $24k appreciation (10.0% local appreciation)).
- Hamilton County population projected at -26% by 2050 — secular population decline; favor cash flow + early exit over multi-decade hold.
- At projected returns (10.0% appreciation + 3.0% rent growth), your $67k cash investment doubles in ~3 years — after that, you're playing with house money.
- By year 2, paydown + projected appreciation supports a ~$41k cash-out refi (75% LTV) — recoverable capital for the next deal without selling this one.
Negotiation context
- It's been on market 47 days — a 3% lower offer ($232k) is reasonable based on typical stale-listing flexibility.
- Current owner paid $53k; list at $240k implies a 352% gain — meaningful room to come down on a strong offer.
Risks & watch-outs
- Watch-outs: built in 1927 — expect roof / HVAC / electrical / plumbing capex.
Questions for the listing agent
- It's been on market 47 days. Have you received any prior offers? Is the seller open to a 15% concession, seller financing, or rate buy-down credit?
- Built in 1927 — when were the roof, HVAC, electrical panel, plumbing, and water heater last replaced?
- Is there a deadline driving the sale (1031 exchange, divorce, estate, relocation)? That informs how much negotiation room exists.
- Schools are B-rated — typically a magnet for longer-tenancy family renters. What's the average tenant stay here, and is there a school-zone premium baked into asking?
- What's the average days-on-market for RENTAL listings here right now (not sales)? A rising rental-DOM trend means longer vacancies and softer asking-rent achievability than the comps imply.
- What's the recent tenant-quality profile in this submarket — average credit score on applications, eviction rate, late-payment / NSF rate, and stable-employment percentage? A property-management company in the area should have these aggregated.
- How much new for-sale + rental construction is in the pipeline within 1–3 miles? Heavy new supply typically softens prices + rents 12–24 months out; constrained supply supports both.
Investment metrics
- 1% rule
- 0.85% ✗
- Cap rate
- 6.75%
- Cash-on-cash
- 1.64%
- DSCR
- 1.07
- GRM
- 9.8
CMA / ARV
- ARV (median comp)
- $325,343
- List price
- $239,500
- Delta
- -26.39%
- Verdict
- UNDERPRICED
- Comps
- 2 within 1.0 mi
Show comp detail 1 sale within ~0.75 mi
| Address | Dist | Beds/Ba | Sqft | Sold | Price | $/sf | Match |
|---|---|---|---|---|---|---|---|
| 283 Old Northville Rd | 0.48mi | 3/1.0 | 1,240 (+9%) | 24mo | $270,000 | $218 | 42 |
Match score weights: distance 35% · size 25% · config 20% · recency 20%. Top-matched comps best support the ARV.
Projected returns pro-forma
10.0% appreciation · 3.0% rent growth · sell at horizon
- IRR
- 25.4%
- Equity multiple
- 3.03×
- Total profit
- $136,207
- Equity at exit
- $215,761
- IRR
- 22.4%
- Equity multiple
- 6.91×
- Total profit
- $396,409
- Equity at exit
- $465,296
Cash invested: $67,060 (down + closing). Projections, not guarantees.
Landlord ↔ Tenant lean methodology
- Overall (STATE)
- 15 Strongly Tenant-Friendly
- State New York
- 15 Strongly Tenant-Friendly · D+10
- County
- — inherits STATE
- City
- — inherits STATE
ZIP-level market 12134
- Home prices YoY
- 7.8%
- Active inventory
- 51
- Price-to-rent
- 9.8×
Monthly cashflow live
- Estimated rent
- $2,027 medium interval (Pro) →
- Mortgage (P&I)
- −$1,256
- Tax from tax record
- −$154 /mo · $1,853/yr
- Insurance
- −$100
- HOA
- −$0
- Vacancy / Maint / Mgmt
- −$426
- Net cashflow
- $91
Break-even live
Sensitivity live
| Price | -10% $227 | -5% $159 | +0% $91 | +5% $24 | +10% $-44 |
|---|---|---|---|---|---|
| Rent | -10% $-69 | -5% $11 | +0% $91 | +5% $172 | +10% $252 |
| Rate | -1.0pp $212 | -0.5pp $152 | base $91 | +0.5pp $29 | +1.0pp $-34 |
UW: 25.0% down · 7.5% · 30yr · 1.5% tax · 5.0% vac · 8.0% maint · 8.0% mgmt
Financing live
Cash to close
- Down payment
- $59,875
- Closing costs
- $7,185
- Reserves months
- —
- Total cash needed
- —
Loan-product check · same deal, 3 products live
Conventional
25% down · 7.5% · 30yr
- Down + closing
- —
- Monthly P&I
- —
- Monthly cashflow
- —
- DSCR
- —
- Eligible?
- —
Personal DTI + credit; lowest rate.
DSCR
20% down · 8.5% · 30yr
- Down + closing
- —
- Monthly P&I
- —
- Monthly cashflow
- —
- DSCR
- —
- Eligible?
- —
No personal income docs; deal must DSCR.
Hard money
10% down · 12.0% · 12mo
- Down + closing
- —
- Monthly P&I
- —
- Monthly cashflow
- —
- DSCR
- —
- Eligible?
- —
Short-term bridge; refi at stabilization.
Listing history 15 events
-
2026-06-17status $239,500 Pending 47 DOM
-
2026-06-16days on market $239,500 Active 47 DOM
-
2026-06-15days on market $239,500 Active 46 DOM
-
2026-06-13days on market $239,500 Active 44 DOM
-
2026-06-12days on market $239,500 Active 43 DOM
-
2026-06-09days on market $239,500 Active 40 DOM
-
2026-06-08days on market $239,500 Active 39 DOM
-
2026-06-07days on market $239,500 Active 38 DOM
-
2026-06-05days on market $239,500 Active 36 DOM
-
2026-06-04days on market $239,500 Active 34 DOM
-
2026-06-02days on market $239,500 Active 33 DOM
-
2026-06-01days on market $239,500 Active 32 DOM
-
2026-05-31days on market $239,500 Active 31 DOM
-
2026-04-30$249,500 Active 1396-char remark
-
2009-06-12soldstatus $53,000
ⓘ Source: listings_history table (triggers on properties + properties_extension) + one-shot
backfill from property_details.listing_events for pre-trigger history.
Tax reassessment forecast NY · Partial reset (capped growth)
- Current annual tax
- $1,853 · $154/mo
- Projected year-2 tax
- $2,950 · $246/mo
- Expected delta
- +$1,097/yr (+$91/mo · 59.2%)
ⓘ Screening estimate from a state-policy table — verify with the county assessor before closing.
Climate risk First Street
- Flood 1/10 Low 0% chance over 30 yrs
- Wildfire 3/10 Moderate
- Heat 2/10 Low 7 d/yr ≥91°F today · 17 d/yr by 30 yrs out
- Wind 2/10 Low 2% chance of damaging wind over 30 yrs
- Air quality 1/10 Low 0 unhealthy d/yr today · 0 by 30 yrs out
Nearby sold comps map
Loading sold comps map…
Walkable amenities ~0.75 mi
Loading nearby amenities…
Taxation est. · year 1
- Rental income
- $24,330
- − Mortgage interest
- −$13,416
- − Property taxes
- −$1,853
- − Insurance
- −$1,198
- − Repairs & maintenance
- −$1,946
- − Management
- −$1,946
- − Depreciation
- −$6,967
- Taxable loss
- −$2,997
- Est. tax savings @ 24.0%
- +$719
- After-tax cash flow
- $1,817/yr
For passive investors: Depreciation is non-cash, so a rental often shows a tax loss while cash-flowing — sheltering income. Rental losses are passive: they offset passive income freely, and up to $25,000/yr can offset ordinary (W-2) income if you actively participate and your MAGI is under $100k (phasing out to $0 by $150k); unused losses carry forward. On sale, claimed depreciation is recaptured at up to 25%, and gains may owe capital-gains tax (a 1031 exchange can defer both). Figures are a year-1 estimate at your 24.0% rate — not tax advice; consult a CPA.
Schools (NCES district)
- District
- Northville Central School District
- NCES district ID
- 3621300
- Math proficiency
- 51% ▼ -8.00%
- Reading proficiency
- 45% ▼ -2.00%
- Median HH income
- $48,564
- Composite
- 43.1/100
- National rank
- #6626
- State rank
- #500 of 755 in NY
Livability — Northville
- Score
- 64/100
- State rank
- #759
- US rank
- #14567
Category grades
Schools grade is shown separately in the Schools card above.
Census & demographics
- Population (ZIP)
- 4,093
Population outlook (Hamilton County) Hauer SSP2
- Today (2025)
- 4,374 people
- By 2030
- 4,157 · -5.0%
- By 2040
- 3,641 · -16.8%
- By 2050
- 3,238 · -26.0%
- By 2075
- 2,644 · -39.6%
- By 2100
- 2,017 · -53.9%
Race, ethnicity, and origin ACS 2023
- Neighborhood character
- Predominantly White (92%)
- Race & ethnicity
- White 92% Two or more races 6% Hispanic / Latino 5%
- Common ancestry
- Romanian 7% Lithuanian 6% Iranian 6%
- Foreign-born
- 2% · Canada
- Languages at home
- 98% English-only · Spanish 1%
Political lean MEDSL · Hamilton
- 2024 margin
- Strong R (+29.5) · D 35.3% · R 64.7%
- 2008→2024 swing
- -2.6pp toward R · 2008: -26.9pp · 2024: -29.5pp
- All cycles
- 2024: R+29.5 2020: R+30.3 2016: R+38.8 2012: R+26.2 2008: R+26.9
Not yet ingested
- Civics
- —
Market trends
- HPI YoY
- ▲ 25.95%
- Current HPI
- 358.0334
- Rent YoY
- —
- Metro
- —
- State GDP YoY
- ▲ 2.60%
- F500 in state
- 92
Industry mix (Fortune 500 HQ in NY)
| Industry | F500 HQs | Revenue |
|---|---|---|
| Financial Services | 10 | $950B |
|
||
| Consumer Goods | 9 | $162B |
|
||
| Insurance | 4 | $225B |
|
||
| Telecommunications | 2 | $144B |
|
||
| Pharmaceuticals | 2 | $112B |
|
||
| Media / Entertainment | 2 | $69B |
|
||
Price history
+351.9% since first listed4 events — show timeline
- 2026-06-17 Pending — Global MLS
- 2026-05-29 Price Changed $239,500 Global MLS
- 2026-04-30 Listed $249,500 Global MLS
- 2009-06-12 Sold (Public Records) $53,000 Public Records
Property tax history
+5.8%/yrLatest (2025): $1,853 · +3.5% YoY. Source: county tax records.
Cash-flow waterfall
monthlySold comps — $/sqft
last 12 mo · ≤1 miLoading sold comps…