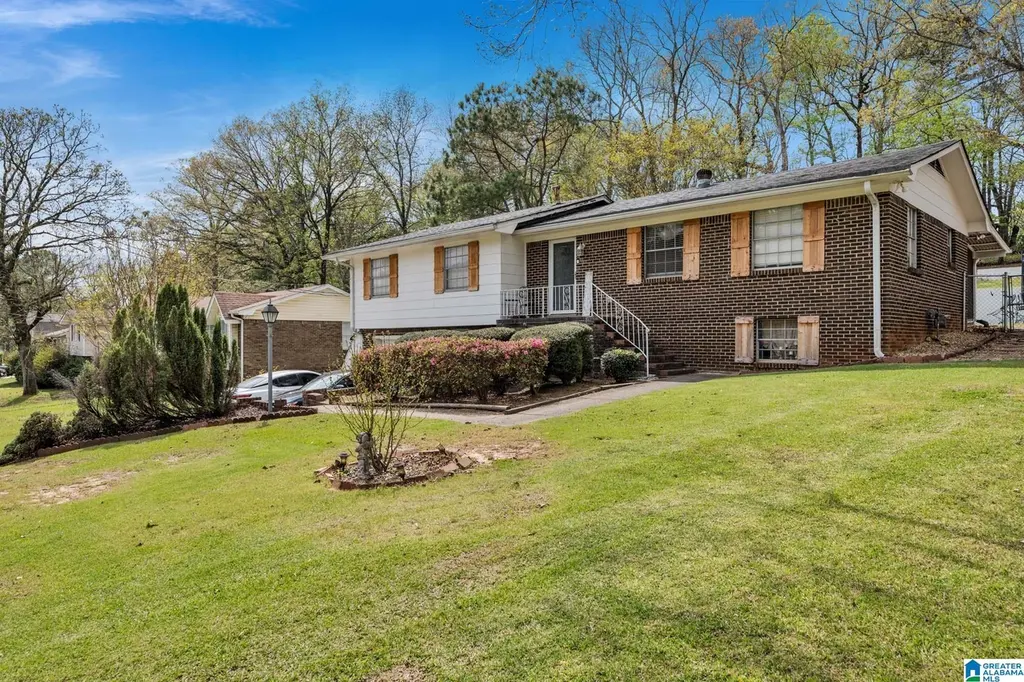
1962 Brewster Rd · Grayson Valley, AL
Flood risk 1/10 · Minimal
- FEMA flood zone
- X (unshaded)
- Chance of flooding over 30 yrs
- 0.0%
- Est. flood insurance / yr
- $473 – $860
Fire risk 3/10 · Minor
- Est. fire insurance / yr
- $916 – $1,700
Heat risk 5/10 · Moderate
- Hot days now (above 105°F)
- 7 days/yr
- Hot days in 30 yrs
- 18 days/yr
Wind risk 6/10 · Moderate
- Chance of severe wind over 30 yrs
- 27.0%
Air-quality risk 5/10 · Moderate
- Unhealthy air days now
- 7 days/yr
- Unhealthy air days in 30 yrs
- 9 days/yr
Risk factors via First Street. Map © Google.
Why this score? — see what drove the D grade
The composite is a weighted blend of 9 inputs, each scored 0–100. Each bar is that input's sub-score; the figure is the points it added to the 100-point composite (weight × sub-score).
- Cash flow +12.9/30.0
- ARV discount +11.3/15.0
- DSCR +3.9/10.0
- Rent growth +3.8/5.0
- Livability +3.2/5.0
- 1% rule +2.6/10.0
- Condition / age +2.5/5.0
- Schools +1.8/10.0
- Appreciation +0.0/10.0
$209,900
🖨 Deal sheet (PDF) 📄 Offer letter ✓ Due diligence
Listing remarks MLS
Need more space? Check out this cute 3 (could be 4th) bedrooms, 3 full baths with finished basement. Screened in porch overlooking large backyard. Updated bathrooms. Huge kitchen with tons of cabinet and countertop space. Cute curb appeal and minutes from shopping and interstate!
Key facts
- Screened in porch
- Large backyard
- Finished basement
Tags
Neighborhood map
What this means for you Summary
Snapshot
- This is a 3-bed/2.0-bath single-family listed at $210k.
Deal economics
- At list price, monthly cash flow is $-15 ($-181/yr) — negative.
- To cash-flow at today's rent, offer at most $207k (1.3% below list).
- To meet the 1% rule (rent ≥ 1% of price), the offer needs to be $159k (24.3% below list).
- Recommended offer: $159k (24.3% below list) — sets the bar for 1% rule.
Location & tenants
- Location reads 65/100 on livability (#139 in AL) — a middle-class / working-renter tenant base. Strengths: cost of living A+, housing B+; Watch: amenities F, commute F, employment D-.
- Jefferson County (suburban): math 9% / reading 32% proficiency, ranked #104 of 129 in AL (top 81%) — low school quality limits family demand, transient renter base, plan for 1-2y turnover.
- Zoned schools: Chalkville Elementary School (math 6% / reading 16%, grade F, #560 of 627 statewide, top 90%, 854 students, 79% FRL); Claychalkville Middle School (math 2% / reading 26%, grade F, #209 of 257 statewide, top 82%, 1,032 students, 64% FRL); Claychalkville High School (math 6% / reading 9%, grade F, #261 of 305 statewide, top 87%, 1,361 students, 56% FRL) — zoned schools average 66% FRL vs 49% district-wide (18 pts higher); higher-poverty schools than district average — tighter screening recommended.
- Market conditions: Rents rising fast (+5.4%/yr); 115 active listings in the ZIP; 21 comparable units currently listed for rent nearby; rentals at typical pace (median 26d on market — plan ~3-4 weeks tenant-placement turnaround); 48% of comp listings sitting > 30 days — soft ceiling on asking rent; 2,114 units permitted in Jefferson County in 2024 (556 in 5+ unit buildings).
- This rent runs 30% of the median local income ($63k/yr) — at the standard rent-burdened threshold; future hikes will face affordability resistance.
Forward outlook
- Local home prices are declining (-3.0%/yr); year-one equity from $1k of loan paydown is wiped out by about $6k of value loss. Plan a longer hold.
- Jefferson County population projected to shrink 4% by 2050 — rents likely to lag national; underwrite the cash flow, not the appreciation.
Negotiation context
- It's been on market 79 days — a 6% lower offer ($197k) is reasonable based on typical stale-listing flexibility.
- Current owner paid $74k; list at $210k implies a 183% gain — meaningful room to come down on a strong offer.
Risks & watch-outs
- Climate carrying-cost: major wind risk, 27% chance of damaging wind over 30y; extreme-heat days projected 7→18/yr by 2055 (HVAC capex compounding) — expect insurance premiums to compound above CPI over the hold.
Questions for the listing agent
- What do current leases actually rent for vs. the listed asking? Can we see a recent rent roll and the last 12 months of T-12 income?
- It's been on market 79 days. Have you received any prior offers? Is the seller open to a 24% concession, seller financing, or rate buy-down credit?
- Built in 1970 — when were the roof, HVAC, electrical panel, plumbing, and water heater last replaced?
- Why hasn't it sold? Are there any deal-killer items the seller is aware of (foundation, flood, title, zoning, code violations)?
- Is there a deadline driving the sale (1031 exchange, divorce, estate, relocation)? That informs how much negotiation room exists.
- Schools are D-rated, which usually means shorter tenancies and higher turnover. Who's the typical renter profile here, and what's been the actual vacancy rate?
- The area grade is low — what's the realistic commute time and amenity access for the typical tenant pool here? Any planned neighborhood developments (good or bad) we should know about?
- What's the average days-on-market for RENTAL listings here right now (not sales)? A rising rental-DOM trend means longer vacancies and softer asking-rent achievability than the comps imply.
- What's the recent tenant-quality profile in this submarket — average credit score on applications, eviction rate, late-payment / NSF rate, and stable-employment percentage? A property-management company in the area should have these aggregated.
- How much new for-sale + rental construction is in the pipeline within 1–3 miles? Heavy new supply typically softens prices + rents 12–24 months out; constrained supply supports both.
Investment metrics
- 1% rule
- 0.76% ✗
- Cap rate
- 6.21%
- Cash-on-cash
- -0.31%
- DSCR
- 0.99
- GRM
- 11.0
CMA / ARV
- ARV (median comp)
- $229,426
- List price
- $209,900
- Delta
- -8.51%
- Verdict
- FAIR
- Comps
- 20 within 1.0 mi
Show comp detail 12 sales within ~0.75 mi
| Address | Dist | Beds/Ba | Sqft | Sold | Price | $/sf | Match |
|---|---|---|---|---|---|---|---|
| 1991 Westridge Dr | 0.39mi | 3/2.0 | 2,095 (-1%) | 2mo | $238,900 | $114 | 79 |
| 1940 Carlisle Dr | 0.32mi | 3/3.0 | 2,081 (-2%) | 4mo | $222,200 | $107 | 75 |
| 2015 Carraway Ln | 0.22mi | 4/2.0 (+1) | 2,026 (-4%) | 3mo | $229,500 | $113 | 75 |
| 2128 Carraway St | 0.46mi | 4/2.5 (+1) | 2,138 (+1%) | 1mo | $253,400 | $119 | 69 |
| 1873 Pebble Lake Dr | 0.60mi | 3/2.0 | 2,126 (+0%) | 3mo | $179,000 | $84 | 69 |
| 1936 Carraway St | 0.33mi | 4/2.5 (+1) | 1,986 (-6%) | 5mo | $160,000 | $81 | 64 |
| 5104 Alex Way | 0.71mi | 3/2.0 | 2,097 (-1%) | 5mo | $220,000 | $105 | 61 |
| 2030 Carraway St | 0.30mi | 4/3.0 (+1) | 2,325 (+10%) | 5mo | $249,000 | $107 | 56 |
| 1009 Chalkville School Rd | 0.52mi | 3/2.0 | 1,865 (-12%) | 2mo | $195,000 | $105 | 55 |
| 1713 Sam Dr | 0.47mi | 4/3.0 (+1) | 1,914 (-10%) | 3mo | $170,000 | $89 | 51 |
| 1711 Tudor Dr | 0.71mi | 3/2.5 | 1,933 (-9%) | 1mo | $200,000 | $103 | 50 |
| 1621 Mardis Dr | 0.55mi | 4/2.0 (+1) | 1,828 (-14%) | 4mo | $213,500 | $117 | 44 |
Match score weights: distance 35% · size 25% · config 20% · recency 20%. Top-matched comps best support the ARV.
Projected returns pro-forma
-3.0% appreciation · 5.39% rent growth · sell at horizon
- IRR
- -14.5%
- Equity multiple
- 0.47×
- Total profit
- $-31,144
- Equity at exit
- $31,297
- IRR
- -2.7%
- Equity multiple
- 0.80×
- Total profit
- $-11,837
- Equity at exit
- $18,148
Cash invested: $58,772 (down + closing). Projections, not guarantees.
Landlord ↔ Tenant lean methodology
- Overall (STATE)
- 90 Strongly Landlord-Friendly
- State Alabama
- 90 Strongly Landlord-Friendly · R+15
- County
- — inherits STATE
- City
- — inherits STATE
ZIP-level market 35235
- Home prices YoY
- -21.1%
- Rents YoY
- 5.4%
- Active inventory
- 115
- Price-to-rent
- 11.0×
Monthly cashflow live
- Estimated rent
- $1,590 high interval (Pro) →
- Mortgage (P&I)
- −$1,101
- Tax from tax record
- −$83 /mo · $994/yr
- Insurance
- −$87
- HOA
- −$0
- Vacancy / Maint / Mgmt
- −$334
- Net cashflow
- $-15
Break-even live
Sensitivity live
| Price | -10% $104 | -5% $44 | +0% $-15 | +5% $-74 | +10% $-134 |
|---|---|---|---|---|---|
| Rent | -10% $-141 | -5% $-78 | +0% $-15 | +5% $48 | +10% $111 |
| Rate | -1.0pp $91 | -0.5pp $38 | base $-15 | +0.5pp $-69 | +1.0pp $-125 |
UW: 25.0% down · 7.5% · 30yr · 1.5% tax · 5.0% vac · 8.0% maint · 8.0% mgmt
Financing live
Cash to close
- Down payment
- $52,475
- Closing costs
- $6,297
- Reserves months
- —
- Total cash needed
- —
Loan-product check · same deal, 3 products live
Conventional
25% down · 7.5% · 30yr
- Down + closing
- —
- Monthly P&I
- —
- Monthly cashflow
- —
- DSCR
- —
- Eligible?
- —
Personal DTI + credit; lowest rate.
DSCR
20% down · 8.5% · 30yr
- Down + closing
- —
- Monthly P&I
- —
- Monthly cashflow
- —
- DSCR
- —
- Eligible?
- —
No personal income docs; deal must DSCR.
Hard money
10% down · 12.0% · 12mo
- Down + closing
- —
- Monthly P&I
- —
- Monthly cashflow
- —
- DSCR
- —
- Eligible?
- —
Short-term bridge; refi at stabilization.
Rent comps 21 comps
| Address | Beds | Baths | Sqft | Rent | $/sqft | DOM | Units | Dist |
|---|---|---|---|---|---|---|---|---|
| 1819 Valley Run Cir Birmingham, AL | 4.0 | 2.5 | 1694 | $1,761 | $1.04 | 45d | 1 | 0.26mi |
| 1748 Sonia Dr Birmingham, AL | 4.0 | 2.0 | 1401 | $1,395 | $1.00 | 45d | 1 | 0.41mi |
| 1760 Sonia Dr Birmingham, AL | 3.0 | 2.0 | 1550 | $1,635 | $1.05 | 3d | 1 | 0.42mi |
| 1830 Christian St Birmingham, AL | 3.0 | 2.0 | 1468 | $1,375 | $0.94 | 5d | 1 | 0.47mi |
| 1868 Carraway St Birmingham, AL | 3.0 | 2.0 | 1819 | $1,500 | $0.82 | 25d | 1 | 0.47mi |
| 1808 Brewster Rd Birmingham, AL | 4.0 | 2.0 | 1548 | $1,515 | $0.98 | 45d | 1 | 0.57mi |
| 1839 Satterwhite St Birmingham, AL | 4.0 | 2.0 | 2443 | $1,671 | $0.68 | 45d | 1 | 0.65mi |
| 2202 Cheshire Dr Birmingham, AL | 3.0 | 2.5 | 1536 | $1,325 | $0.86 | 4d | 1 | 0.81mi |
| 1733 Molly Dr Birmingham, AL | 4.0 | 1.5 | 1570 | $1,460 | $0.93 | 12d | 1 | 0.86mi |
| 600 20th Ct NE Center Point, AL | 3.0 | 2.0 | 1878 | $1,650 | $0.88 | 25d | 1 | 0.91mi |
| 1761 Big Mountain Dr Birmingham, AL | 4.0 | 2.0 | 1632 | $1,575 | $0.97 | 46d | 1 | 1.05mi |
| 5240 Jean Dr Pinson, AL | 4.0 | 2.0 | 1714 | $1,695 | $0.99 | 45d | 1 | 1.05mi |
| 2232 6th St NE Center Point, AL | 3.0 | 1.0 | 1550 | $1,150 | $0.74 | 45d | 1 | 1.11mi |
| 413 20th Ct NE Center Point, AL | 3.0 | 1.5 | 1540 | $1,375 | $0.89 | 45d | 1 | 1.20mi |
| 5010 Darlene Dr Pinson, AL | 3.0 | 2.0 | 1914 | $1,550 | $0.81 | 25d | 1 | 1.22mi |
| 2249 4th Place Cir NE Center Point, AL | 3.0 | 1.5 | 1400 | $1,400 | $1.00 | 45d | 1 | 1.25mi |
| 1729 Tall Oak Cir Birmingham, AL | 3.0 | 2.0 | 1403 | $1,630 | $1.16 | 3d | 1 | 1.25mi |
| 5140 Hickory Dr NE Pinson, AL | 3.0 | 1.5 | 1518 | $1,465 | $0.97 | 23d | 1 | 1.29mi |
| 2505 Martin Rd Birmingham, AL | 4.0 | 2.0 | 1551 | $1,550 | $1.00 | 3d | 1 | 1.34mi |
| 1700 Serene Dr Birmingham, AL | 4.0 | 1.5 | 1543 | $1,630 | $1.06 | 4d | 1 | 1.41mi |
| 2708 7th St NE Center Point, AL | 3.0 | 1.0 | 1451 | $1,150 | $0.79 | 45d | 1 | 1.48mi |
Listing history 18 events
-
2026-06-22days on market $209,900 Active 79 DOM
-
2026-06-18days on market $209,900 Active 76 DOM
-
2026-06-17days on market $209,900 Active 75 DOM
-
2026-06-16days on market $209,900 Active 74 DOM
-
2026-06-15days on market $209,900 Active 73 DOM
-
2026-06-13days on market $209,900 Active 71 DOM
-
2026-06-10days on market $209,900 Active 68 DOM
-
2026-06-09days on market $209,900 Active 67 DOM
-
2026-06-08days on market $209,900 Active 66 DOM
-
2026-06-07days on market $209,900 Active 65 DOM
-
2026-06-03days on market $209,900 Active 61 DOM
-
2026-06-02days on market $209,900 Active 60 DOM
-
2026-06-01days on market $209,900 Active 59 DOM
-
2026-05-31days on market $209,900 Active 58 DOM
-
2026-04-03$209,900 Active 280-char remark
Show marketing remark (280 chars)
Need more space? Check out this cute 3 (could be 4th) bedrooms, 3 full baths with finished basement. Screened in porch overlooking large backyard. Updated bathrooms. Huge kitchen with tons of cabinet and countertop space. Cute curb appeal and minutes from shopping and interstate!
-
2008-08-15soldstatus $74,300
-
1989-03-17soldstatus $72,000
-
1987-05-01soldstatus $64,000
ⓘ Source: listings_history table (triggers on properties + properties_extension) + one-shot
backfill from property_details.listing_events for pre-trigger history.
Tax reassessment forecast AL · Resets to sale price
- Current annual tax
- $994 · $83/mo
- Projected year-2 tax
- $994 · $83/mo
- Expected delta
- $0/yr ($0/mo · 0.0%)
ⓘ Screening estimate from a state-policy table — verify with the county assessor before closing.
Climate risk First Street
- Flood 1/10 Low FEMA zone X (unshaded) · 0% chance over 30 yrs
- Wildfire 3/10 Moderate
- Heat 5/10 Major 7 d/yr ≥105°F today · 18 d/yr by 30 yrs out
- Wind 6/10 Major 27% chance of damaging wind over 30 yrs
- Air quality 5/10 Major 7 unhealthy d/yr today · 9 by 30 yrs out
Nearby sold comps map
Loading sold comps map…
Walkable amenities ~0.75 mi
Loading nearby amenities…
Taxation est. · year 1
- Rental income
- $19,078
- − Mortgage interest
- −$11,758
- − Property taxes
- −$994
- − Insurance
- −$1,050
- − Repairs & maintenance
- −$1,526
- − Management
- −$1,526
- − Depreciation
- −$6,106
- Taxable loss
- −$3,882
- Est. tax savings @ 24.0%
- +$932
- After-tax cash flow
- $751/yr
For passive investors: Depreciation is non-cash, so a rental often shows a tax loss while cash-flowing — sheltering income. Rental losses are passive: they offset passive income freely, and up to $25,000/yr can offset ordinary (W-2) income if you actively participate and your MAGI is under $100k (phasing out to $0 by $150k); unused losses carry forward. On sale, claimed depreciation is recaptured at up to 25%, and gains may owe capital-gains tax (a 1031 exchange can defer both). Figures are a year-1 estimate at your 24.0% rate — not tax advice; consult a CPA.
Schools (NCES district)
- District
- Jefferson County
- NCES district ID
- 0101920
- Math proficiency
- 9% ▼ -24.00%
- Reading proficiency
- 32% ▼ -5.00%
- Median HH income
- $51,712
- Composite
- 18.4/100
- National rank
- #8937
- State rank
- #104 of 129 in AL
Livability — Grayson Valley
- Score
- 65/100
- State rank
- #139
- US rank
- #13418
Category grades
Schools grade is shown separately in the Schools card above.
Census & demographics
- Census place
- Grayson Valley, AL
- County
- Jefferson County · 527,445 people
- Metro
- Birmingham-Hoover, AL
- Population (ZIP)
- 20,526
- Household income
- $63,295
- Rent vs Own
- Severe rent burden
- 941.0
Population outlook (Jefferson County) Hauer SSP2
- Today (2025)
- 669,185 people
- By 2030
- 669,694 · +0.1%
- By 2040
- 661,388 · -1.2%
- By 2050
- 643,086 · -3.9%
- By 2075
- 577,267 · -13.7%
- By 2100
- 474,758 · -29.1%
Race, ethnicity, and origin ACS 2023
- Neighborhood character
- Majority Black (63%)
- Race & ethnicity
- Black 63% White 30% Two or more races 3% Asian 2% Hispanic / Latino 2%
- Common ancestry
- Slovak 2% Serbian 1% Italian 1%
- Foreign-born
- 3% · Canada
- Languages at home
- 96% English-only · Spanish 2% Other Asian/Pacific 1%
Political lean MEDSL · Jefferson
- 2024 margin
- D (+10.4) · D 54.6% · R 44.2% · Other 1.2%
- 2008→2024 swing
- +5.4pp toward D · 2008: 5.1pp · 2024: 10.4pp
- All cycles
- 2024: D+10.4 2020: D+13.2 2016: D+7.2 2012: D+6.0 2008: D+5.1
Not yet ingested
- Civics
- —
Market trends
- HPI YoY
- ▼ -54.62%
- Current HPI
- 204.6532
- Rent YoY
- ▲ 5.39%
- Metro
- Birmingham-Hoover, AL
- State GDP YoY
- ▲ 2.94%
- F500 in state
- 4
Industry mix (Fortune 500 HQ in AL)
| Industry | F500 HQs | Revenue |
|---|---|---|
| Financial Services | 1 | $8B |
|
||
| Healthcare | 1 | $5B |
|
||
Price history
+228.0% since first listed4 events — show timeline
- 2026-04-03 Listed $209,900 Greater Alabama MLS
- 2008-08-15 Sold (Public Records) $74,300 Public Records
- 1989-03-17 Sold (Public Records) $72,000 Public Records
- 1987-05-01 Sold (Public Records) $64,000 Public Records
Property tax history
+4.5%/yrLatest (2025): $994 · +7.1% YoY. Source: county tax records.
Cash-flow waterfall
monthlySold comps — $/sqft
last 12 mo · ≤1 miLoading sold comps…