5925 Pfeil Rd · Schertz, TX
Flood risk No data
- FEMA flood zone
- —
- Chance of flooding over 30 yrs
- —
- Est. flood insurance / yr
- —
Fire risk No data
- Est. fire insurance / yr
- —
Heat risk No data
- Hot days now (above threshold)
- —
- Hot days in 30 yrs
- —
Wind risk No data
- Chance of severe wind over 30 yrs
- —
Air-quality risk No data
- Unhealthy air days now
- —
- Unhealthy air days in 30 yrs
- —
Risk factors via First Street. Map © Google.
Why this score? — see what drove the B- grade
The composite is a weighted blend of 9 inputs, each scored 0–100. Each bar is that input's sub-score; the figure is the points it added to the 100-point composite (weight × sub-score).
- Cash flow +30.0/30.0
- 1% rule +10.0/10.0
- DSCR +10.0/10.0
- ARV discount +7.5/15.0
- Livability +3.7/5.0
- Condition / age +2.5/5.0
- Schools +1.9/10.0
- Rent growth +1.8/5.0
- Appreciation +0.0/10.0
$125,000
🖨 Deal sheet 📄 Offer letter ✓ Due diligence
Listing remarks
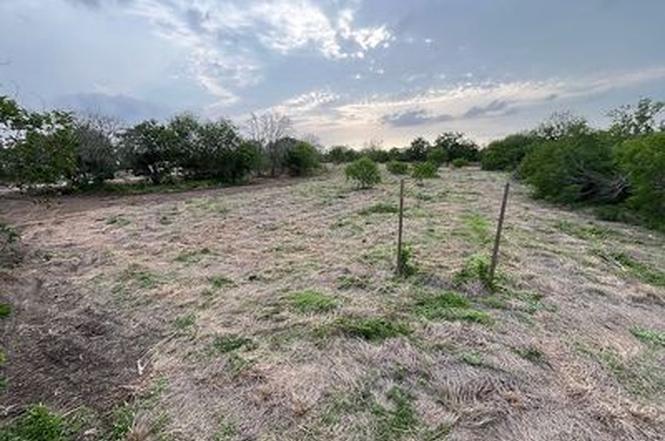
4 - 1 acre lots for sale by owner on Pfeil Rd in the growing area of Schertz, Tx and the I-10 corridor. These lots are less than half a mile from I-10 allowing easy access to San Antonio, Schertz, and Seguin. Each lot measures 100x435 with water and electric utilities at the road. Recent clearing has taken place in preparation for your vision while still leaving enough natural vegetation to provide privacy and that out of the city feel. The best part is there is no HOA. The asking price of $125k is per one acre lot, but I will work with someone if they would like to purchase all four. Feel free to reach out with any question!
Key facts
- 1 acre lots
- Recent clearing
- Natural vegetation
Tags
Property features AI
Exterior
- Home design: Single-family property; Living area approximately 3,592
- Construction: Built in 1994
- Exterior features: Located in the Northeast Side subdivision
Interior
- Interior features: Built in 1994
Neighborhood map
What this means for you Summary
Snapshot
- This is a 3-bed/1.0-bath single-family listed at $125k.
Deal economics
- At list price, monthly cash flow is $789 ($9k/yr) — positive.
- The deal already cash-flows at list — no discount required.
- Meets the 1% rule at list price ($2k rent vs $125k).
- Cap rate 13.9% vs local median 2.8% in Schertz — top-decile yield for the area; either an underpriced asset or a hidden risk that comps aren't pricing in. Stress-test before assuming the spread holds.
Location & tenants
- Location reads 73/100 on livability (#198 in TX) — a middle-class / working-renter tenant base. Strengths: employment A+, housing A+, crime A; Watch: health & safety D+, amenities F, commute F.
- East Central ISD (rural): math 16% / reading 25% proficiency, ranked #758 of 826 in TX (top 92%) — low school quality limits family demand, transient renter base, plan for 1-2y turnover; 61% free/reduced lunch — lower-income household profile, screen leases tightly.
- Market conditions: Rents soft (-2.9%/yr); 495 active listings in the ZIP; 4 comparable units currently listed for rent nearby; rentals at typical pace (median 17d on market — plan ~3-4 weeks tenant-placement turnaround); solid renter incomes; 8,308 units permitted in Bexar County in 2024 (2,506 in 5+ unit buildings).
Forward outlook
- Local home prices are declining (-3.0%/yr); year-one equity from $864 of loan paydown is wiped out by about $4k of value loss. Plan a longer hold.
- Bexar County population projected at +50% by 2050 — long-run rental-demand tailwind backs the buy-and-hold thesis.
- At projected returns (-3.0% appreciation + 0.0% rent growth), your $35k cash investment doubles in ~6 years — after that, you're playing with house money.
Negotiation context
- Only 2 days on market — expect competitive offers; lowballing is unlikely to land.
Questions for the listing agent
- Is there a deadline driving the sale (1031 exchange, divorce, estate, relocation)? That informs how much negotiation room exists.
- What's the average days-on-market for RENTAL listings here right now (not sales)? A rising rental-DOM trend means longer vacancies and softer asking-rent achievability than the comps imply.
- What's the recent tenant-quality profile in this submarket — average credit score on applications, eviction rate, late-payment / NSF rate, and stable-employment percentage? A property-management company in the area should have these aggregated.
- How much new for-sale + rental construction is in the pipeline within 1–3 miles? Heavy new supply typically softens prices + rents 12–24 months out; constrained supply supports both.
Investment metrics
- 1% rule
- 1.67% ✓
- Cap rate
- 13.87%
- Cash-on-cash
- 27.05%
- DSCR
- 2.20
- GRM
- 5.0
CMA / ARV
No comps found within radius.
Projected returns pro-forma
-3.0% appreciation · 0.0% rent growth · sell at horizon
- IRR
- 17.6%
- Equity multiple
- 1.68×
- Total profit
- $23,890
- Equity at exit
- $18,638
- IRR
- 23.8%
- Equity multiple
- 2.77×
- Total profit
- $61,936
- Equity at exit
- $10,808
Cash invested: $35,000 (down + closing). Projections, not guarantees.
Landlord ↔ Tenant lean methodology
- Overall (STATE)
- 87 Strongly Landlord-Friendly
- State Texas
- 87 Strongly Landlord-Friendly · R+5
- County
- — inherits STATE
- City
- — inherits STATE
ZIP-level market 78154
- Home prices YoY
- -17.6%
- Rents YoY
- -2.9%
- Active inventory
- 495
- Price-to-rent
- 5.0×
Monthly cashflow live
- Estimated rent
- $2,092 medium interval (Pro) →
- Mortgage (P&I)
- −$656
- Tax est. 1.5%
- −$156 /mo · $1,875/yr
- Insurance
- −$52
- HOA
- −$0
- Vacancy / Maint / Mgmt
- −$439
- Net cashflow
- $789
Break-even live
UW: 25.0% down · 7.5% · 30yr · 1.5% tax · 5.0% vac · 8.0% maint · 8.0% mgmt
Financing live
Cash to close
- Down payment
- $31,250
- Closing costs
- $3,750
- Reserves months
- —
- Total cash needed
- —
Loan-product check · same deal, 3 products live
Conventional
25% down · 7.5% · 30yr
- Down + closing
- —
- Monthly P&I
- —
- Monthly cashflow
- —
- DSCR
- —
- Eligible?
- —
Personal DTI + credit; lowest rate.
DSCR
20% down · 8.5% · 30yr
- Down + closing
- —
- Monthly P&I
- —
- Monthly cashflow
- —
- DSCR
- —
- Eligible?
- —
No personal income docs; deal must DSCR.
Hard money
10% down · 12.0% · 12mo
- Down + closing
- —
- Monthly P&I
- —
- Monthly cashflow
- —
- DSCR
- —
- Eligible?
- —
Short-term bridge; refi at stabilization.
Rent comps 4 comps
| Address | Beds | Baths | Sqft | Rent | $/sqft | DOM | Units | Dist |
|---|---|---|---|---|---|---|---|---|
| 4550 Meerkat Converse, TX | 4.0 | 2.5 | 2041 | $1,950 | $0.96 | 16d | 1 | 0.99mi |
| 4918 Valenzuela Converse, TX | 3.0–4.0 | 2.0–2.5 | 1719 | $1,699 | $0.99 | 2d | 82 | 1.00mi |
| 6906 Ivy Moon Schertz, TX | 4.0 | 2.5 | 2361 | $2,795 | $1.18 | 44d | 1 | 1.02mi |
| 11038 Airmen Dr Converse, TX | 4.0 | 2.5 | 2096 | $2,250 | $1.07 | 4d | 1 | 1.43mi |
Listing history 3 events
-
2026-06-18days on market $125,000 Active 2 DOM
-
2026-06-16remarks 633-char remark
-
2026-06-16$125,000 Active 1 DOM
ⓘ Source: listings_history table (triggers on properties + properties_extension) + one-shot
backfill from property_details.listing_events for pre-trigger history.
Nearby sold comps map
Loading sold comps map…
Walkable amenities ~0.75 mi
Loading nearby amenities…
Taxation est. · year 1
- Rental income
- $25,105
- − Mortgage interest
- −$7,002
- − Property taxes
- −$1,875
- − Insurance
- −$625
- − Repairs & maintenance
- −$2,008
- − Management
- −$2,008
- − Depreciation
- −$3,636
- Taxable income
- $7,950
- Est. tax owed @ 24.0%
- −$1,908
- After-tax cash flow
- $7,559/yr
For passive investors: Depreciation is non-cash, so a rental often shows a tax loss while cash-flowing — sheltering income. Rental losses are passive: they offset passive income freely, and up to $25,000/yr can offset ordinary (W-2) income if you actively participate and your MAGI is under $100k (phasing out to $0 by $150k); unused losses carry forward. On sale, claimed depreciation is recaptured at up to 25%, and gains may owe capital-gains tax (a 1031 exchange can defer both). Figures are a year-1 estimate at your 24.0% rate — not tax advice; consult a CPA.
Schools (NCES district)
- District
- East Central ISD
- NCES district ID
- 4817850
- Math proficiency
- 16% ▼ -12.00%
- Reading proficiency
- 25% ▼ -6.00%
- Median HH income
- $53,941
- Composite
- 18.67/100
- National rank
- #8887
- State rank
- #758 of 826 in TX
Livability — Schertz
- Score
- 73/100
- State rank
- #198
- US rank
- #5013
Category grades
Schools grade is shown separately in the Schools card above.
Census & demographics
- Census place
- Schertz, TX
- County
- Guadalupe County · 147,291 people
- City population
- 41,907
- Metro
- San Antonio-New Braunfels, TX
- Population (ZIP)
- 41,907
- Household income
- $100,572
- Rent vs Own
- Severe rent burden
- 776.0
Population outlook (Bexar County) Hauer SSP2
- Today (2025)
- 2,336,851 people
- By 2030
- 2,560,728 · +9.6%
- By 2040
- 3,020,569 · +29.3%
- By 2050
- 3,493,522 · +49.5%
- By 2075
- 4,668,459 · +99.8%
- By 2100
- 5,533,242 · +136.8%
Race, ethnicity, and origin ACS 2023
- Neighborhood character
- Diverse neighborhood (Simpson 0.66)
- Race & ethnicity
- White 46% Hispanic / Latino 32% Two or more races 19% Black 15% Asian 2%
- Hispanic origin (detail)
- Mexican 26%
- Common ancestry
- Italian 3% Romanian 3% Lithuanian 2%
- Foreign-born
- 6% · Canada
- Languages at home
- 82% English-only · Spanish 16% German/W. Germanic 1% Other Indo-European 1%
Political lean MEDSL · Bexar
- 2024 margin
- Lean D (+9.8) · D 54.3% · R 44.6% · Other 1.1%
- 2008→2024 swing
- +4.2pp toward D · 2008: 5.6pp · 2024: 9.8pp
- All cycles
- 2024: D+9.8 2020: D+18.2 2016: D+13.5 2012: D+4.6 2008: D+5.6
Not yet ingested
- Civics
- —
Market trends
- HPI YoY
- ▼ -47.53%
- Current HPI
- 222.8314
- Rent YoY
- ▼ -2.86%
- Metro
- San Antonio-New Braunfels, TX
- State GDP YoY
- ▲ 3.95%
- F500 in state
- 110
Industry mix (Fortune 500 HQ in TX)
| Industry | F500 HQs | Revenue |
|---|---|---|
| Energy | 16 | $1,198B |
|
||
| Technology | 5 | $198B |
|
||
| Engineering / Construction | 4 | $72B |
|
||
| Energy Services | 3 | $60B |
|
||
| Utilities | 3 | $41B |
|
||
| Healthcare | 2 | $330B |
|
||
Price history
2 events — show timeline
- 2026-06-16 Listed $125,000 FSBO.com
- 2026-04-17 Sold (Public Records) — Public Records
Property tax history
-2.1%/yrLatest (2025): $7,063 · -19.5% YoY. Source: county tax records.
Cash-flow waterfall
monthlySold comps — $/sqft
last 12 mo · ≤1 miLoading sold comps…