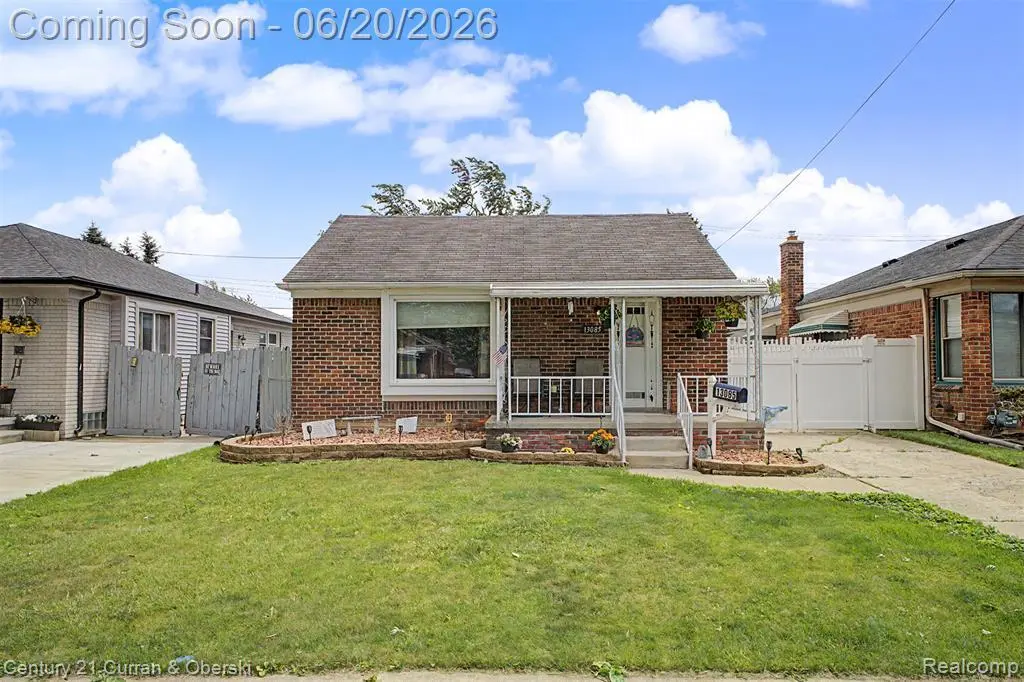
13085 Orchard Rd · Southgate, MI
Flood risk 1/10 · Minimal
- FEMA flood zone
- X (unshaded)
- Chance of flooding over 30 yrs
- 0.0%
- Est. flood insurance / yr
- $473 – $860
Fire risk 1/10 · Minimal
- Est. fire insurance / yr
- $784 – $1,456
Heat risk 3/10 · Minor
- Hot days now (above 96°F)
- 7 days/yr
- Hot days in 30 yrs
- 15 days/yr
Wind risk 2/10 · Minimal
- Chance of severe wind over 30 yrs
- —
Air-quality risk 3/10 · Minor
- Unhealthy air days now
- 3 days/yr
- Unhealthy air days in 30 yrs
- 5 days/yr
Risk factors via First Street. Map © Google.
Why this score? — see what drove the F grade
The composite is a weighted blend of 9 inputs, each scored 0–100. Each bar is that input's sub-score; the figure is the points it added to the 100-point composite (weight × sub-score).
- Cash flow +8.0/30.0
- Livability +4.2/5.0
- Rent growth +3.5/5.0
- Schools +2.5/10.0
- Condition / age +2.5/5.0
- 1% rule +2.4/10.0
- DSCR +2.1/10.0
- ARV discount +0.0/15.0
- Appreciation +0.0/10.0
$215,000
🖨 Deal sheet (PDF) 📄 Offer letter ✓ Due diligence
Listing remarks MLS
Welcome to this charming three bedroom, two bath, brick ranch with a lovely covered porch, fully fenced yard, with vinyl fencing and a 2 1/2 car detached garage. Inside you will find beautiful hardwood floors, throughout the first floor, a large eat-in kitchen, lots of room for storage throughout, and a finished basement, with an added room, with sound proofing, to serve as a wonderful home office. The basement has been professionally waterproofed, with a sump pump, and the furnace was replaced in 2018.
Key facts
- Covered porch
- Large eat-in kitchen
- Finished basement
Tags
Property features AI
Exterior
- Parking: Detached garage with about 2.5 car capacity
- Utilities: Public water; Public sewer
- Home design: Single-family residence; One level; Ground-level entry with steps; Brick exterior
- Construction: Brick construction
- Exterior features: Paved road access; Lot dimensions approximately 40 x 130 (0.12 acre)
Interior
- Bathrooms: 2 full bathrooms
- Heating & cooling: Forced air heating; Natural gas heating; No central cooling
- Interior features: Finished basement with sump pump; Total of 5 rooms
Neighborhood map
What this means for you Summary
Snapshot
- This is a 3-bed/1.0-bath single-family listed at $215k.
Deal economics
- At list price, monthly cash flow is $-216 ($-3k/yr) — negative.
- To cash-flow at today's rent, offer at most $177k (17.7% below list).
- To meet the 1% rule (rent ≥ 1% of price), the offer needs to be $160k (25.7% below list).
- Recommended offer: $160k (25.7% below list) — sets the bar for 1% rule.
Location & tenants
- Location reads 85/100 on livability (#29 in MI, #582 nationally) — a professional / high-income tenant draw. Strengths: amenities A+, commute A+, cost of living A+; Watch: crime D-.
- Southgate Community School District (suburban): math 21% / reading 36% proficiency, ranked #379 of 540 in MI (top 70%) — low school quality limits family demand, transient renter base, plan for 1-2y turnover.
- Zoned schools: Allen Elementary School (math 22% / reading 32%, grade F, #923 of 1,397 statewide, top 69%, 338 students, 59% FRL); Davidson Middle School (math 23% / reading 36%, grade F, #343 of 493 statewide, top 72%, 631 students, 52% FRL); Southgate Anderson High School (math 22% / reading 62%, grade F, #264 of 713 statewide, top 41%, 990 students, 45% FRL).
- Market conditions: Rents rising fast (+4.0%/yr); 117 active listings in the ZIP; 11 comparable units currently listed for rent nearby; rentals leasing fast (median 4d on market — plan ~1-2 weeks tenant-placement turnaround); 2,639 units permitted in Wayne County in 2024 (1,216 in 5+ unit buildings).
Forward outlook
- Local home prices are declining (-3.0%/yr); year-one equity from $1k of loan paydown is wiped out by about $6k of value loss. Plan a longer hold.
- Wayne County population projected at -17% by 2050 — secular population decline; favor cash flow + early exit over multi-decade hold.
Negotiation context
- Only 2 days on market — expect competitive offers; lowballing is unlikely to land.
- 4 sale attempts since 15y ago with the ask held roughly flat each time — persistent listings suggest the price (not the market) is what's stuck; bring a comps-based counter.
- Current owner paid $72k; list at $215k implies a 201% gain — meaningful room to come down on a strong offer.
Risks & watch-outs
- Watch-outs: built in 1953 — expect roof / HVAC / electrical / plumbing capex.
Questions for the listing agent
- What do current leases actually rent for vs. the listed asking? Can we see a recent rent roll and the last 12 months of T-12 income?
- Built in 1953 — when were the roof, HVAC, electrical panel, plumbing, and water heater last replaced?
- Is there a deadline driving the sale (1031 exchange, divorce, estate, relocation)? That informs how much negotiation room exists.
- Schools are D-rated, which usually means shorter tenancies and higher turnover. Who's the typical renter profile here, and what's been the actual vacancy rate?
- Crime grade is D in this area — have there been break-ins, vandalism, or insurance claims at this property in the last 3 years? What carrier currently insures it and at what premium?
- The area grade is low — what's the realistic commute time and amenity access for the typical tenant pool here? Any planned neighborhood developments (good or bad) we should know about?
- What's the average days-on-market for RENTAL listings here right now (not sales)? A rising rental-DOM trend means longer vacancies and softer asking-rent achievability than the comps imply.
- What's the recent tenant-quality profile in this submarket — average credit score on applications, eviction rate, late-payment / NSF rate, and stable-employment percentage? A property-management company in the area should have these aggregated.
- How much new for-sale + rental construction is in the pipeline within 1–3 miles? Heavy new supply typically softens prices + rents 12–24 months out; constrained supply supports both.
Investment metrics
- 1% rule
- 0.74% ✗
- Cap rate
- 5.09%
- Cash-on-cash
- -4.30%
- DSCR
- 0.81
- GRM
- 11.2
CMA / ARV
- ARV (on-the-fly)
- $168,158
- Comps found
- 12
Show comp detail 12 sales within ~0.75 mi
| Address | Dist | Beds/Ba | Sqft | Sold | Price | $/sf | Match |
|---|---|---|---|---|---|---|---|
| 13109 Balsam St | 0.19mi | 3/1.0 | 999 (-1%) | 5mo | $185,000 | $185 | 84 |
| 13181 Peach St | 0.09mi | 4/1.0 (+1) | 979 (-3%) | 5mo | $92,000 | $94 | 81 |
| 3926 21st St | 0.37mi | 3/1.0 | 970 (-4%) | 2mo | $76,000 | $78 | 74 |
| 3327 20th St | 0.50mi | 3/1.0 | 996 (-2%) | 3mo | $165,000 | $166 | 71 |
| 4298 19th St | 0.59mi | 3/1.0 | 1,050 (+4%) | 1mo | $195,000 | $186 | 66 |
| 3577 22nd St | 0.31mi | 3/1.0 | 900 (-11%) | 3mo | $110,000 | $122 | 65 |
| 3585 22nd St | 0.31mi | 3/1.0 | 914 (-10%) | 6mo | $156,000 | $171 | 64 |
| 3838 16th St | 0.60mi | 3/1.0 | 1,040 (+3%) | 4mo | $155,000 | $149 | 64 |
| 3440 20th St | 0.42mi | 2/1.0 (-1) | 945 (-7%) | 1mo | $190,000 | $201 | 64 |
| 13765 Leroy St | 0.49mi | 3/1.0 | 1,072 (+6%) | 5mo | $190,000 | $177 | 63 |
| 4205 17th St | 0.64mi | 3/1.0 | 1,128 (+11%) | 1mo | $175,000 | $155 | 50 |
| 14620 Trenton Rd | 0.70mi | 3/1.0 | 1,100 (+9%) | 6mo | $172,000 | $156 | 48 |
Match score weights: distance 35% · size 25% · config 20% · recency 20%. Top-matched comps best support the ARV.
Projected returns pro-forma
-3.0% appreciation · 4.04% rent growth · sell at horizon
- IRR
- -22.4%
- Equity multiple
- 0.22×
- Total profit
- $-46,875
- Equity at exit
- $32,057
- IRR
- -14.2%
- Equity multiple
- 0.15×
- Total profit
- $-51,356
- Equity at exit
- $18,589
Cash invested: $60,200 (down + closing). Projections, not guarantees.
Landlord ↔ Tenant lean methodology
- Overall (STATE)
- 62 Landlord-Friendly
- State Michigan
- 62 Landlord-Friendly · EVEN
- County
- — inherits STATE
- City
- — inherits STATE
ZIP-level market 48195
- Rents YoY
- 4.0%
- Active inventory
- 117
- Price-to-rent
- 11.2×
Monthly cashflow live
- Estimated rent
- $1,598 high interval (Pro) →
- Mortgage (P&I)
- −$1,127
- Tax from tax record
- −$261 /mo · $3,136/yr
- Insurance
- −$90
- HOA
- −$0
- Vacancy / Maint / Mgmt
- −$336
- Net cashflow
- $-216
Break-even live
Sensitivity live
| Price | -10% $-94 | -5% $-155 | +0% $-216 | +5% $-277 | +10% $-338 |
|---|---|---|---|---|---|
| Rent | -10% $-342 | -5% $-279 | +0% $-216 | +5% $-153 | +10% $-90 |
| Rate | -1.0pp $-108 | -0.5pp $-161 | base $-216 | +0.5pp $-272 | +1.0pp $-328 |
UW: 25.0% down · 7.5% · 30yr · 1.5% tax · 5.0% vac · 8.0% maint · 8.0% mgmt
Financing live
Cash to close
- Down payment
- $53,750
- Closing costs
- $6,450
- Reserves months
- —
- Total cash needed
- —
Loan-product check · same deal, 3 products live
Conventional
25% down · 7.5% · 30yr
- Down + closing
- —
- Monthly P&I
- —
- Monthly cashflow
- —
- DSCR
- —
- Eligible?
- —
Personal DTI + credit; lowest rate.
DSCR
20% down · 8.5% · 30yr
- Down + closing
- —
- Monthly P&I
- —
- Monthly cashflow
- —
- DSCR
- —
- Eligible?
- —
No personal income docs; deal must DSCR.
Hard money
10% down · 12.0% · 12mo
- Down + closing
- —
- Monthly P&I
- —
- Monthly cashflow
- —
- DSCR
- —
- Eligible?
- —
Short-term bridge; refi at stabilization.
Rent comps 11 comps
| Address | Beds | Baths | Sqft | Rent | $/sqft | DOM | Units | Dist |
|---|---|---|---|---|---|---|---|---|
| 13185 Sycamore St Southgate, MI | 3.0 | 1.0 | 1080 | $1,700 | $1.57 | 26d | 1 | 0.36mi |
| 3851 17th St Wyandotte, MI | 2.0 | 1.0 | 764 | $1,200 | $1.57 | 4d | 1 | 0.56mi |
| 13861 Strathcona St Southgate, MI | 1.0–2.0 | 1.0–1.5 | 797 | $1,140 | $1.43 | 0d | 5 | 0.56mi |
| 1569 Sycamore St Wyandotte, MI | 3.0 | 1.0 | 944 | $1,695 | $1.80 | 45d | 1 | 0.67mi |
| 1024 Adelaide St Wyandotte, MI | 2.0 | 1.0 | 800 | $3,100 | $3.88 | 0d | 1 | 0.94mi |
| 17400 Fort St Riverview, MI | 1.0–2.0 | 1.0 | 800 | $1,225 | $1.53 | 0d | 11 | 1.00mi |
| 13020 Pullman St Southgate, MI | 4.0 | 1.0 | 1050 | $1,550 | $1.48 | 4d | 1 | 1.20mi |
| 667 Pine St Unit 2 Wyandotte, MI | 2.0 | 1.0 | 800 | $1,400 | $1.75 | 3d | 1 | 1.24mi |
| 667 Pine St Unit 1 Wyandotte, MI | 3.0 | 1.0 | 1000 | $1,500 | $1.50 | 0d | 1 | 1.24mi |
| 2700 6th St Wyandotte, MI | 1.0–2.0 | 1.0 | 900 | $1,095 | $1.22 | 45d | 2 | 1.44mi |
| 15027 Brookview Dr Riverview, MI | 1.0–2.0 | 1.0 | 1020 | $1,499 | $1.47 | 0d | 34 | 1.46mi |
Listing history 2 events
-
2026-06-21remarks 508-char remark
-
2026-06-21$215,000 Active 2 DOM
ⓘ Source: listings_history table (triggers on properties + properties_extension) + one-shot
backfill from property_details.listing_events for pre-trigger history.
Tax reassessment forecast MI · Partial reset (capped growth)
- Current annual tax
- $3,136 · $261/mo
- Projected year-2 tax
- $3,223 · $269/mo
- Expected delta
- +$88/yr (+$7/mo · 2.8%)
ⓘ Screening estimate from a state-policy table — verify with the county assessor before closing.
Climate risk First Street
- Flood 1/10 Low FEMA zone X (unshaded) · 0% chance over 30 yrs
- Wildfire 1/10 Low
- Heat 3/10 Moderate 7 d/yr ≥96°F today · 15 d/yr by 30 yrs out
- Wind 2/10 Low
- Air quality 3/10 Moderate 3 unhealthy d/yr today · 5 by 30 yrs out
Nearby sold comps map
Loading sold comps map…
Walkable amenities ~0.75 mi
Loading nearby amenities…
Taxation est. · year 1
- Rental income
- $19,178
- − Mortgage interest
- −$12,043
- − Property taxes
- −$3,136
- − Insurance
- −$1,075
- − Repairs & maintenance
- −$1,534
- − Management
- −$1,534
- − Depreciation
- −$6,255
- Taxable loss
- −$6,399
- Est. tax savings @ 24.0%
- +$1,536
- After-tax cash flow
- $-1,054/yr
For passive investors: Depreciation is non-cash, so a rental often shows a tax loss while cash-flowing — sheltering income. Rental losses are passive: they offset passive income freely, and up to $25,000/yr can offset ordinary (W-2) income if you actively participate and your MAGI is under $100k (phasing out to $0 by $150k); unused losses carry forward. On sale, claimed depreciation is recaptured at up to 25%, and gains may owe capital-gains tax (a 1031 exchange can defer both). Figures are a year-1 estimate at your 24.0% rate — not tax advice; consult a CPA.
Schools (NCES district)
- District
- Southgate Community School District
- NCES district ID
- 2632340
- Math proficiency
- 21% ▼ -8.00%
- Reading proficiency
- 36% ▬ 0.00%
- Median HH income
- $49,234
- Composite
- 24.83/100
- National rank
- #7591
- State rank
- #379 of 540 in MI
Livability — Southgate
- Score
- 85/100
- State rank
- #29
- US rank
- #582
Category grades
Schools grade is shown separately in the Schools card above.
Census & demographics
- Census place
- Southgate, MI
- County
- Wayne County · 1,562,939 people
- City population
- 29,366
- Metro
- Detroit-Warren-Dearborn, MI
- Population (ZIP)
- 29,366
- Household income
- $66,118
- Rent vs Own
- Severe rent burden
- 727.0
Population outlook (Wayne County) Hauer SSP2
- Today (2025)
- 1,675,273 people
- By 2030
- 1,620,300 · -3.3%
- By 2040
- 1,502,341 · -10.3%
- By 2050
- 1,384,039 · -17.4%
- By 2075
- 1,124,592 · -32.9%
- By 2100
- 881,193 · -47.4%
Race, ethnicity, and origin ACS 2023
- Neighborhood character
- Predominantly White (75%)
- Race & ethnicity
- White 75% Hispanic / Latino 11% Black 8% Two or more races 8% Asian 3%
- Hispanic origin (detail)
- Mexican 8% Puerto Rican 1%
- Common ancestry
- Romanian 9% Lithuanian 3% Slovak 3%
- Foreign-born
- 6% · Canada, China
- Languages at home
- 90% English-only · Other Indo-European 4% Spanish 3% Other Asian/Pacific 1%
Political lean MEDSL · Wayne
- 2024 margin
- Strong D (+29.0) · D 62.7% · R 33.7% · Other 3.6%
- 2008→2024 swing
- -20.5pp toward R · 2008: 49.5pp · 2024: 29.0pp
- All cycles
- 2024: D+29.0 2020: D+38.1 2016: D+37.3 2012: D+46.9 2008: D+49.5
Not yet ingested
- Civics
- —
Market trends
- HPI YoY
- ▼ -187.28%
- Current HPI
- 207.9776
- Rent YoY
- ▲ 4.04%
- Metro
- Detroit-Warren-Dearborn, MI
- State GDP YoY
- ▲ 1.37%
- F500 in state
- 28
Industry mix (Fortune 500 HQ in MI)
| Industry | F500 HQs | Revenue |
|---|---|---|
| Automotive Parts | 3 | $48B |
|
||
| Automotive | 2 | $372B |
|
||
| Chemicals | 1 | $45B |
|
||
| Automotive Retail | 1 | $29B |
|
||
| Healthcare / Medical Devices | 1 | $23B |
|
||
| Automotive Technology | 1 | $20B |
|
||
Price history
+169.1% since first listed9 events — show timeline
- 2026-06-20 Listed $215,000 MiRealSource-MiMLS
- 2026-06-20 Listed $215,000 REALCOMP
- 2026-06-19 Coming Soon $215,000 MiRealSource-MiMLS
- 2011-10-13 Sold (Public Records) $71,500 Public Records
- 2011-10-05 Sold (MLS) $71,500 MiRealSource-MiMLS
- 2011-10-05 Sold (MLS) $71,500 REALCOMP
- 2011-09-29 Listing Removed — MiRealSource-MiMLS
- 2011-08-01 Listed $79,900 MiRealSource-MiMLS
- 2011-08-01 Listed $79,900 REALCOMP
Property tax history
+4.7%/yrLatest (2025): $3,136 · +19.0% YoY. Source: county tax records.
Cash-flow waterfall
monthlySold comps — $/sqft
last 12 mo · ≤1 miLoading sold comps…