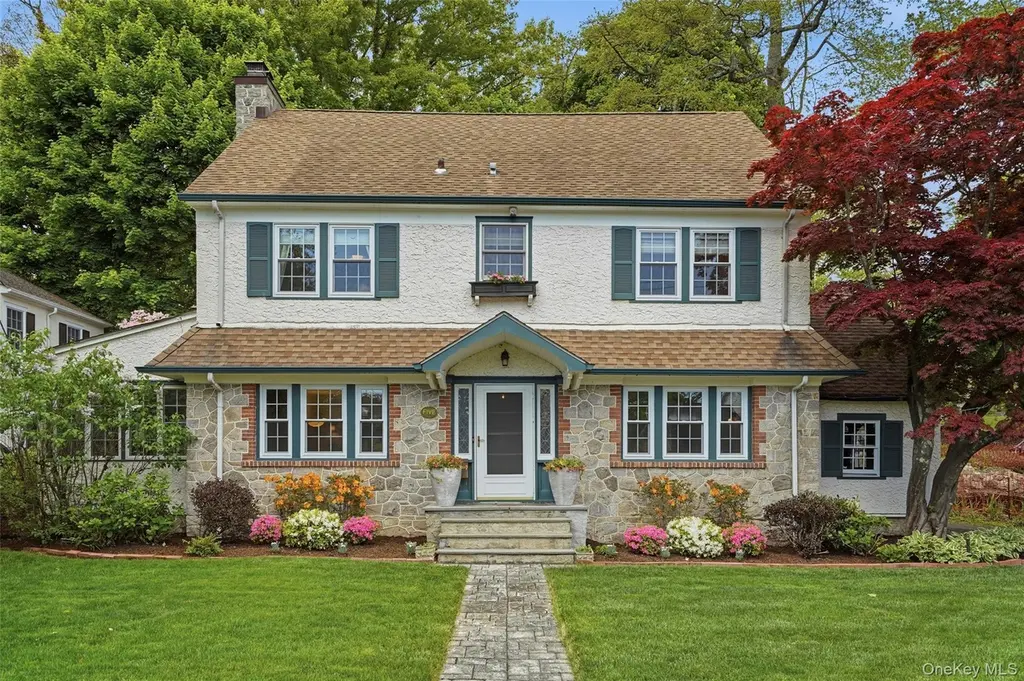
5 Allendale Dr · Rye, NY
Flood risk 1/10 · Minimal
- FEMA flood zone
- X (unshaded)
- Chance of flooding over 30 yrs
- 0.0%
- Est. flood insurance / yr
- $507 – $1,088
Fire risk 2/10 · Minimal
- Est. fire insurance / yr
- $691 – $1,283
Heat risk 6/10 · Moderate
- Hot days now (above 98°F)
- 7 days/yr
- Hot days in 30 yrs
- 16 days/yr
Wind risk 6/10 · Moderate
- Chance of severe wind over 30 yrs
- 27.0%
Air-quality risk 4/10 · Minor
- Unhealthy air days now
- 5 days/yr
- Unhealthy air days in 30 yrs
- 7 days/yr
Risk factors via First Street. Map © Google.
Why this score? — see what drove the D grade
The composite is a weighted blend of 9 inputs, each scored 0–100. Each bar is that input's sub-score; the figure is the points it added to the 100-point composite (weight × sub-score).
- ARV discount +14.2/15.0
- Schools +8.6/10.0
- Appreciation +8.3/10.0
- Livability +3.5/5.0
- Rent growth +2.5/5.0
- Condition / age +2.5/5.0
- Cash flow +2.2/30.0
- 1% rule +0.0/10.0
- DSCR +0.0/10.0
$1,895,000
🖨 Deal sheet 📄 Offer letter ✓ Due diligence
Listing remarks
Timeless charm and modern updates come together beautifully in this sun-drenched 1920’s Colonial located in the heart of Rye. Rich in character with original moldings, exposed architectural details, and hardwood floors throughout, this inviting home offers exceptional living space, abundant natural light, and a seamless layout for today’s lifestyle. The modern eat-in kitchen features peninsula seating, stainless steel appliances, custom cabinetry, and opens directly to the adjacent family room, creating the perfect setting for everyday living and entertaining. The expansive living room and dining room are centered around a stunning stone fireplace, the focal point of the home, w
Key facts
- 6,970 sq ft lot
- Garage
- Built 1927
Property features AI
Exterior
- Parking: Garage; 1-car garage
- Utilities: Con Edison electric service; Natural gas connected; Public sewer; Water connected; Electricity connected; Sewer connected
- Home design: Single family residence
- Construction: Stucco construction
- Exterior features: Stucco exterior; Not waterfront
Interior
- Kitchen: Dishwasher; Gas cooktop; Gas oven; Microwave; Refrigerator
- Bedrooms: Includes walk-in closet(s)
- Flooring: Hardwood
- Bathrooms: 2 full bathrooms; 1 half bathroom
- Heating & cooling: Oil heating; Wall/window air conditioning units
- Interior features: Breakfast bar; Chef's kitchen; Eat-in kitchen; Entrance foyer; Open kitchen; Primary bathroom; Quartz/Quartzite counters; Walk-in closet(s); Full walkup attic; Unfinished basement with storage space
- Laundry & utility: Washer; Dryer; Laundry in basement
Neighborhood map
What this means for you Summary
Snapshot
- This is a 3-bed/2.5-bath single-family listed at $1.90M.
Deal economics
- At list price, monthly cash flow is $-7k ($-82k/yr) — negative.
- To cash-flow at today's rent, offer at most $694k (63.4% below list).
- To meet the 1% rule (rent ≥ 1% of price), the offer needs to be $711k (62.5% below list).
- Recommended offer: $694k (63.4% below list) — sets the bar for cash-flow.
- Cap rate 2.0% vs local median 1.5% in Rye — meaningfully above typical; check what's discounted (condition, days-on-market, listing class) to confirm the premium yield is real.
Location & tenants
- Location reads 70/100 on livability (#431 in NY) — a middle-class / working-renter tenant base. Strengths: crime A+, employment A+; Watch: amenities F, cost of living F, health & safety F.
- Rye City School District (suburban): math 89% / reading 93% proficiency, ranked #4 of 590 in NY (top 1%) — strong family-tenant draw, lease renewals of 3-5y typical; only 2% free/reduced lunch — higher-income household profile.
- Zoned schools: Osborn School (math 82% / reading 92%, grade A+, #69 of 2,108 statewide, top 4%, 455 students, 0% FRL); Rye Middle School (math 77% / reading 92%, grade A+, #13 of 729 statewide, top 2%, 685 students, 0% FRL); Rye High School (math 100% / reading 87%, grade A+, #141 of 1,100 statewide, top 13%, 903 students, 0% FRL) — zoned schools at 0% FRL track the district average.
- Market conditions: 121 active listings in the ZIP; 21 comparable units currently listed for rent nearby; rentals leasing fast (median 7d on market — plan ~1-2 weeks tenant-placement turnaround); high-income renter base; 954 units permitted in Westchester County in 2024 (649 in 5+ unit buildings).
- This rent runs 34% of the median local income ($250k/yr) — at the standard rent-burdened threshold; future hikes will face affordability resistance.
Forward outlook
- In year one you build about $139k of equity ($13k loan paydown + $126k appreciation (6.6% local appreciation)).
- Westchester County population projected at +10% by 2050 — modest demand growth; plan on rents tracking national, not racing it.
- By year 2, paydown + projected appreciation supports a ~$222k cash-out refi (75% LTV) — recoverable capital for the next deal without selling this one.
Negotiation context
- Only 14 days on market — expect competitive offers; lowballing is unlikely to land.
- Current owner paid $310k; list at $1.90M implies a 511% gain — meaningful room to come down on a strong offer.
Risks & watch-outs
- Watch-outs: built in 1927 — expect roof / HVAC / electrical / plumbing capex.
- Climate carrying-cost: major wind risk, 27% chance of damaging wind over 30y; extreme-heat days projected 7→16/yr by 2055 (HVAC capex compounding) — expect insurance premiums to compound above CPI over the hold.
Questions for the listing agent
- What do current leases actually rent for vs. the listed asking? Can we see a recent rent roll and the last 12 months of T-12 income?
- Built in 1927 — when were the roof, HVAC, electrical panel, plumbing, and water heater last replaced?
- Is there a deadline driving the sale (1031 exchange, divorce, estate, relocation)? That informs how much negotiation room exists.
- Schools are A-rated — typically a magnet for longer-tenancy family renters. What's the average tenant stay here, and is there a school-zone premium baked into asking?
- The area grade is low — what's the realistic commute time and amenity access for the typical tenant pool here? Any planned neighborhood developments (good or bad) we should know about?
- What's the average days-on-market for RENTAL listings here right now (not sales)? A rising rental-DOM trend means longer vacancies and softer asking-rent achievability than the comps imply.
- What's the recent tenant-quality profile in this submarket — average credit score on applications, eviction rate, late-payment / NSF rate, and stable-employment percentage? A property-management company in the area should have these aggregated.
- How much new for-sale + rental construction is in the pipeline within 1–3 miles? Heavy new supply typically softens prices + rents 12–24 months out; constrained supply supports both.
Investment metrics
- 1% rule
- 0.37% ✗
- Cap rate
- 1.99%
- Cash-on-cash
- -15.37%
- DSCR
- 0.32
- GRM
- 22.2
CMA / ARV
- ARV (median comp)
- $2,225,202
- List price
- $1,895,000
- Delta
- -14.84%
- Verdict
- UNDERPRICED
- Comps
- 20 within 1.0 mi
Show comp detail 10 sales within ~0.75 mi
| Address | Dist | Beds/Ba | Sqft | Sold | Price | $/sf | Match |
|---|---|---|---|---|---|---|---|
| 306 Oakland Beach Ave | 0.54mi | 3/2.5 | 2,160 (-1%) | 10mo | $1,214,000 | $562 | 64 |
| 7 Drake Ave | 0.30mi | 4/3.5 (+1) | 2,305 (+5%) | 10mo | $1,737,500 | $754 | 60 |
| 60 Franklin Ave | 0.35mi | 4/3.5 (+1) | 2,280 (+4%) | 14mo | $1,725,000 | $757 | 56 |
| 5 White Birch Dr | 0.26mi | 4/3.0 (+1) | 2,394 (+10%) | 13mo | $2,500,000 | $1,044 | 54 |
| 3 Ormond Pl | 0.64mi | 3/2.0 | 2,268 (+4%) | 13mo | $2,075,000 | $915 | 51 |
| 473 Park Ave | 0.36mi | 4/3.0 (+1) | 2,389 (+9%) | 12mo | $2,060,000 | $862 | 51 |
| 56 Hughes Ave | 0.39mi | 4/2.5 (+1) | 1,915 (-12%) | 11mo | $2,027,000 | $1,058 | 47 |
| 22 Brookdale Pl | 0.68mi | 4/2.5 (+1) | 1,902 (-13%) | 1mo | $1,800,000 | $946 | 41 |
| 59 Franklin Ave | 0.33mi | 4/3.0 (+1) | 1,917 (-12%) | 24mo | $1,586,000 | $827 | 38 |
| 11 Hayward Pl | 0.66mi | 4/3.0 (+1) | 2,503 (+14%) | 24mo | $1,830,000 | $731 | 18 |
Match score weights: distance 35% · size 25% · config 20% · recency 20%. Top-matched comps best support the ARV.
Projected returns pro-forma
6.64% appreciation · 3.0% rent growth · sell at horizon
- IRR
- 5.0%
- Equity multiple
- 1.35×
- Total profit
- $186,975
- Equity at exit
- $1,269,090
- IRR
- 7.4%
- Equity multiple
- 2.64×
- Total profit
- $871,953
- Equity at exit
- $2,371,790
Cash invested: $530,600 (down + closing). Projections, not guarantees.
Landlord ↔ Tenant lean methodology
- Overall (STATE)
- 15 Strongly Tenant-Friendly
- State New York
- 15 Strongly Tenant-Friendly · D+10
- County
- — inherits STATE
- City
- — inherits STATE
ZIP-level market 10580
- Home prices YoY
- 2.1%
- Active inventory
- 121
- Price-to-rent
- 22.2×
Monthly cashflow live
- Estimated rent
- $7,106 high interval (Pro) →
- Mortgage (P&I)
- −$9,938
- Tax from tax record
- −$1,685 /mo · $20,220/yr
- Insurance
- −$790
- HOA
- −$0
- Vacancy / Maint / Mgmt
- −$1,492
- Net cashflow
- $-6,798
Break-even live
UW: 25.0% down · 7.5% · 30yr · 1.5% tax · 5.0% vac · 8.0% maint · 8.0% mgmt
Financing live
Cash to close
- Down payment
- $473,750
- Closing costs
- $56,850
- Reserves months
- —
- Total cash needed
- —
Loan-product check · same deal, 3 products live
Conventional
25% down · 7.5% · 30yr
- Down + closing
- —
- Monthly P&I
- —
- Monthly cashflow
- —
- DSCR
- —
- Eligible?
- —
Personal DTI + credit; lowest rate.
DSCR
20% down · 8.5% · 30yr
- Down + closing
- —
- Monthly P&I
- —
- Monthly cashflow
- —
- DSCR
- —
- Eligible?
- —
No personal income docs; deal must DSCR.
Hard money
10% down · 12.0% · 12mo
- Down + closing
- —
- Monthly P&I
- —
- Monthly cashflow
- —
- DSCR
- —
- Eligible?
- —
Short-term bridge; refi at stabilization.
Rent comps 21 comps
| Address | Beds | Baths | Sqft | Rent | $/sqft | DOM | Units | Dist |
|---|---|---|---|---|---|---|---|---|
| 9 Fenton St Rye, NY | 3.0 | 2.0 | 1428 | $8,800 | $6.16 | 17d | 1 | 0.63mi |
| 332 Halstead Ave Harrison, NY | 1.0–3.0 | 1.0–3.0 | 1116 | $6,805 | $6.09 | 1d | 1 | 0.75mi |
| 9 Marlene Ct Rye, NY | 4.0 | 3.0 | 1750 | $10,500 | $6.00 | 7d | 1 | 0.81mi |
| 8 Davenport St Harrison, NY | 3.0 | 2.0 | 1700 | $5,000 | $2.94 | 3d | 1 | 0.82mi |
| 69 Oak St Unit B Harrison, NY | 3.0 | 3.5 | 2100 | $7,000 | $3.33 | 1d | 1 | 0.97mi |
| 52 Nelson Ave Unit 2 Harrison, NY | 3.0 | 1.5 | 1450 | $4,000 | $2.76 | 19d | 1 | 1.07mi |
| 317 Hornidge Rd Mamaroneck, NY | 4.0 | 2.0 | 1600 | $5,500 | $3.44 | 17d | 1 | 1.09mi |
| 124 Maple Ave Rye, NY | 3.0 | 2.5 | 2615 | $9,000 | $3.44 | 3d | 1 | 1.09mi |
| 8 Marion Ave #6 Harrison, NY | 3.0 | 2.5 | 1420 | $6,400 | $4.51 | 4d | 1 | 1.11mi |
| 94 Thatcher Ave Harrison, NY | 4.0 | 3.5 | 2600 | $8,250 | $3.17 | 1d | 1 | 1.17mi |
| 69 Ellsworth Ave Harrison, NY | 3.0 | 2.5 | 2000 | $6,500 | $3.25 | 43d | 1 | 1.17mi |
| 150 Theodore Fremd Ave Rye, NY | 2.0–4.0 | 1.0–2.5 | 1320 | $4,595 | $3.48 | 1d | 1 | 1.26mi |
| 14 Fremont St Unit 1 Harrison, NY | 3.0 | 2.0 | 1500 | $4,300 | $2.87 | 7d | 1 | 1.26mi |
| 135 Webster Ave Harrison, NY | 3.0 | 1.0 | 1500 | $3,300 | $2.20 | 19d | 1 | 1.29mi |
| 228 Central Ave Rye, NY | 4.0 | 3.5 | 2466 | $10,000 | $4.06 | 1d | 1 | 1.29mi |
| 228 Central Ave Rye, NY | 4.0 | 3.5 | 2466 | $11,000 | $4.46 | 10d | 1 | 1.29mi |
| 1408 Henry Ave #2 Mamaroneck, NY | 3.0 | 1.5 | 1400 | $4,200 | $3.00 | 43d | 1 | 1.33mi |
| 140 Rockwell St Unit A Harrison, NY | 3.0 | 2.5 | 1850 | $7,000 | $3.78 | 4d | 1 | 1.34mi |
| 87 Crystal St Harrison, NY | 3.0 | 2.5 | 1700 | $8,250 | $4.85 | 19d | 1 | 1.36mi |
| 89 Crystal St Harrison, NY | 3.0 | 2.5 | 1700 | $8,250 | $4.85 | 19d | 1 | 1.36mi |
| 1035 Shore Acres Dr Mamaroneck, NY | 4.0 | 3.0 | 1988 | $9,900 | $4.98 | 1d | 1 | 1.42mi |
Listing history 4 events
-
2026-06-04statusdays on market $1,895,000 Pending 14 DOM
-
2026-05-14$1,895,000 Active 1487-char remark
-
2026-05-11historical $1,895,000 1487-char remark
-
1993-10-12soldstatus $310,000
ⓘ Source: listings_history table (triggers on properties + properties_extension) + one-shot
backfill from property_details.listing_events for pre-trigger history.
Tax reassessment forecast NY · Partial reset (capped growth)
- Current annual tax
- $20,220 · $1,685/mo
- Projected year-2 tax
- $26,123 · $2,177/mo
- Expected delta
- +$5,903/yr (+$492/mo · 29.2%)
ⓘ Screening estimate from a state-policy table — verify with the county assessor before closing.
Climate risk First Street
- Flood 1/10 Low FEMA zone X (unshaded) · 0% chance over 30 yrs
- Wildfire 2/10 Low
- Heat 6/10 Major 7 d/yr ≥98°F today · 16 d/yr by 30 yrs out
- Wind 6/10 Major 27% chance of damaging wind over 30 yrs
- Air quality 4/10 Moderate 5 unhealthy d/yr today · 7 by 30 yrs out
Nearby sold comps map
Loading sold comps map…
Walkable amenities ~0.75 mi
Loading nearby amenities…
Taxation est. · year 1
- Rental income
- $85,274
- − Mortgage interest
- −$106,149
- − Property taxes
- −$20,220
- − Insurance
- −$9,475
- − Repairs & maintenance
- −$6,822
- − Management
- −$6,822
- − Depreciation
- −$55,127
- Taxable loss
- −$119,342
- Est. tax savings @ 24.0%
- +$28,642
- After-tax cash flow
- $-52,938/yr
For passive investors: Depreciation is non-cash, so a rental often shows a tax loss while cash-flowing — sheltering income. Rental losses are passive: they offset passive income freely, and up to $25,000/yr can offset ordinary (W-2) income if you actively participate and your MAGI is under $100k (phasing out to $0 by $150k); unused losses carry forward. On sale, claimed depreciation is recaptured at up to 25%, and gains may owe capital-gains tax (a 1031 exchange can defer both). Figures are a year-1 estimate at your 24.0% rate — not tax advice; consult a CPA.
Schools (NCES district)
- District
- Rye City School District
- NCES district ID
- 3625260
- Math proficiency
- 89% ▲ 11.00%
- Reading proficiency
- 93% ▲ 12.00%
- Median HH income
- $144,848
- Composite
- 85.84/100
- National rank
- #6
- State rank
- #4 of 590 in NY
Livability — Rye
- Score
- 70/100
- State rank
- #431
- US rank
- #7470
Category grades
Schools grade is shown separately in the Schools card above.
Census & demographics
- Census place
- Rye, NY
- County
- Westchester County · 709,332 people
- City population
- 18,391
- Metro
- New York-Newark-Jersey City, NY-NJ-PA
- Population (ZIP)
- 18,391
- Household income
- $250,001
- Rent vs Own
- Severe rent burden
- 580.0
Population outlook (Westchester County) Hauer SSP2
- Today (2025)
- 1,028,035 people
- By 2030
- 1,051,636 · +2.3%
- By 2040
- 1,098,520 · +6.9%
- By 2050
- 1,136,044 · +10.5%
- By 2075
- 1,196,925 · +16.4%
- By 2100
- 1,175,147 · +14.3%
Race, ethnicity, and origin ACS 2023
- Neighborhood character
- Predominantly White (77%)
- Race & ethnicity
- White 77% Two or more races 10% Asian 7% Hispanic / Latino 7% Black 2%
- Hispanic origin (detail)
- Puerto Rican 1%
- Common ancestry
- Romanian 5% Italian 3% German 3%
- Foreign-born
- 20% · Canada, China, South Korea
- Languages at home
- 80% English-only · Spanish 6% Other Indo-European 3% Chinese 2%
Political lean MEDSL · Westchester
- 2024 margin
- Strong D (+26.3) · D 63.1% · R 36.9%
- 2008→2024 swing
- -1.3pp toward R · 2008: 27.6pp · 2024: 26.3pp
- All cycles
- 2024: D+26.3 2020: D+36.3 2016: D+32.8 2012: D+22.2 2008: D+27.6
Not yet ingested
- Civics
- —
Market trends
- HPI YoY
- ▲ 6.64%
- Current HPI
- 321.5777
- Rent YoY
- —
- Metro
- New York-Newark-Jersey City, NY-NJ-PA
- State GDP YoY
- ▲ 2.60%
- F500 in state
- 92
Industry mix (Fortune 500 HQ in NY)
| Industry | F500 HQs | Revenue |
|---|---|---|
| Financial Services | 10 | $950B |
|
||
| Consumer Goods | 9 | $162B |
|
||
| Insurance | 4 | $225B |
|
||
| Telecommunications | 2 | $144B |
|
||
| Pharmaceuticals | 2 | $112B |
|
||
| Media / Entertainment | 2 | $69B |
|
||
Price history
+511.3% since first listed4 events — show timeline
- 2026-06-03 Pending — OneKey® MLS as Distributed by MLS Grid
- 2026-05-14 Listed $1,895,000 OneKey® MLS as Distributed by MLS Grid
- 2026-05-11 Coming Soon $1,895,000 OneKey® MLS as Distributed by MLS Grid
- 1993-10-12 Sold (Public Records) $310,000 Public Records
Property tax history
+18.0%/yrLatest (2025): $20,220 · +3.5% YoY. Source: county tax records.
Cash-flow waterfall
monthlySold comps — $/sqft
last 12 mo · ≤1 miLoading sold comps…