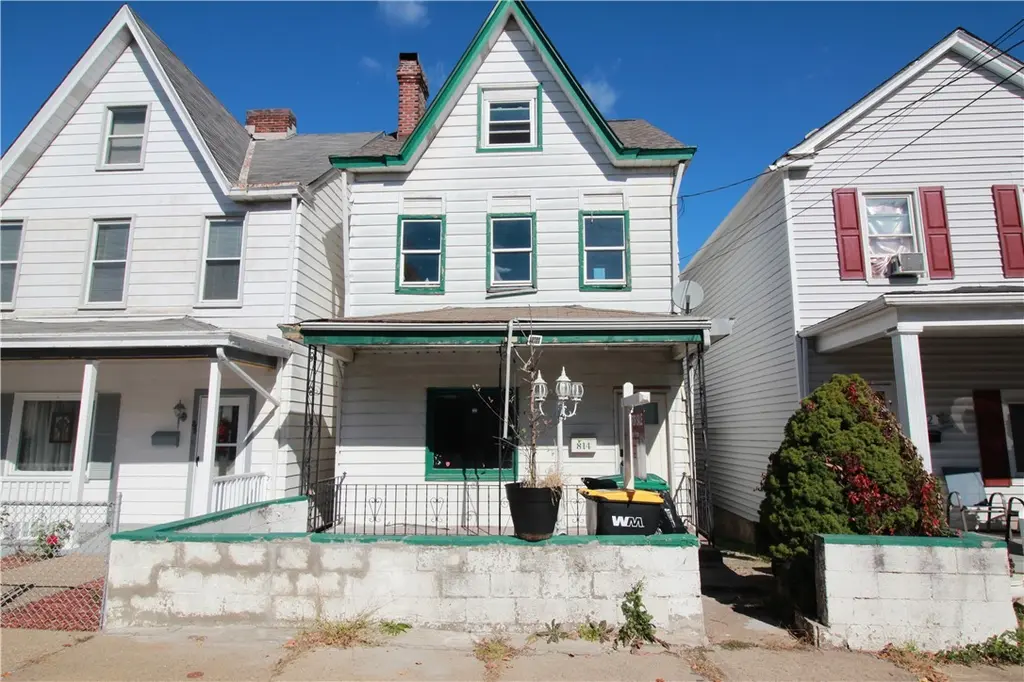
814 Etna St · McKees Rocks, PA
Flood risk 1/10 · Minimal
- FEMA flood zone
- X (unshaded)
- Chance of flooding over 30 yrs
- 0.0%
- Est. flood insurance / yr
- $473 – $860
Fire risk 1/10 · Minimal
- Est. fire insurance / yr
- $511 – $949
Heat risk 4/10 · Minor
- Hot days now (above 98°F)
- 7 days/yr
- Hot days in 30 yrs
- 17 days/yr
Wind risk 2/10 · Minimal
- Chance of severe wind over 30 yrs
- —
Air-quality risk 3/10 · Minor
- Unhealthy air days now
- 3 days/yr
- Unhealthy air days in 30 yrs
- 3 days/yr
Risk factors via First Street. Map © Google.
Why this score? — see what drove the B- grade
The composite is a weighted blend of 9 inputs, each scored 0–100. Each bar is that input's sub-score; the figure is the points it added to the 100-point composite (weight × sub-score).
- Cash flow +30.0/30.0
- 1% rule +10.0/10.0
- DSCR +10.0/10.0
- ARV discount +5.9/15.0
- Rent growth +5.0/5.0
- Livability +4.1/5.0
- Condition / age +2.5/5.0
- Schools +0.9/10.0
- Appreciation +0.0/10.0
$73,000
🖨 Deal sheet 📄 Offer letter ✓ Due diligence
Listing remarks MLS
Make this 3 bedroom 3 bath home your next rental investment property! This house has 1,542 sq ft of living space in a nice quiet neighborhood! It has a large covered porch in the front and another one in the back to sit outside and enjoy the weather. Backyard has plenty of yard space to cookout or for fun activities. Housing Authority City of Pittsburgh Voucher Plan for Tier 6 in 2026 has for 3-Bedroom: $2029.50. Please refer to hacp.org for details. Great location -minutes to grocery shopping, banking, Downtown Pittsburgh and Airport!
Key facts
- Large covered porch
- Backyard yard space
- Great location
Tags
Neighborhood map
What this means for you Summary
Snapshot
- This is a 3-bed/1.0-bath single-family listed at $73k.
Deal economics
- At list price, monthly cash flow is $604 ($7k/yr) — positive.
- The deal already cash-flows at list — no discount required.
- Meets the 1% rule at list price ($1k rent vs $73k).
- Recommended offer: $69k (6.0% below list) — sets the bar for market timing.
- Cap rate 16.2% vs local median 11.7% in McKees Rocks — top-decile yield for the area; either an underpriced asset or a hidden risk that comps aren't pricing in. Stress-test before assuming the spread holds.
Location & tenants
- Location reads 82/100 on livability (#143 in PA, #1,154 nationally) — a professional / high-income tenant draw. Strengths: amenities A+, commute A+, cost of living A+; Watch: schools F, employment F.
- Sto-Rox SD (suburban): math 4% / reading 18% proficiency, ranked #532 of 539 in PA (top 99%) — low school quality limits family demand, transient renter base, plan for 1-2y turnover; 77% free/reduced lunch — lower-income household profile, screen leases tightly.
- Market conditions: Rents rising fast (+13.1%/yr); 125 active listings in the ZIP; 18 comparable units currently listed for rent nearby; rentals at typical pace (median 24d on market — plan ~3-4 weeks tenant-placement turnaround); 2,996 units permitted in Allegheny County in 2024 (1,588 in 5+ unit buildings).
Forward outlook
- Local home prices are declining (-3.0%/yr); year-one equity from $505 of loan paydown is wiped out by about $2k of value loss. Plan a longer hold.
- At projected returns (-3.0% appreciation + 8.0% rent growth), your $20k cash investment doubles in ~4 years — after that, you're playing with house money.
Negotiation context
- It's been on market 65 days — a 6% lower offer ($69k) is reasonable based on typical stale-listing flexibility.
- 3 sale attempts since 32y ago with the ask held roughly flat each time — persistent listings suggest the price (not the market) is what's stuck; bring a comps-based counter.
- Current owner paid $10k; list at $73k implies a 630% gain — meaningful room to come down on a strong offer.
Risks & watch-outs
- Watch-outs: property tax is 2.5% of price; built in 1910 — expect roof / HVAC / electrical / plumbing capex.
Questions for the listing agent
- It's been on market 65 days. Have you received any prior offers? Is the seller open to a 6% concession, seller financing, or rate buy-down credit?
- Built in 1910 — when were the roof, HVAC, electrical panel, plumbing, and water heater last replaced?
- Property tax is high relative to price — has the assessment been appealed recently, and will the sale trigger a re-assessment?
- Why hasn't it sold? Are there any deal-killer items the seller is aware of (foundation, flood, title, zoning, code violations)?
- Is there a deadline driving the sale (1031 exchange, divorce, estate, relocation)? That informs how much negotiation room exists.
- Schools are F-rated, which usually means shorter tenancies and higher turnover. Who's the typical renter profile here, and what's been the actual vacancy rate?
- What's the average days-on-market for RENTAL listings here right now (not sales)? A rising rental-DOM trend means longer vacancies and softer asking-rent achievability than the comps imply.
- What's the recent tenant-quality profile in this submarket — average credit score on applications, eviction rate, late-payment / NSF rate, and stable-employment percentage? A property-management company in the area should have these aggregated.
- How much new for-sale + rental construction is in the pipeline within 1–3 miles? Heavy new supply typically softens prices + rents 12–24 months out; constrained supply supports both.
Investment metrics
- 1% rule
- 2.03% ✓
- Cap rate
- 16.22%
- Cash-on-cash
- 35.45%
- DSCR
- 2.58
- GRM
- 4.1
CMA / ARV
- ARV (median comp)
- $70,460
- List price
- $73,000
- Delta
- 3.61%
- Verdict
- FAIR
- Comps
- 20 within 1.0 mi
Show comp detail 12 sales within ~0.75 mi
| Address | Dist | Beds/Ba | Sqft | Sold | Price | $/sf | Match |
|---|---|---|---|---|---|---|---|
| 747 Chartiers Ave | 0.28mi | 3/1.0 | 1,616 (+5%) | 0mo | $105,000 | $65 | 79 |
| 853 Railroad St | 0.15mi | 3/1.0 | 1,422 (-8%) | 8mo | $57,000 | $40 | 74 |
| 27 Highland Ave | 0.36mi | 3/1.0 | 1,488 (-4%) | 5mo | $66,000 | $44 | 73 |
| 67 Rosamond St | 0.61mi | 3/2.0 | 1,545 (+0%) | 0mo | $128,000 | $83 | 67 |
| 109 Helen St | 0.36mi | 3/3.0 | 1,582 (+3%) | 5mo | $100,000 | $63 | 66 |
| 1109 Progress St | 0.44mi | 3/2.0 | 1,477 (-4%) | 3mo | $77,000 | $52 | 66 |
| 439 Alexander St | 0.08mi | 4/2.0 (+1) | 1,750 (+14%) | 3mo | $10,500 | $6 | 63 |
| 334 Russellwood Ave | 0.39mi | 4/1.5 (+1) | 1,616 (+5%) | 7mo | $149,000 | $92 | 60 |
| 127 Amelia St | 0.45mi | 4/2.0 (+1) | 1,625 (+5%) | 1mo | $190,000 | $117 | 60 |
| 19 Shaw Ave | 0.52mi | 4/1.0 (+1) | 1,485 (-4%) | 6mo | $95,000 | $64 | 59 |
| 916 2nd St | 0.28mi | 4/2.0 (+1) | 1,766 (+14%) | 6mo | $90,000 | $51 | 49 |
| 106 Shingiss St | 0.52mi | 4/2.0 (+1) | 1,744 (+13%) | 3mo | $155,000 | $89 | 42 |
Match score weights: distance 35% · size 25% · config 20% · recency 20%. Top-matched comps best support the ARV.
Projected returns pro-forma
-3.0% appreciation · 8.0% rent growth · sell at horizon
- IRR
- 37.0%
- Equity multiple
- 2.69×
- Total profit
- $34,515
- Equity at exit
- $10,885
- IRR
- 46.2%
- Equity multiple
- 6.65×
- Total profit
- $115,439
- Equity at exit
- $6,312
Cash invested: $20,440 (down + closing). Projections, not guarantees.
Landlord ↔ Tenant lean methodology
- Overall (STATE)
- 62 Landlord-Friendly
- State Pennsylvania
- 62 Landlord-Friendly · EVEN
- County
- — inherits STATE
- City
- — inherits STATE
ZIP-level market 15136
- Home prices YoY
- -30.4%
- Rents YoY
- 13.1%
- Active inventory
- 125
- Price-to-rent
- 4.1×
Monthly cashflow live
- Estimated rent
- $1,481 high interval (Pro) →
- Mortgage (P&I)
- −$383
- Tax from tax record
- −$153 /mo · $1,833/yr
- Insurance
- −$30
- HOA
- −$0
- Vacancy / Maint / Mgmt
- −$311
- Net cashflow
- $604
Break-even live
UW: 25.0% down · 7.5% · 30yr · 1.5% tax · 5.0% vac · 8.0% maint · 8.0% mgmt
Financing live
Cash to close
- Down payment
- $18,250
- Closing costs
- $2,190
- Reserves months
- —
- Total cash needed
- —
Loan-product check · same deal, 3 products live
Conventional
25% down · 7.5% · 30yr
- Down + closing
- —
- Monthly P&I
- —
- Monthly cashflow
- —
- DSCR
- —
- Eligible?
- —
Personal DTI + credit; lowest rate.
DSCR
20% down · 8.5% · 30yr
- Down + closing
- —
- Monthly P&I
- —
- Monthly cashflow
- —
- DSCR
- —
- Eligible?
- —
No personal income docs; deal must DSCR.
Hard money
10% down · 12.0% · 12mo
- Down + closing
- —
- Monthly P&I
- —
- Monthly cashflow
- —
- DSCR
- —
- Eligible?
- —
Short-term bridge; refi at stabilization.
Rent comps 18 comps
| Address | Beds | Baths | Sqft | Rent | $/sqft | DOM | Units | Dist |
|---|---|---|---|---|---|---|---|---|
| 720 Mary St Mc Kees Rocks, PA | 4.0 | 2.0 | 1800 | $1,795 | $1.00 | 7d | 1 | 0.19mi |
| 504 Fair Oaks St Mc Kees Rocks, PA | 4.0 | 1.0 | 1480 | $1,195 | $0.81 | 23d | 1 | 0.34mi |
| 27 Highland Ave Mc Kees Rocks, PA | 3.0 | 1.0 | 1488 | $1,425 | $0.96 | 23d | 1 | 0.38mi |
| 71 McKinnie Ave Mc Kees Rocks, PA | 2.0 | 1.0 | 1176 | $1,100 | $0.94 | 23d | 1 | 0.46mi |
| 22 Harlem Ave #1 McKees Rocks, PA | 2.0 | 1.0 | 1944 | $745 | $0.38 | 21d | 1 | 0.52mi |
| 500 Marwood Ave Unit NA McKees Rocks, PA | 3.0 | 2.0 | 2040 | $1,500 | $0.74 | 23d | 1 | 0.55mi |
| 500 Marwood Ave Mc Kees Rocks, PA | 3.0 | 2.0 | 2040 | $1,600 | $0.78 | 23d | 1 | 0.55mi |
| 135 Dunn St Mc Kees Rocks, PA | 3.0 | 2.0 | 1600 | $1,599 | $1.00 | 19d | 1 | 0.65mi |
| 705 Russellwood Ave Apt 2nd Floor McKees Rocks, PA | 4.0 | 1.0 | 1100 | $2,195 | $2.00 | 1d | 1 | 0.68mi |
| 705 Russellwood Ave Unit 2ndFL McKees Rocks, PA | 4.0 | 1.0 | 1100 | $2,250 | $2.05 | 2d | 1 | 0.68mi |
| 207 Singer Ave Mc Kees Rocks, PA | 3.0 | 2.0 | 1728 | $1,700 | $0.98 | 43d | 1 | 0.74mi |
| 1124a Dohrman St McKees Rocks, PA | 3.0 | 1.0 | 1150 | $1,250 | $1.09 | 23d | 1 | 0.74mi |
| 1126 Dohrman St Unit MC McKees Rocks, PA | 2.0 | 1.0 | 1200 | $1,250 | $1.04 | 43d | 1 | 0.74mi |
| 915 Woodward Ave Mc Kees Rocks, PA | 3.0 | 1.0 | 1224 | $1,399 | $1.14 | 43d | 1 | 0.86mi |
| 933 Woodward Ave Unit NA McKees Rocks, PA | 2.0 | 1.0 | 1100 | $1,400 | $1.27 | 20d | 1 | 0.90mi |
| 933 Woodward Ave Unit MC McKees Rocks, PA | 2.0 | 1.0 | 1100 | $1,400 | $1.27 | 23d | 1 | 0.90mi |
| 27 Rudolph St Mc Kees Rocks, PA | 3.0 | 1.0 | 1084 | $1,100 | $1.01 | 1d | 1 | 0.93mi |
| 802 13th St Unit 2 McKees Rocks, PA | 2.0 | 1.0 | 1100 | $920 | $0.84 | 43d | 1 | 1.03mi |
Listing history 11 events
-
2026-06-05status $73,000 Pending 65 DOM
-
2026-06-03days on market $73,000 Active 65 DOM
-
2026-06-02days on market $73,000 Active 64 DOM
-
2026-06-01days on market $73,000 Active 63 DOM
-
2026-05-31days on market $73,000 Active 62 DOM
-
2026-03-30$73,000 Active 541-char remark
Show marketing remark (541 chars)
Make this 3 bedroom 3 bath home your next rental investment property! This house has 1,542 sq ft of living space in a nice quiet neighborhood! It has a large covered porch in the front and another one in the back to sit outside and enjoy the weather. Backyard has plenty of yard space to cookout or for fun activities. Housing Authority City of Pittsburgh Voucher Plan for Tier 6 in 2026 has for 3-Bedroom: $2029.50. Please refer to hacp.org for details. Great location -minutes to grocery shopping, banking, Downtown Pittsburgh and Airport!
-
2025-07-22historical Expired 350-char remark
Show marketing remark (350 chars)
Buy this 3 bedroom 2 bath home with 1,542 sq ft of living space is in a beautiful quiet neighborhood! The house has a beautiful cover porch in the front and back to sit outside and enjoy the weather. Backyard has plenty of yard space to cookout or for activities. Great location! Minutes to grocery shopping, banking, Downtown Pittsburgh and Airport!
-
2024-07-23$80,000 Active 350-char remark
Show marketing remark (350 chars)
Buy this 3 bedroom 2 bath home with 1,542 sq ft of living space is in a beautiful quiet neighborhood! The house has a beautiful cover porch in the front and back to sit outside and enjoy the weather. Backyard has plenty of yard space to cookout or for activities. Great location! Minutes to grocery shopping, banking, Downtown Pittsburgh and Airport!
-
1995-04-05soldstatus $10,000
-
1995-04-04soldstatus $10,000
-
1994-11-07$15,000
ⓘ Source: listings_history table (triggers on properties + properties_extension) + one-shot
backfill from property_details.listing_events for pre-trigger history.
Tax reassessment forecast PA · Partial reset (capped growth)
- Current annual tax
- $1,833 · $153/mo
- Projected year-2 tax
- $1,833 · $153/mo
- Expected delta
- $0/yr ($0/mo · 0.0%)
ⓘ Screening estimate from a state-policy table — verify with the county assessor before closing.
Climate risk First Street
- Flood 1/10 Low FEMA zone X (unshaded) · 0% chance over 30 yrs
- Wildfire 1/10 Low
- Heat 4/10 Moderate 7 d/yr ≥98°F today · 17 d/yr by 30 yrs out
- Wind 2/10 Low
- Air quality 3/10 Moderate 3 unhealthy d/yr today · 3 by 30 yrs out
Nearby sold comps map
Loading sold comps map…
Walkable amenities ~0.75 mi
Loading nearby amenities…
Taxation est. · year 1
- Rental income
- $17,770
- − Mortgage interest
- −$4,089
- − Property taxes
- −$1,833
- − Insurance
- −$365
- − Repairs & maintenance
- −$1,422
- − Management
- −$1,422
- − Depreciation
- −$2,124
- Taxable income
- $6,516
- Est. tax owed @ 24.0%
- −$1,564
- After-tax cash flow
- $5,682/yr
For passive investors: Depreciation is non-cash, so a rental often shows a tax loss while cash-flowing — sheltering income. Rental losses are passive: they offset passive income freely, and up to $25,000/yr can offset ordinary (W-2) income if you actively participate and your MAGI is under $100k (phasing out to $0 by $150k); unused losses carry forward. On sale, claimed depreciation is recaptured at up to 25%, and gains may owe capital-gains tax (a 1031 exchange can defer both). Figures are a year-1 estimate at your 24.0% rate — not tax advice; consult a CPA.
Schools (NCES district)
- District
- Sto-Rox SD
- NCES district ID
- 4222830
- Math proficiency
- 4% ▼ -5.00%
- Reading proficiency
- 18% ▼ -4.00%
- Median HH income
- $30,268
- Composite
- 8.51/100
- National rank
- #9904
- State rank
- #532 of 539 in PA
Livability — McKees Rocks
- Score
- 82/100
- State rank
- #143
- US rank
- #1154
Category grades
Schools grade is shown separately in the Schools card above.
Census & demographics
- Census place
- McKees Rocks, PA
- County
- Allegheny County · 1,022,028 people
- City population
- 22,623
- Metro
- Pittsburgh, PA
- Population (ZIP)
- 22,623
- Household income
- $69,099
- Rent vs Own
- Severe rent burden
- 768.0
Population outlook (Allegheny County) Hauer SSP2
- Today (2025)
- 1,250,282 people
- By 2030
- 1,256,482 · +0.5%
- By 2040
- 1,256,318 · +0.5%
- By 2050
- 1,244,169 · -0.5%
- By 2075
- 1,197,693 · -4.2%
- By 2100
- 1,093,187 · -12.6%
Race, ethnicity, and origin ACS 2023
- Neighborhood character
- Predominantly White (75%)
- Race & ethnicity
- White 75% Black 18% Two or more races 4% Hispanic / Latino 2%
- Common ancestry
- Romanian 10% Subsaharan African 3% Scotch-Irish 2%
- Foreign-born
- 3% · Canada
- Languages at home
- 96% English-only · Spanish 1% Other Indo-European 1%
Political lean MEDSL · Allegheny
- 2024 margin
- Strong D (+20.3) · D 59.7% · R 39.4%
- 2008→2024 swing
- +4.8pp toward D · 2008: 15.5pp · 2024: 20.3pp
- All cycles
- 2024: D+20.3 2020: D+20.4 2016: D+16.4 2012: D+14.4 2008: D+15.5
Not yet ingested
- Civics
- —
Market trends
- HPI YoY
- ▼ -107.07%
- Current HPI
- 244.6934
- Rent YoY
- ▲ 13.12%
- Metro
- Pittsburgh, PA
- State GDP YoY
- ▲ 1.68%
- F500 in state
- 34
Industry mix (Fortune 500 HQ in PA)
| Industry | F500 HQs | Revenue |
|---|---|---|
| Healthcare | 2 | $309B |
|
||
| Insurance | 2 | $27B |
|
||
| Telecommunications / Media | 1 | $124B |
|
||
| Industrial Distribution | 1 | $22B |
|
||
| Financial Services | 1 | $20B |
|
||
| Chemicals / Materials | 1 | $18B |
|
||
Price history
+386.7% since first listed6 events — show timeline
- 2026-03-30 Listed $73,000 West Penn MLS
- 2025-07-22 Delisted — West Penn MLS
- 2024-07-23 Listed $80,000 West Penn MLS
- 1995-04-05 Sold (Public Records) $10,000 Public Records
- 1995-04-04 Sold (MLS) $10,000 West Penn MLS
- 1994-11-07 Listed $15,000 West Penn MLS
Property tax history
+2.4%/yrLatest (2026): $1,833 · +4.1% YoY. Source: county tax records.
Cash-flow waterfall
monthlySold comps — $/sqft
last 12 mo · ≤1 miLoading sold comps…