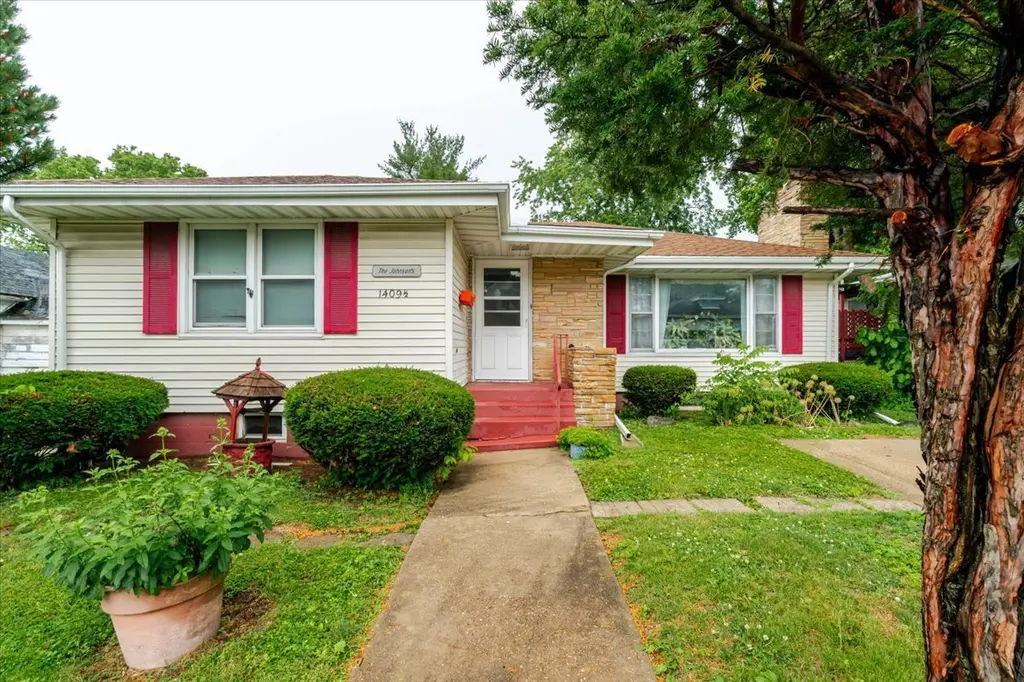
1409 1/2 Mulberry St · Bloomington, IL
Flood risk 1/10 · Minimal
- FEMA flood zone
- X (unshaded)
- Chance of flooding over 30 yrs
- 0.0%
- Est. flood insurance / yr
- $473 – $860
Fire risk 1/10 · Minimal
- Est. fire insurance / yr
- $804 – $1,492
Heat risk 3/10 · Minor
- Hot days now (above 105°F)
- 7 days/yr
- Hot days in 30 yrs
- 18 days/yr
Wind risk 2/10 · Minimal
- Chance of severe wind over 30 yrs
- 1.0%
Air-quality risk 2/10 · Minimal
- Unhealthy air days now
- 1 days/yr
- Unhealthy air days in 30 yrs
- 2 days/yr
Risk factors via First Street. Map © Google.
Why this score? — see what drove the B+ grade
The composite is a weighted blend of 9 inputs, each scored 0–100. Each bar is that input's sub-score; the figure is the points it added to the 100-point composite (weight × sub-score).
- Cash flow +30.0/30.0
- ARV discount +15.0/15.0
- DSCR +10.0/10.0
- 1% rule +8.7/10.0
- Rent growth +3.9/5.0
- Livability +3.9/5.0
- Condition / age +2.2/5.0
- Schools +1.5/10.0
- Appreciation +0.0/10.0
$130,000
🖨 Deal sheet 📄 Offer letter ✓ Due diligence
Listing remarks
Wonderful well-built home with 3 bedrooms, 2 bathrooms, Lots of living space throughout. Beautiful large kitchen with the unique original cabinets. Large living room and dining room with lots of natural light coming through the abundance of windows. Original hardwood through the home!!! Finished lower level with second kitchen area, laundry and full bath. Bar area and family room. Extra room for office/ workout room. .. no egress window. Very deep lot with alley access. Some remodel 2017-2018. Some newer windows, Home has sump pump and a dewatering system. Home is being sold as is.
Key facts
- Large kitchen
- Family room
- Bar area
Tags
Property features AI
Finance
- Other: Below-grade finished area approximately 1,352 (finished lower level); Approximate total finished area listed as 2,704
- HOA & community: No master association fee required
Exterior
- Parking: One parking space
- Utilities: Public water; Public sewer; Electric with circuit breakers
- Home design: Detached single-family home; One-story layout with additional finished lower level; Fee simple ownership
- Construction: Vinyl siding and brick exterior; Built before 1978
- Exterior features: Lot dimensions approximately 50 x 139; Lot smaller than 0.25 acre
Interior
- Kitchen: Main-level kitchen
- Bedrooms: Three bedrooms (master and two additional bedrooms on the main level); Additional finished rooms in the basement usable as extra bedrooms or flexible space
- Bathrooms: Two full bathrooms; Basement has a bathroom
- Heating & cooling: Radiator heating; Window air conditioning units
- Interior features: Finished full basement; Seven total rooms
- Laundry & utility: Basement laundry room (21 x 13)
Neighborhood map
What this means for you Summary
Snapshot
- This is a 3-bed/2.0-bath single-family listed at $130k. Condition is rated fair.
Deal economics
- At list price, monthly cash flow is $510 ($6k/yr) — positive.
- The deal already cash-flows at list — no discount required.
- Meets the 1% rule at list price ($2k rent vs $130k).
- Cap rate 11.0% vs local median 5.4% in Bloomington — top-decile yield for the area; either an underpriced asset or a hidden risk that comps aren't pricing in. Stress-test before assuming the spread holds.
Location & tenants
- Location reads 77/100 on livability (#161 in IL, #2,987 nationally) — a middle-class / working-renter tenant base. Strengths: cost of living A+, housing A+, health & safety A+; Watch: amenities C-, commute F.
- Bloomington SD 87 (urban): math 14% / reading 19% proficiency, ranked #476 of 620 in IL (top 77%) — low school quality limits family demand, transient renter base, plan for 1-2y turnover.
- Zoned schools: Sheridan Elem School (math 2% / reading 8%, grade F, #1,741 of 2,056 statewide, top 93%, 365 students, 0% FRL); Bloomington Jr High School (math 12% / reading 19%, grade F, #493 of 665 statewide, top 75%, 1,006 students, 0% FRL); Bloomington High School (math 27% / reading 33%, grade F, #179 of 693 statewide, top 27%, 1,503 students, 0% FRL) — zoned schools average 0% FRL vs 51% district-wide (51 pts lower); this property's tenant base skews higher-income than the district average.
- Market conditions: Rents rising fast (+5.6%/yr); 88 active listings in the ZIP; 1 comparable units currently listed for rent nearby; 247 units permitted in McLean County in 2024 (54 in 5+ unit buildings).
- This rent runs 37% of the median local income ($57k/yr) — at the standard rent-burdened threshold; future hikes will face affordability resistance.
Forward outlook
- Local home prices are declining (-3.0%/yr); year-one equity from $899 of loan paydown is wiped out by about $4k of value loss. Plan a longer hold.
- At projected returns (-3.0% appreciation + 5.6% rent growth), your $36k cash investment doubles in ~7 years — after that, you're playing with house money.
Negotiation context
- Only 10 days on market — expect competitive offers; lowballing is unlikely to land.
Questions for the listing agent
- Have any recent inspections been done? Can we get a copy of the seller's disclosures and any deferred-maintenance estimates?
- Is there a deadline driving the sale (1031 exchange, divorce, estate, relocation)? That informs how much negotiation room exists.
- What's the average days-on-market for RENTAL listings here right now (not sales)? A rising rental-DOM trend means longer vacancies and softer asking-rent achievability than the comps imply.
- What's the recent tenant-quality profile in this submarket — average credit score on applications, eviction rate, late-payment / NSF rate, and stable-employment percentage? A property-management company in the area should have these aggregated.
- How much new for-sale + rental construction is in the pipeline within 1–3 miles? Heavy new supply typically softens prices + rents 12–24 months out; constrained supply supports both.
Investment metrics
- 1% rule
- 1.37% ✓
- Cap rate
- 11.00%
- Cash-on-cash
- 16.81%
- DSCR
- 1.75
- GRM
- 6.1
CMA / ARV
- ARV (on-the-fly)
- $162,240
- Comps found
- 5
Show comp detail 5 sales within ~0.75 mi
| Address | Dist | Beds/Ba | Sqft | Sold | Price | $/sf | Match |
|---|---|---|---|---|---|---|---|
| 1303 W Locust St | 0.21mi | 4/2.0 (+1) | 3,028 (+12%) | 12mo | $180,500 | $60 | 55 |
| 805 W Washington St | 0.61mi | 4/2.0 (+1) | 2,569 (-5%) | 17mo | $172,000 | $67 | 44 |
| 910 W Mulberry St | 0.43mi | 3/2.0 | 2,368 (-12%) | 19mo | $137,000 | $58 | 43 |
| 601 W Chestnut St | 0.72mi | 4/2.0 (+1) | 2,400 (-11%) | 12mo | $169,000 | $70 | 32 |
| 206 S Allin St | 0.72mi | 2/2.0 (-1) | 2,306 (-15%) | 11mo | $135,900 | $59 | 28 |
Match score weights: distance 35% · size 25% · config 20% · recency 20%. Top-matched comps best support the ARV.
Projected returns pro-forma
-3.0% appreciation · 5.6% rent growth · sell at horizon
- IRR
- 10.9%
- Equity multiple
- 1.45×
- Total profit
- $16,214
- Equity at exit
- $19,383
- IRR
- 22.0%
- Equity multiple
- 3.11×
- Total profit
- $76,744
- Equity at exit
- $11,240
Cash invested: $36,400 (down + closing). Projections, not guarantees.
Landlord ↔ Tenant lean methodology
- Overall (STATE)
- 43 Moderately Tenant-Leaning
- State Illinois
- 43 Moderately Tenant-Leaning · D+7
- County
- — inherits STATE
- City
- — inherits STATE
ZIP-level market 61701
- Rents YoY
- 5.6%
- Active inventory
- 88
- Price-to-rent
- 6.1×
Monthly cashflow live
- Estimated rent
- $1,783 medium interval (Pro) →
- Mortgage (P&I)
- −$682
- Tax est. 1.5%
- −$162 /mo · $1,950/yr
- Insurance
- −$54
- HOA
- −$0
- Vacancy / Maint / Mgmt
- −$374
- Net cashflow
- $510
Break-even live
UW: 25.0% down · 7.5% · 30yr · 1.5% tax · 5.0% vac · 8.0% maint · 8.0% mgmt
Financing live
Cash to close
- Down payment
- $32,500
- Closing costs
- $3,900
- Reserves months
- —
- Total cash needed
- —
Loan-product check · same deal, 3 products live
Conventional
25% down · 7.5% · 30yr
- Down + closing
- —
- Monthly P&I
- —
- Monthly cashflow
- —
- DSCR
- —
- Eligible?
- —
Personal DTI + credit; lowest rate.
DSCR
20% down · 8.5% · 30yr
- Down + closing
- —
- Monthly P&I
- —
- Monthly cashflow
- —
- DSCR
- —
- Eligible?
- —
No personal income docs; deal must DSCR.
Hard money
10% down · 12.0% · 12mo
- Down + closing
- —
- Monthly P&I
- —
- Monthly cashflow
- —
- DSCR
- —
- Eligible?
- —
Short-term bridge; refi at stabilization.
Rent comps 1 comps
| Address | Beds | Baths | Sqft | Rent | $/sqft | DOM | Units | Dist |
|---|---|---|---|---|---|---|---|---|
| 501 E Emerson St Bloomington, IL | 3.0 | 1.5 | 2825 | $2,500 | $0.88 | 43d | 1 | 1.48mi |
Listing history 9 events
-
2026-06-19days on market $130,000 Active 10 DOM
-
2026-06-18days on market $130,000 Active 9 DOM
-
2026-06-17days on market $130,000 Active 8 DOM
-
2026-06-16pricedays on market $130,000 Active 7 DOM
-
2026-06-15days on market $150,000 Active 6 DOM
-
2026-06-14days on market $150,000 Active 4 DOM
-
2026-06-13days on market $150,000 Active 3 DOM
-
2026-06-10remarks 588-char remark
-
2026-06-10$150,000 Active 1 DOM
ⓘ Source: listings_history table (triggers on properties + properties_extension) + one-shot
backfill from property_details.listing_events for pre-trigger history.
Climate risk First Street
- Flood 1/10 Low FEMA zone X (unshaded) · 0% chance over 30 yrs
- Wildfire 1/10 Low
- Heat 3/10 Moderate 7 d/yr ≥105°F today · 18 d/yr by 30 yrs out
- Wind 2/10 Low 100% chance of damaging wind over 30 yrs
- Air quality 2/10 Low 1 unhealthy d/yr today · 2 by 30 yrs out
Nearby sold comps map
Loading sold comps map…
Walkable amenities ~0.75 mi
Loading nearby amenities…
Taxation est. · year 1
- Rental income
- $21,390
- − Mortgage interest
- −$7,282
- − Property taxes
- −$1,950
- − Insurance
- −$650
- − Repairs & maintenance
- −$1,711
- − Management
- −$1,711
- − Depreciation
- −$3,782
- Taxable income
- $4,304
- Est. tax owed @ 24.0%
- −$1,033
- After-tax cash flow
- $5,085/yr
For passive investors: Depreciation is non-cash, so a rental often shows a tax loss while cash-flowing — sheltering income. Rental losses are passive: they offset passive income freely, and up to $25,000/yr can offset ordinary (W-2) income if you actively participate and your MAGI is under $100k (phasing out to $0 by $150k); unused losses carry forward. On sale, claimed depreciation is recaptured at up to 25%, and gains may owe capital-gains tax (a 1031 exchange can defer both). Figures are a year-1 estimate at your 24.0% rate — not tax advice; consult a CPA.
Condition & rehab AI · 12 photos
This home requires moderate renovations to improve its condition and increase its value. The interior and exterior need significant updates, and the kitchen and bathrooms are in poor condition.
Repairs flagged
- Major kitchen cabinets — Severely outdated and worn
- Major bathroom fixtures — Severely outdated and worn
- Moderate exterior siding — Worn and some discoloration
- Major flooring — Worn and outdated
- Major interior walls/paint — Worn and outdated
Value-add opportunities
- Resale Paint interior walls — Fresh paint can make a significant difference in the home's appearance
- Resale Replace kitchen cabinets — New cabinets can greatly improve the kitchen's functionality and aesthetic
- Resale Replace bathroom fixtures — New fixtures can make a big impact on the home's overall appeal
- Resale Replace flooring — New flooring can make a big difference in the home's overall appearance and functionality
- Resale Paint exterior siding — Fresh paint can make a significant difference in the home's curb appeal
Renovation cost estimate screening
| Repair item | Severity | Est. cost |
|---|---|---|
| kitchen cabinets · Severely outdated and worn | Major | $15,000–50,000 |
| bathroom fixtures · Severely outdated and worn | Major | $15,000–50,000 |
| exterior siding · Worn and some discoloration | Moderate | $3,000–15,000 |
| flooring · Worn and outdated | Major | $15,000–50,000 |
| interior walls/paint · Worn and outdated | Major | $15,000–50,000 |
| Total estimated repair cost · 5 items | $63,000–215,000 |
Value-add ROI direction
- Resale Paint interior walls — Fresh paint can make a significant difference in the home's appearance ↑
- Resale Replace kitchen cabinets — New cabinets can greatly improve the kitchen's functionality and aesthetic ↑
- Resale Replace bathroom fixtures — New fixtures can make a big impact on the home's overall appeal ↑
- Resale Replace flooring — New flooring can make a big difference in the home's overall appearance and functionality ↑
- Resale Paint exterior siding — Fresh paint can make a significant difference in the home's curb appeal ↑
ⓘ Cost ranges are severity-bucket heuristics (US national rule-of-thumb). Get contractor quotes + a written scope before underwriting a rehab budget.
Schools (NCES district)
- District
- Bloomington SD 87
- NCES district ID
- 1706480
- Math proficiency
- 14% ▼ -7.00%
- Reading proficiency
- 19% ▼ -7.00%
- Median HH income
- $50,544
- Composite
- 15.05/100
- National rank
- #9351
- State rank
- #476 of 620 in IL
Livability — Bloomington
- Score
- 77/100
- State rank
- #161
- US rank
- #2987
Category grades
Schools grade is shown separately in the Schools card above.
Census & demographics
- Census place
- Bloomington, IL
- County
- McLean County · 126,490 people
- City population
- 72,415
- Metro
- Bloomington, IL
- Population (ZIP)
- 35,136
- Household income
- $57,130
- Rent vs Own
- Severe rent burden
- 1493.0
Population outlook (McLean County) Hauer SSP2
- Today (2025)
- 176,468 people
- By 2030
- 178,002 · +0.9%
- By 2040
- 178,592 · +1.2%
- By 2050
- 177,090 · +0.4%
- By 2075
- 173,224 · -1.8%
- By 2100
- 158,425 · -10.2%
Race, ethnicity, and origin ACS 2023
- Neighborhood character
- Predominantly White (70%)
- Race & ethnicity
- White 70% Black 13% Two or more races 9% Hispanic / Latino 9% Asian 3%
- Hispanic origin (detail)
- Mexican 7%
- Common ancestry
- Romanian 3% Slovak 2% Italian 1%
- Foreign-born
- 6% · Canada, Philippines, Vietnam
- Languages at home
- 91% English-only · Spanish 5% Other Asian/Pacific 1% Other Indo-European 1%
Political lean MEDSL · McLean
- 2024 margin
- Toss-up / Even · D 51.6% · R 46.8% · Other 1.6%
- 2008→2024 swing
- +3.7pp toward D · 2008: 1.2pp · 2024: 4.9pp
- All cycles
- 2024: D+4.9 2020: D+3.9 2016: R+1.5 2012: R+11.1 2008: D+1.2
Not yet ingested
- Civics
- —
Market trends
- HPI YoY
- ▼ -115.13%
- Current HPI
- 172.3659
- Rent YoY
- ▲ 5.60%
- Metro
- Bloomington, IL
- State GDP YoY
- ▲ 1.59%
- F500 in state
- 60
Industry mix (Fortune 500 HQ in IL)
| Industry | F500 HQs | Revenue |
|---|---|---|
| Insurance | 4 | $201B |
|
||
| Consumer Goods | 4 | $87B |
|
||
| Industrial Machinery | 3 | $64B |
|
||
| Healthcare | 2 | $55B |
|
||
| Retail / Pharmacy | 1 | $148B |
|
||
| Agriculture / Food | 1 | $86B |
|
||
Price history
1 event — show timeline
- 2026-06-09 Listed $150,000 MRED as Distributed by MLS Grid
Cash-flow waterfall
monthlySold comps — $/sqft
last 12 mo · ≤1 miLoading sold comps…