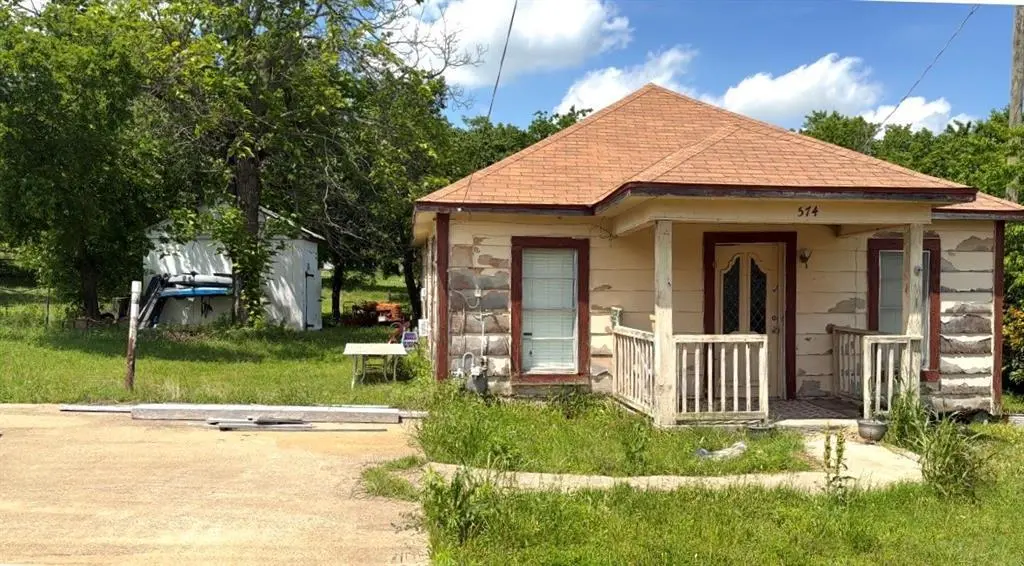
574 E Marshall St · Van Alstyne, TX
Flood risk No data
- FEMA flood zone
- —
- Chance of flooding over 30 yrs
- —
- Est. flood insurance / yr
- —
Fire risk No data
- Est. fire insurance / yr
- —
Heat risk No data
- Hot days now (above threshold)
- —
- Hot days in 30 yrs
- —
Wind risk No data
- Chance of severe wind over 30 yrs
- —
Air-quality risk No data
- Unhealthy air days now
- —
- Unhealthy air days in 30 yrs
- —
Risk factors via First Street. Map © Google.
Why this score? — see what drove the B- grade
The composite is a weighted blend of 9 inputs, each scored 0–100. Each bar is that input's sub-score; the figure is the points it added to the 100-point composite (weight × sub-score).
- Cash flow +22.5/30.0
- ARV discount +15.0/15.0
- DSCR +7.2/10.0
- 1% rule +6.6/10.0
- Schools +5.3/10.0
- Livability +3.8/5.0
- Rent growth +2.5/5.0
- Condition / age +2.5/5.0
- Appreciation +0.0/10.0
$149,000
🖨 Deal sheet 📄 Offer letter ✓ Due diligence
Listing remarks
Opportunity is knocking. Just a few blocks from the heart of downtown Van Alstyne, one of North Texas's fastest-growing communities, this charming 2-bedroom, 1-bath home sits on a picturesque lot shaded by mature trees and is bursting with potential. Sold as-is, this property is the perfect canvas for investors, flippers, or entrepreneurial buyers ready to roll up their sleeves. The flexible footprint offers a natural opportunity to expand and add on, making it easy to increase both square footage and value. With some vision and updates, this gem could shine. And the location? It doesn't get better than this. Van Alstyne's downtown scene is making serious waves — drawing visitors from
Key facts
- Downtown van alstyne
- Large lot
- Storage bldg
Tags
Property features AI
Finance
- Financial info: Cash offers accepted
- HOA & community: No association
Exterior
- Parking: Driveway parking
- Utilities: City water; City sewer; All-weather road
- Home design: Single-family residence; Attached property; One-story
- Construction: Built in 1920; Wood construction; Pillar/post/pier foundation; Composition roof
- Exterior features: Corner lot; All-weather road access; City water and city sewer
Interior
- Kitchen: Electric range
- Bedrooms: 2 bedrooms (both on the main level)
- Bathrooms: 1 full bathroom
- Heating & cooling: Electric heating (other); Window unit cooling
- Interior features: Four total rooms; One living area; One dining area; Other interior features
Neighborhood map
What this means for you Summary
Snapshot
- This is a 2-bed/1.0-bath single-family listed at $149k.
Deal economics
- At list price, monthly cash flow is $250 ($3k/yr) — positive.
- The deal already cash-flows at list — no discount required.
- Meets the 1% rule at list price ($2k rent vs $149k).
- Recommended offer: $145k (3.0% below list) — sets the bar for market timing.
- Cap rate 8.3% vs local median 2.7% in Van Alstyne — top-decile yield for the area; either an underpriced asset or a hidden risk that comps aren't pricing in. Stress-test before assuming the spread holds.
Location & tenants
- Location reads 75/100 on livability (#134 in TX, #3,950 nationally) — a middle-class / working-renter tenant base. Strengths: crime A+, employment A+, cost of living A+; Watch: amenities F, commute F, health & safety F.
- Van Alstyne ISD (rural): math 62% / reading 59% proficiency, ranked #51 of 826 in TX (top 6%) — acceptable for families but not a draw, mixed tenant base, ~2y average lease.
- Zoned schools: John And Nelda Partin El (math 55% / reading 58%, grade C+, #559 of 4,322 statewide, top 13%, 516 students, 22% FRL) — zoned schools at 22% FRL track the district average.
- Market conditions: 624 active listings in the ZIP; 9 comparable units currently listed for rent nearby; rentals at typical pace (median 22d on market — plan ~3-4 weeks tenant-placement turnaround); high-income renter base; 2,272 units permitted in Grayson County in 2024 (750 in 5+ unit buildings).
Forward outlook
- Local home prices are declining (-3.0%/yr); year-one equity from $1k of loan paydown is wiped out by about $4k of value loss. Plan a longer hold.
- Grayson County population projected at +12% by 2050 — modest demand growth; plan on rents tracking national, not racing it.
Negotiation context
- It's been on market 36 days — a 3% lower offer ($145k) is reasonable based on typical stale-listing flexibility.
- 3 sale attempts since 3y ago; this cycle's ask has dropped $11k (7%) from the opening price — seller is motivated, your offer sets the floor, not the list.
Risks & watch-outs
- Watch-outs: built in 1920 — expect roof / HVAC / electrical / plumbing capex.
Questions for the listing agent
- It's been on market 36 days. Have you received any prior offers? Is the seller open to a 3% concession, seller financing, or rate buy-down credit?
- Built in 1920 — when were the roof, HVAC, electrical panel, plumbing, and water heater last replaced?
- Is there a deadline driving the sale (1031 exchange, divorce, estate, relocation)? That informs how much negotiation room exists.
- Schools are B-rated — typically a magnet for longer-tenancy family renters. What's the average tenant stay here, and is there a school-zone premium baked into asking?
- What's the average days-on-market for RENTAL listings here right now (not sales)? A rising rental-DOM trend means longer vacancies and softer asking-rent achievability than the comps imply.
- What's the recent tenant-quality profile in this submarket — average credit score on applications, eviction rate, late-payment / NSF rate, and stable-employment percentage? A property-management company in the area should have these aggregated.
- How much new for-sale + rental construction is in the pipeline within 1–3 miles? Heavy new supply typically softens prices + rents 12–24 months out; constrained supply supports both.
Investment metrics
- 1% rule
- 1.16% ✓
- Cap rate
- 8.31%
- Cash-on-cash
- 7.19%
- DSCR
- 1.32
- GRM
- 7.2
CMA / ARV
- ARV (median comp)
- $213,076
- List price
- $149,000
- Delta
- -30.07%
- Verdict
- UNDERPRICED
- Comps
- 20 within 1.0 mi
Show comp detail 12 sales within ~0.75 mi
| Address | Dist | Beds/Ba | Sqft | Sold | Price | $/sf | Match |
|---|---|---|---|---|---|---|---|
| 751 E Cooper St | 0.12mi | 3/1.0 (+1) | 1,200 (+7%) | 8mo | $319,000 | $266 | 71 |
| 721 Wa Denton Dr | 0.48mi | 2/2.0 | 1,068 (-5%) | 1mo | $189,900 | $178 | 64 |
| 162 W Shreveport St | 0.30mi | 2/1.0 | 960 (-15%) | 1mo | $165,000 | $172 | 61 |
| 851 N John Douglas Rd | 0.44mi | 3/2.0 (+1) | 1,144 (+2%) | 8mo | $257,500 | $225 | 61 |
| 182 Douglas St | 0.46mi | 2/2.0 | 1,212 (+8%) | 2mo | $259,000 | $214 | 59 |
| 271 E Houston St | 0.35mi | 3/2.0 (+1) | 1,218 (+8%) | 3mo | $285,000 | $234 | 58 |
| 765 N John Douglas Rd | 0.39mi | 2/2.0 | 1,070 (-5%) | 15mo | $260,000 | $243 | 57 |
| 496 W Jefferson St | 0.56mi | 3/2.0 (+1) | 1,138 (+1%) | 10mo | $285,000 | $250 | 55 |
| 648 S Dallas St | 0.43mi | 3/1.0 (+1) | 998 (-11%) | 16mo | $150,000 | $150 | 43 |
| 256 W Houston Ln | 0.47mi | 3/1.0 (+1) | 1,238 (+10%) | 19mo | $220,000 | $178 | 41 |
| 425 W Marshall Dr | 0.47mi | 3/2.0 (+1) | 1,264 (+12%) | 10mo | $260,000 | $206 | 40 |
| 356 Stinnett Dr | 0.50mi | 3/2.0 (+1) | 1,032 (-8%) | 17mo | $199,000 | $193 | 40 |
Match score weights: distance 35% · size 25% · config 20% · recency 20%. Top-matched comps best support the ARV.
Projected returns pro-forma
-3.0% appreciation · 3.0% rent growth · sell at horizon
- IRR
- -5.2%
- Equity multiple
- 0.80×
- Total profit
- $-8,144
- Equity at exit
- $22,216
- IRR
- 4.5%
- Equity multiple
- 1.33×
- Total profit
- $13,737
- Equity at exit
- $12,883
Cash invested: $41,720 (down + closing). Projections, not guarantees.
Landlord ↔ Tenant lean methodology
- Overall (STATE)
- 87 Strongly Landlord-Friendly
- State Texas
- 87 Strongly Landlord-Friendly · R+5
- County
- — inherits STATE
- City
- — inherits STATE
ZIP-level market 75495
- Home prices YoY
- -10.4%
- Active inventory
- 624
- Price-to-rent
- 7.2×
Monthly cashflow live
- Estimated rent
- $1,734 high interval (Pro) →
- Mortgage (P&I)
- −$781
- Tax from tax record
- −$276 /mo · $3,314/yr
- Insurance
- −$62
- HOA
- −$0
- Vacancy / Maint / Mgmt
- −$364
- Net cashflow
- $250
Break-even live
UW: 25.0% down · 7.5% · 30yr · 1.5% tax · 5.0% vac · 8.0% maint · 8.0% mgmt
Financing live
Cash to close
- Down payment
- $37,250
- Closing costs
- $4,470
- Reserves months
- —
- Total cash needed
- —
Loan-product check · same deal, 3 products live
Conventional
25% down · 7.5% · 30yr
- Down + closing
- —
- Monthly P&I
- —
- Monthly cashflow
- —
- DSCR
- —
- Eligible?
- —
Personal DTI + credit; lowest rate.
DSCR
20% down · 8.5% · 30yr
- Down + closing
- —
- Monthly P&I
- —
- Monthly cashflow
- —
- DSCR
- —
- Eligible?
- —
No personal income docs; deal must DSCR.
Hard money
10% down · 12.0% · 12mo
- Down + closing
- —
- Monthly P&I
- —
- Monthly cashflow
- —
- DSCR
- —
- Eligible?
- —
Short-term bridge; refi at stabilization.
Rent comps 9 comps
| Address | Beds | Baths | Sqft | Rent | $/sqft | DOM | Units | Dist |
|---|---|---|---|---|---|---|---|---|
| 1185 E Jefferson St Van Alstyne, TX | 3.0 | 2.0 | 1449 | $2,000 | $1.38 | 20d | 1 | 0.36mi |
| 182 Douglas Ln Van Alstyne, TX | 2.0 | 2.0 | 1212 | $1,800 | $1.49 | 21d | 1 | 0.48mi |
| 525 Gilcrease Van Alstyne, TX | 3.0 | 2.0 | 1208 | $1,895 | $1.57 | 43d | 1 | 0.54mi |
| 1237 S Waco St Van Alstyne, TX | 2.0 | 1.5 | 1212 | $1,650 | $1.36 | 21d | 1 | 0.63mi |
| 653 N Henry Hynds Expy Van Alstyne, TX | 2.0 | 1.0 | 575 | $999 | $1.74 | 17d | 3 | 0.99mi |
| 15 Henry Hynds Expy Unit 15 Van Alstyne, TX | 2.0 | 1.0 | 750 | $999 | $1.33 | 43d | 1 | 1.02mi |
| 712 Billups Cir Van Alstyne, TX | 3.0 | 2.0 | 1489 | $1,950 | $1.31 | 11d | 1 | 1.06mi |
| 500 U.S. 75 Unit 1 Van Alstyne, TX | 2.0 | 1.0 | 750 | $999 | $1.33 | 24d | 1 | 1.07mi |
| 500 U.S. 75 Unit 9 Van Alstyne, TX | 2.0 | 1.0 | 750 | $999 | $1.33 | 43d | 1 | 1.07mi |
Listing history 26 events
-
2026-06-18days on market $149,000 Active 36 DOM
-
2026-06-17days on market $149,000 Active 35 DOM
-
2026-06-16days on market $149,000 Active 34 DOM
-
2026-06-15days on market $149,000 Active 33 DOM
-
2026-06-13days on market $149,000 Active 31 DOM
-
2026-06-13days on market $149,000 Active 30 DOM
-
2026-06-10remarks 693-char remark
-
2026-06-09days on market $149,000 Active 27 DOM
-
2026-06-08days on market $149,000 Active 26 DOM
-
2026-06-07days on market $149,000 Active 25 DOM
-
2026-06-04days on market $149,000 Active 22 DOM
-
2026-06-03days on market $149,000 Active 21 DOM
-
2026-06-02pricedays on market $149,000 Active 20 DOM
-
2026-06-01days on market $159,900 Active 19 DOM
-
2026-05-31days on market $159,900 Active 18 DOM
-
2026-05-12$159,900 Active 193-char remark
-
2025-01-31historical
-
2024-10-31price $169,999
-
2024-09-14price $179,999
-
2024-09-03price $180,000
-
2024-08-29price $183,000
-
2024-08-24$185,000 Active
-
2024-06-25historical
-
2023-09-17price $235,000
-
2023-06-26$250,000 Active
-
1994-09-08soldstatus
ⓘ Source: listings_history table (triggers on properties + properties_extension) + one-shot
backfill from property_details.listing_events for pre-trigger history.
Tax reassessment forecast TX · Resets to sale price
- Current annual tax
- $3,314 · $276/mo
- Projected year-2 tax
- $3,314 · $276/mo
- Expected delta
- $0/yr ($0/mo · 0.0%)
ⓘ Screening estimate from a state-policy table — verify with the county assessor before closing.
Nearby sold comps map
Loading sold comps map…
Walkable amenities ~0.75 mi
Loading nearby amenities…
Taxation est. · year 1
- Rental income
- $20,804
- − Mortgage interest
- −$8,346
- − Property taxes
- −$3,314
- − Insurance
- −$745
- − Repairs & maintenance
- −$1,664
- − Management
- −$1,664
- − Depreciation
- −$4,335
- Taxable income
- $735
- Est. tax owed @ 24.0%
- −$176
- After-tax cash flow
- $2,823/yr
For passive investors: Depreciation is non-cash, so a rental often shows a tax loss while cash-flowing — sheltering income. Rental losses are passive: they offset passive income freely, and up to $25,000/yr can offset ordinary (W-2) income if you actively participate and your MAGI is under $100k (phasing out to $0 by $150k); unused losses carry forward. On sale, claimed depreciation is recaptured at up to 25%, and gains may owe capital-gains tax (a 1031 exchange can defer both). Figures are a year-1 estimate at your 24.0% rate — not tax advice; consult a CPA.
Schools (NCES district)
- District
- Van Alstyne ISD
- NCES district ID
- 4843890
- Math proficiency
- 62% ▼ -1.00%
- Reading proficiency
- 59% ▼ -2.00%
- Median HH income
- $68,451
- Composite
- 53.28/100
- National rank
- #1491
- State rank
- #51 of 826 in TX
Livability — Van Alstyne
- Score
- 75/100
- State rank
- #134
- US rank
- #3950
Category grades
Schools grade is shown separately in the Schools card above.
Census & demographics
- Census place
- Van Alstyne, TX
- County
- Grayson County · 108,053 people
- City population
- 11,120
- Metro
- Sherman-Denison, TX
- Population (ZIP)
- 11,120
- Household income
- $111,563
- Rent vs Own
- Severe rent burden
- 93.0
Population outlook (Grayson County) Hauer SSP2
- Today (2025)
- 134,540 people
- By 2030
- 138,653 · +3.1%
- By 2040
- 145,958 · +8.5%
- By 2050
- 151,218 · +12.4%
- By 2075
- 161,802 · +20.3%
- By 2100
- 159,036 · +18.2%
Race, ethnicity, and origin ACS 2023
- Neighborhood character
- Predominantly White (70%)
- Race & ethnicity
- White 70% Hispanic / Latino 20% Two or more races 15% Black 4%
- Hispanic origin (detail)
- Mexican 19%
- Common ancestry
- Lithuanian 5% Slovak 3% Italian 2%
- Foreign-born
- 9% · Canada
- Languages at home
- 83% English-only · Spanish 15% Russian/Polish/Slavic 1% Tagalog/Filipino 1%
Political lean MEDSL · Grayson
- 2024 margin
- Solid R (+54.3) · D 22.5% · R 76.7%
- 2008→2024 swing
- -16.4pp toward R · 2008: -37.9pp · 2024: -54.3pp
- All cycles
- 2024: R+54.3 2020: R+49.9 2016: R+53.1 2012: R+48.0 2008: R+37.9
Not yet ingested
- Civics
- —
Market trends
- HPI YoY
- ▼ -32.06%
- Current HPI
- 274.6361
- Rent YoY
- —
- Metro
- Sherman-Denison, TX
- State GDP YoY
- ▲ 3.95%
- F500 in state
- 110
Industry mix (Fortune 500 HQ in TX)
| Industry | F500 HQs | Revenue |
|---|---|---|
| Energy | 16 | $1,198B |
|
||
| Technology | 5 | $198B |
|
||
| Engineering / Construction | 4 | $72B |
|
||
| Energy Services | 3 | $60B |
|
||
| Utilities | 3 | $41B |
|
||
| Healthcare | 2 | $330B |
|
||
Price history
-40.4% since first listed12 events — show timeline
- 2026-06-02 Price Changed $149,000 NTREIS
- 2026-05-12 Listed $159,900 NTREIS
- 2025-01-31 Listing Removed — NTREIS
- 2024-10-31 Price Changed $169,999 NTREIS
- 2024-09-14 Price Changed $179,999 NTREIS
- 2024-09-03 Price Changed $180,000 NTREIS
- 2024-08-29 Price Changed $183,000 NTREIS
- 2024-08-24 Listed $185,000 NTREIS
- 2024-06-25 Listing Removed — NTREIS
- 2023-09-17 Price Changed $235,000 NTREIS
- 2023-06-26 Listed $250,000 NTREIS
- 1994-09-08 Sold (Public Records) — Public Records
Property tax history
+7.9%/yrLatest (2025): $3,314 · +8.1% YoY. Source: county tax records.
Cash-flow waterfall
monthlySold comps — $/sqft
last 12 mo · ≤1 miLoading sold comps…