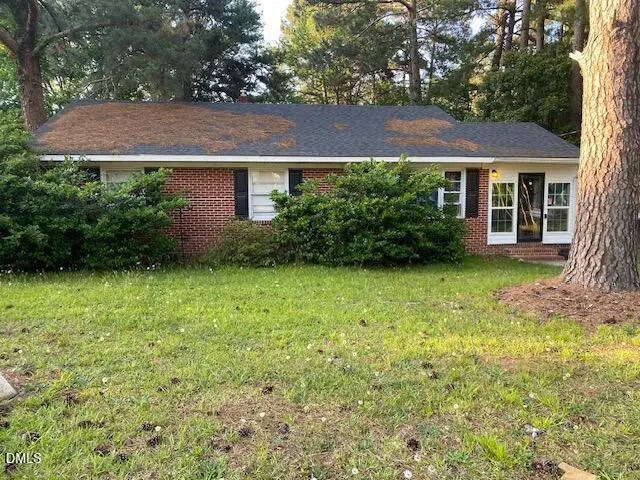
1104 Robert Rd W · Wilson, NC
Flood risk 8/10 · Major
- FEMA flood zone
- X (unshaded)
- Chance of flooding over 30 yrs
- 0.99%
- Est. flood insurance / yr
- $507 – $1,088
Fire risk 1/10 · Minimal
- Est. fire insurance / yr
- $906 – $1,684
Heat risk 7/10 · Major
- Hot days now (above 107°F)
- 7 days/yr
- Hot days in 30 yrs
- 16 days/yr
Wind risk 7/10 · Major
- Chance of severe wind over 30 yrs
- 78.0%
Air-quality risk 2/10 · Minimal
- Unhealthy air days now
- 2 days/yr
- Unhealthy air days in 30 yrs
- 2 days/yr
Risk factors via First Street. Map © Google.
Why this score? — see what drove the C- grade
The composite is a weighted blend of 9 inputs, each scored 0–100. Each bar is that input's sub-score; the figure is the points it added to the 100-point composite (weight × sub-score).
- Cash flow +15.5/30.0
- ARV discount +14.2/15.0
- DSCR +4.8/10.0
- Rent growth +4.3/5.0
- 1% rule +3.7/10.0
- Schools +3.3/10.0
- Livability +3.2/5.0
- Condition / age +2.5/5.0
- Appreciation +0.0/10.0
$160,000
🖨 Deal sheet 📄 Offer letter ✓ Due diligence
Listing remarks MLS
Brick ranch with 3 Bedrooms and 1 Full Bath on nice lot. Enclosed Porch leads to large Living Room and Dining Area. Roomy Kitchen with ample storage steps to large back yard.
Key facts
- New washer and dryer
- Updated kitchen
- Fenced backyard
Tags
Property features AI
Finance
- Other: Property located in Wilson County; Publicly maintained road access
- HOA & community: No association
Exterior
- Utilities: Public water; Public sewer
- Home design: Single-story house; Site-built construction
- Construction: Brick veneer construction; Shingle roof; One-level structure
- Exterior features: Shingle roof; Brick veneer exterior; Lot of about 0.32 acres
Interior
- Bedrooms: 3 bedrooms (all on the main level)
- Flooring: Laminate
- Bathrooms: 1 full bathroom
- Heating & cooling: Heat pump for heating; Heat pump for cooling
- Interior features: Laminate flooring
Neighborhood map
What this means for you Summary
Snapshot
- This is a 3-bed/1.0-bath single-family listed at $160k.
Deal economics
- At list price, monthly cash flow is $-3 ($-31/yr) — negative.
- To cash-flow at today's rent, offer at most $160k (0.3% below list).
- To meet the 1% rule (rent ≥ 1% of price), the offer needs to be $139k (13.2% below list).
- Recommended offer: $139k (13.2% below list) — sets the bar for 1% rule.
- Cap rate 6.8% vs local median 3.4% in Wilson — top-decile yield for the area; either an underpriced asset or a hidden risk that comps aren't pricing in. Stress-test before assuming the spread holds.
Location & tenants
- Location reads 64/100 on livability (#374 in NC) — a middle-class / working-renter tenant base. Strengths: cost of living A+, housing A+, health & safety A; Watch: crime F, amenities F, commute F.
- Wilson County Schools (rural): math 38% / reading 40% proficiency, ranked #119 of 178 in NC (top 67%) — families likely to look elsewhere, expect single-tenant / working-renter base with shorter leases.
- Zoned schools: Vinson-Bynum Elementary (math 32% / reading 37%, grade F, #835 of 1,410 statewide, top 62%, 473 students, 99% FRL); Forest Hills Middle (math 32% / reading 38%, grade F, #286 of 475 statewide, top 61%, 670 students, 99% FRL); James Hunt High (math 67% / reading 58%, grade B-, #179 of 535 statewide, top 34%, 1,069 students, 60% FRL) — zoned schools average 86% FRL vs 58% district-wide (28 pts higher); higher-poverty schools than district average — tighter screening recommended.
- Market conditions: Rents rising fast (+7.0%/yr); 261 active listings in the ZIP; lower-income renter base — watch delinquency; 580 units permitted in Wilson County in 2024 (168 in 5+ unit buildings).
- This rent runs 39% of the median local income ($43k/yr) — at the standard rent-burdened threshold; future hikes will face affordability resistance.
Forward outlook
- Local home prices are declining (-3.0%/yr); year-one equity from $1k of loan paydown is wiped out by about $5k of value loss. Plan a longer hold.
- Wilson County population projected to shrink 5% by 2050 — rents likely to lag national; underwrite the cash flow, not the appreciation.
Negotiation context
- It's been on market 21 days — a 2% lower offer ($158k) is reasonable based on typical stale-listing flexibility.
- 2 sale attempts since 5y ago with the ask held roughly flat each time — persistent listings suggest the price (not the market) is what's stuck; bring a comps-based counter.
- Current owner paid $122k; 31% above their basis — modest negotiation headroom, anchor on the comps not their cost.
Risks & watch-outs
- Watch-outs: flood insurance adds $66/mo; built in 1955 — expect roof / HVAC / electrical / plumbing capex.
- Climate carrying-cost: severe flood risk; major wind risk, 78% chance of damaging wind over 30y; extreme-heat days projected 7→16/yr by 2055 (HVAC capex compounding) — expect insurance premiums to compound above CPI over the hold.
Questions for the listing agent
- What do current leases actually rent for vs. the listed asking? Can we see a recent rent roll and the last 12 months of T-12 income?
- Built in 1955 — when were the roof, HVAC, electrical panel, plumbing, and water heater last replaced?
- What's the actual annual flood-insurance premium (NFIP or private), and is the property in a SFHA with mandatory coverage?
- Is there a deadline driving the sale (1031 exchange, divorce, estate, relocation)? That informs how much negotiation room exists.
- Schools are F-rated, which usually means shorter tenancies and higher turnover. Who's the typical renter profile here, and what's been the actual vacancy rate?
- Crime grade is F in this area — have there been break-ins, vandalism, or insurance claims at this property in the last 3 years? What carrier currently insures it and at what premium?
- What's the average days-on-market for RENTAL listings here right now (not sales)? A rising rental-DOM trend means longer vacancies and softer asking-rent achievability than the comps imply.
- What's the recent tenant-quality profile in this submarket — average credit score on applications, eviction rate, late-payment / NSF rate, and stable-employment percentage? A property-management company in the area should have these aggregated.
- How much new for-sale + rental construction is in the pipeline within 1–3 miles? Heavy new supply typically softens prices + rents 12–24 months out; constrained supply supports both.
Investment metrics
- 1% rule
- 0.87% ✗
- Cap rate
- 6.77%
- Cash-on-cash
- 1.71%
- DSCR
- 1.08
- GRM
- 9.6
CMA / ARV
- ARV (on-the-fly)
- $187,862
- Comps found
- 12
Show comp detail 12 sales within ~0.75 mi
| Address | Dist | Beds/Ba | Sqft | Sold | Price | $/sf | Match |
|---|---|---|---|---|---|---|---|
| 1403 Westwood Ave W | 0.27mi | 3/1.0 | 1,200 (+1%) | 1mo | $138,500 | $115 | 85 |
| 304 Lillian Rd W | 0.15mi | 3/1.0 | 1,148 (-3%) | 13mo | $181,500 | $158 | 76 |
| 908 Anthony St W | 0.34mi | 3/1.5 | 1,146 (-4%) | 8mo | $195,000 | $170 | 69 |
| 1305 Westwood Ave W | 0.22mi | 3/1.5 | 1,250 (+5%) | 13mo | $197,000 | $158 | 68 |
| 1108 Robert Rd W | 0.03mi | 2/1.0 (-1) | 1,045 (-12%) | 6mo | $124,000 | $119 | 68 |
| 200 Forrest Rd W | 0.42mi | 3/1.5 | 1,240 (+4%) | 5mo | $145,000 | $117 | 67 |
| 106 Thurston Dr W | 0.31mi | 3/1.0 | 1,070 (-10%) | 8mo | $184,000 | $172 | 63 |
| 608 Hawthorne Ln W | 0.39mi | 3/2.0 | 1,274 (+7%) | 14mo | $225,000 | $177 | 54 |
| 318 Jefferson St W | 0.27mi | 3/1.0 | 1,014 (-15%) | 14mo | $135,800 | $134 | 51 |
| 406 Hawthorne Ln W | 0.39mi | 3/2.0 | 1,362 (+15%) | 4mo | $198,300 | $146 | 50 |
| 606 Hawthorne Ln W | 0.38mi | 2/2.0 (-1) | 1,341 (+13%) | 8mo | $215,000 | $160 | 46 |
| 609 Hines St W | 0.67mi | 4/2.0 (+1) | 1,152 (-3%) | 12mo | $189,900 | $165 | 45 |
Match score weights: distance 35% · size 25% · config 20% · recency 20%. Top-matched comps best support the ARV.
Projected returns pro-forma
-3.0% appreciation · 7.01% rent growth · sell at horizon
- IRR
- -12.0%
- Equity multiple
- 0.55×
- Total profit
- $-20,247
- Equity at exit
- $23,857
- IRR
- 2.2%
- Equity multiple
- 1.18×
- Total profit
- $8,203
- Equity at exit
- $13,834
Cash invested: $44,800 (down + closing). Projections, not guarantees.
Landlord ↔ Tenant lean methodology
- Overall (STATE)
- 85 Strongly Landlord-Friendly
- State North Carolina
- 85 Strongly Landlord-Friendly · R+3
- County
- — inherits STATE
- City
- — inherits STATE
ZIP-level market 27893
- Rents YoY
- 7.0%
- Active inventory
- 261
- Price-to-rent
- 9.6×
Monthly cashflow live
- Estimated rent
- $1,388 medium interval (Pro) →
- Mortgage (P&I)
- −$839
- Tax from tax record
- −$127 /mo · $1,528/yr
- Insurance
- −$67
- Flood insurance flood zone
- −$66 /mo · $798/yr
- HOA
- −$0
- Vacancy / Maint / Mgmt
- −$292
- Net cashflow
- $-3
Break-even live
UW: 25.0% down · 7.5% · 30yr · 1.5% tax · 5.0% vac · 8.0% maint · 8.0% mgmt
Financing live
Cash to close
- Down payment
- $40,000
- Closing costs
- $4,800
- Reserves months
- —
- Total cash needed
- —
Loan-product check · same deal, 3 products live
Conventional
25% down · 7.5% · 30yr
- Down + closing
- —
- Monthly P&I
- —
- Monthly cashflow
- —
- DSCR
- —
- Eligible?
- —
Personal DTI + credit; lowest rate.
DSCR
20% down · 8.5% · 30yr
- Down + closing
- —
- Monthly P&I
- —
- Monthly cashflow
- —
- DSCR
- —
- Eligible?
- —
No personal income docs; deal must DSCR.
Hard money
10% down · 12.0% · 12mo
- Down + closing
- —
- Monthly P&I
- —
- Monthly cashflow
- —
- DSCR
- —
- Eligible?
- —
Short-term bridge; refi at stabilization.
Listing history 20 events
-
2026-06-19days on market $160,000 Active 21 DOM
-
2026-06-18days on market $160,000 Active 20 DOM
-
2026-06-17days on market $160,000 Active 19 DOM
-
2026-06-16days on market $160,000 Active 18 DOM
-
2026-06-15days on market $160,000 Active 17 DOM
-
2026-06-14days on market $160,000 Active 15 DOM
-
2026-06-13days on market $160,000 Active 14 DOM
-
2026-06-10days on market $160,000 Active 12 DOM
-
2026-06-09days on market $160,000 Active 11 DOM
-
2026-06-08days on market $160,000 Active 10 DOM
-
2026-06-07days on market $160,000 Active 9 DOM
-
2026-06-05days on market $160,000 Active 6 DOM
-
2026-06-03days on market $160,000 Active 5 DOM
-
2026-06-02days on market $160,000 Active 4 DOM
-
2026-06-01days on market $160,000 Active 3 DOM
-
2026-05-31days on market $160,000 Active 2 DOM
-
2026-05-29$160,000 Active
-
2021-10-05soldstatus $122,000 174-char remark
Show marketing remark (174 chars)
Brick ranch with 3 Bedrooms and 1 Full Bath on nice lot. Enclosed Porch leads to large Living Room and Dining Area. Roomy Kitchen with ample storage steps to large back yard.
-
2021-10-05soldstatus $122,000
Show marketing remark (174 chars)
Brick ranch with 3 Bedrooms and 1 Full Bath on nice lot. Enclosed Porch leads to large Living Room and Dining Area. Roomy Kitchen with ample storage steps to large back yard.
-
2021-08-13$99,900 174-char remark
Show marketing remark (174 chars)
Brick ranch with 3 Bedrooms and 1 Full Bath on nice lot. Enclosed Porch leads to large Living Room and Dining Area. Roomy Kitchen with ample storage steps to large back yard.
ⓘ Source: listings_history table (triggers on properties + properties_extension) + one-shot
backfill from property_details.listing_events for pre-trigger history.
Tax reassessment forecast NC · Resets to sale price
- Current annual tax
- $1,528 · $127/mo
- Projected year-2 tax
- $1,528 · $127/mo
- Expected delta
- $0/yr ($0/mo · 0.0%)
ⓘ Screening estimate from a state-policy table — verify with the county assessor before closing.
Climate risk First Street
- Flood 8/10 Severe FEMA zone X (unshaded) · 99% chance over 30 yrs
- Wildfire 1/10 Low
- Heat 7/10 Severe 7 d/yr ≥107°F today · 16 d/yr by 30 yrs out
- Wind 7/10 Severe 78% chance of damaging wind over 30 yrs
- Air quality 2/10 Low 2 unhealthy d/yr today · 2 by 30 yrs out
Nearby sold comps map
Loading sold comps map…
Walkable amenities ~0.75 mi
Loading nearby amenities…
Taxation est. · year 1
- Rental income
- $16,662
- − Mortgage interest
- −$8,962
- − Property taxes
- −$1,528
- − Insurance
- −$1,598
- − Repairs & maintenance
- −$1,333
- − Management
- −$1,333
- − Depreciation
- −$4,655
- Taxable loss
- −$2,746
- Est. tax savings @ 24.0%
- +$659
- After-tax cash flow
- $628/yr
For passive investors: Depreciation is non-cash, so a rental often shows a tax loss while cash-flowing — sheltering income. Rental losses are passive: they offset passive income freely, and up to $25,000/yr can offset ordinary (W-2) income if you actively participate and your MAGI is under $100k (phasing out to $0 by $150k); unused losses carry forward. On sale, claimed depreciation is recaptured at up to 25%, and gains may owe capital-gains tax (a 1031 exchange can defer both). Figures are a year-1 estimate at your 24.0% rate — not tax advice; consult a CPA.
Schools (NCES district)
- District
- Wilson County Schools
- NCES district ID
- 3705020
- Math proficiency
- 38% ▲ 2.00%
- Reading proficiency
- 40% ▼ -1.00%
- Median HH income
- $39,342
- Composite
- 32.64/100
- National rank
- #5665
- State rank
- #119 of 178 in NC
Livability — Wilson
- Score
- 64/100
- State rank
- #374
- US rank
- #14674
Category grades
Schools grade is shown separately in the Schools card above.
Census & demographics
- Census place
- Wilson, NC
- County
- Wilson County · 57,967 people
- City population
- 57,967
- Metro
- Wilson, NC
- Population (ZIP)
- 38,512
- Household income
- $42,810
- Rent vs Own
- Severe rent burden
- 2175.0
Population outlook (Wilson County) Hauer SSP2
- Today (2025)
- 82,765 people
- By 2030
- 82,492 · -0.3%
- By 2040
- 81,054 · -2.1%
- By 2050
- 78,610 · -5.0%
- By 2075
- 71,865 · -13.2%
- By 2100
- 62,792 · -24.1%
Race, ethnicity, and origin ACS 2023
- Neighborhood character
- Diverse neighborhood (Simpson 0.61)
- Race & ethnicity
- Black 55% White 27% Hispanic / Latino 16% Two or more races 5%
- Hispanic origin (detail)
- Mexican 13%
- Common ancestry
- Serbian 1% Slovak 1% Lithuanian 1%
- Foreign-born
- 6% · Canada, Jamaica
- Languages at home
- 86% English-only · Spanish 13%
Political lean MEDSL · Wilson
- 2024 margin
- Toss-up / Even · D 49.8% · R 49.4%
- 2008→2024 swing
- -5.7pp toward R · 2008: 6.1pp · 2024: 0.4pp
- All cycles
- 2024: D+0.4 2020: D+2.9 2016: D+5.6 2012: D+7.3 2008: D+6.1
Not yet ingested
- Civics
- —
Market trends
- HPI YoY
- ▼ -149.54%
- Current HPI
- 211.4136
- Rent YoY
- ▲ 7.01%
- Metro
- Wilson, NC
- State GDP YoY
- ▲ 3.28%
- F500 in state
- 26
Industry mix (Fortune 500 HQ in NC)
| Industry | F500 HQs | Revenue |
|---|---|---|
| Financial Services | 2 | $213B |
|
||
| Retail | 2 | $95B |
|
||
| Industrial Conglomerate | 1 | $38B |
|
||
| Metals / Steel | 1 | $35B |
|
||
| Utilities | 1 | $30B |
|
||
| Industrial Machinery | 1 | $19B |
|
||
Price history
+60.2% since first listed4 events — show timeline
- 2026-05-29 Listed $160,000 TMLS
- 2021-10-05 Sold (Public Records) $122,000 Public Records
- 2021-10-05 Sold (MLS) $122,000 Hive MLS
- 2021-08-13 Listed $99,900 Hive MLS
Property tax history
+4.8%/yrLatest (2025): $1,528 · +0.0% YoY. Source: county tax records.
Cash-flow waterfall
monthlySold comps — $/sqft
last 12 mo · ≤1 miLoading sold comps…