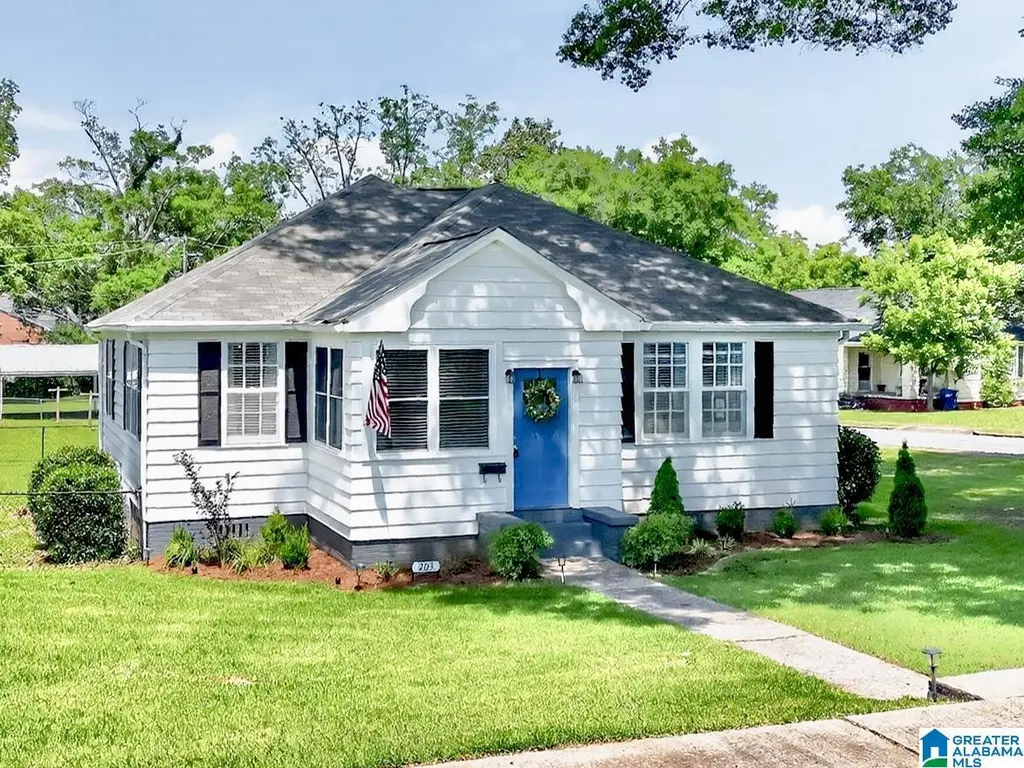
203 Judson St · Talladega, AL
Flood risk 1/10 · Minimal
- FEMA flood zone
- X (unshaded)
- Chance of flooding over 30 yrs
- 0.0%
- Est. flood insurance / yr
- $507 – $1,088
Fire risk 7/10 · Major
- Est. fire insurance / yr
- $916 – $1,700
Heat risk 7/10 · Major
- Hot days now (above 108°F)
- 7 days/yr
- Hot days in 30 yrs
- 20 days/yr
Wind risk 6/10 · Moderate
- Chance of severe wind over 30 yrs
- 27.0%
Air-quality risk 2/10 · Minimal
- Unhealthy air days now
- 1 days/yr
- Unhealthy air days in 30 yrs
- 1 days/yr
Risk factors via First Street. Map © Google.
Why this score? — see what drove the F grade
The composite is a weighted blend of 9 inputs, each scored 0–100. Each bar is that input's sub-score; the figure is the points it added to the 100-point composite (weight × sub-score).
- Cash flow +16.4/30.0
- DSCR +5.1/10.0
- 1% rule +3.1/10.0
- Livability +3.0/5.0
- Rent growth +2.5/5.0
- Condition / age +2.5/5.0
- Schools +1.3/10.0
- ARV discount +0.0/15.0
- Appreciation +0.0/10.0
$155,900
🖨 Deal sheet 📄 Offer letter ✓ Due diligence
Listing remarks MLS
This beautiful cottage style completely remodeled home is move-in ready. This home has 2 bedrooms, 2 full baths, new paint, dining room, all hardwood floors, den, kitchen with new tile floors, new cabinets and appliances, enclosed front porch that can be used as a sunroom, laundry room, detached 2 car garage. Please call for your private viewing.
Key facts
- Half basement
- Modern kitchen
- Hardwood floors
Tags
Property features AI
Finance
- Other: Garbage fee amount listed as $50 monthly
- HOA & community: Garbage fee applies monthly
Exterior
- Parking: Detached garage; Two total garage spaces (both on main level); Driveway parking
- Utilities: Public water; Connected sewer; Electric water heater; Underground utilities; Internet service available
- Home design: Single-family property (existing construction); Entry/Garage located on the side; Not a tri-level, split-level, loft, or split foyer
- Construction: Siding (other) exterior; Crawl space foundation; Year built listed as existing (no specific year provided)
- Exterior features: Storage building; Workshop; Some trees on the lot; No pool, deck, patio, or garden/patio listed; Not waterfront
Interior
- Kitchen: Built-in dishwasher; Electric oven; Electric stove; Solid surface countertops; Eating area
- Bedrooms: Master bedroom on main level; Additional bedroom on main level; All bedrooms located on the main level
- Flooring: Hardwood floors; Tile floors
- Bathrooms: Two full bathrooms; Separate shower; Combination tub/shower; Shared bath; Linen closet
- Heating & cooling: Central heating (electric); Central cooling (electric)
- Interior features: 9 ft. + ceilings; Some window treatments to remain; Solid surface kitchen countertops; Eating area in the kitchen; No additional built-in interior features listed
- Laundry & utility: Laundry room on the main level; Washer hookup; Electric dryer hookup; Pull-down attic access
Neighborhood map
What this means for you Summary
Snapshot
- This is a 2-bed/2.0-bath single-family listed at $156k.
Deal economics
- At list price, monthly cash flow is $90 ($1k/yr) — positive.
- The deal already cash-flows at list — no discount required.
- To meet the 1% rule (rent ≥ 1% of price), the offer needs to be $127k (18.6% below list).
- Recommended offer: $127k (18.6% below list) — sets the bar for 1% rule.
- Cap rate 7.0% vs local median 4.8% in Talladega — top-decile yield for the area; either an underpriced asset or a hidden risk that comps aren't pricing in. Stress-test before assuming the spread holds.
Location & tenants
- Location reads 59/100 on livability (#327 in AL) — a working-class tenant base; expect higher turnover. Strengths: cost of living A+, housing A, health & safety A-; Watch: crime F, amenities F, commute F.
- Talladega City (rural): math 7% / reading 25% proficiency, ranked #114 of 129 in AL (top 88%) — low school quality limits family demand, transient renter base, plan for 1-2y turnover; 74% free/reduced lunch — lower-income household profile, screen leases tightly.
- Zoned schools: Talladega High School (math 2% / reading 2%, grade F, #291 of 305 statewide, top 100%, 446 students, 84% FRL).
- Zoned-school proficiency averages 2% at this address vs 16% district-wide (-14 pts) — the specific schools serving this property underperform the Talladega City average; the district grade overstates school quality for this exact location.
- Market conditions: 170 active listings in the ZIP; 4 comparable units currently listed for rent nearby; rentals lingering (median 44d on market — plan ~5-8 weeks vacancy on turnover, expect pricing pressure); 100% of comp listings sitting > 30 days — soft ceiling on asking rent; 189 units permitted in Talladega County in 2024 (6 in 5+ unit buildings).
Forward outlook
- Local home prices are declining (-3.0%/yr); year-one equity from $1k of loan paydown is wiped out by about $5k of value loss. Plan a longer hold.
- Talladega County population projected at -14% by 2050 — secular population decline; favor cash flow + early exit over multi-decade hold.
Negotiation context
- Only 11 days on market — expect competitive offers; lowballing is unlikely to land.
- 4 sale attempts since 3y ago with the ask held roughly flat each time — persistent listings suggest the price (not the market) is what's stuck; bring a comps-based counter.
Risks & watch-outs
- Watch-outs: built in 1956 — expect roof / HVAC / electrical / plumbing capex.
- Climate carrying-cost: major wind risk, 27% chance of damaging wind over 30y; major wildfire risk; extreme-heat days projected 7→20/yr by 2055 (HVAC capex compounding) — expect insurance premiums to compound above CPI over the hold.
Questions for the listing agent
- Built in 1956 — when were the roof, HVAC, electrical panel, plumbing, and water heater last replaced?
- Is there a deadline driving the sale (1031 exchange, divorce, estate, relocation)? That informs how much negotiation room exists.
- Schools are F-rated, which usually means shorter tenancies and higher turnover. Who's the typical renter profile here, and what's been the actual vacancy rate?
- Crime grade is F in this area — have there been break-ins, vandalism, or insurance claims at this property in the last 3 years? What carrier currently insures it and at what premium?
- The area grade is low — what's the realistic commute time and amenity access for the typical tenant pool here? Any planned neighborhood developments (good or bad) we should know about?
- What's the average days-on-market for RENTAL listings here right now (not sales)? A rising rental-DOM trend means longer vacancies and softer asking-rent achievability than the comps imply.
- What's the recent tenant-quality profile in this submarket — average credit score on applications, eviction rate, late-payment / NSF rate, and stable-employment percentage? A property-management company in the area should have these aggregated.
- How much new for-sale + rental construction is in the pipeline within 1–3 miles? Heavy new supply typically softens prices + rents 12–24 months out; constrained supply supports both.
Investment metrics
- 1% rule
- 0.81% ✗
- Cap rate
- 6.98%
- Cash-on-cash
- 2.47%
- DSCR
- 1.11
- GRM
- 10.2
CMA / ARV
- ARV (on-the-fly)
- $110,782
- Comps found
- 5
Show comp detail 5 sales within ~0.75 mi
| Address | Dist | Beds/Ba | Sqft | Sold | Price | $/sf | Match |
|---|---|---|---|---|---|---|---|
| 203 E Damon Ave | 0.10mi | 2/2.0 | 1,544 (+14%) | 9mo | $144,500 | $94 | 64 |
| 407 East Damon Ave | 0.31mi | 2/2.0 | 1,214 (-10%) | 10mo | $92,500 | $76 | 60 |
| 302 Charles St | 0.18mi | 3/1.0 (+1) | 1,524 (+13%) | 2mo | $124,900 | $82 | 59 |
| 405 Talladega Ave | 0.28mi | 2/1.5 | 1,198 (-11%) | 12mo | $58,000 | $48 | 56 |
| 416 Wells Ave | 0.37mi | 3/2.0 (+1) | 1,236 (-8%) | 13mo | $178,000 | $144 | 53 |
Match score weights: distance 35% · size 25% · config 20% · recency 20%. Top-matched comps best support the ARV.
Projected returns pro-forma
-3.0% appreciation · 3.0% rent growth · sell at horizon
- IRR
- -12.5%
- Equity multiple
- 0.55×
- Total profit
- $-19,624
- Equity at exit
- $23,245
- IRR
- -3.5%
- Equity multiple
- 0.77×
- Total profit
- $-10,054
- Equity at exit
- $13,479
Cash invested: $43,652 (down + closing). Projections, not guarantees.
Landlord ↔ Tenant lean methodology
- Overall (STATE)
- 90 Strongly Landlord-Friendly
- State Alabama
- 90 Strongly Landlord-Friendly · R+15
- County
- — inherits STATE
- City
- — inherits STATE
ZIP-level market 35160
- Home prices YoY
- -26.9%
- Active inventory
- 170
- Price-to-rent
- 10.2×
Monthly cashflow live
- Estimated rent
- $1,269 medium interval (Pro) →
- Mortgage (P&I)
- −$818
- Tax from tax record
- −$30 /mo · $363/yr
- Insurance
- −$65
- HOA
- −$0
- Vacancy / Maint / Mgmt
- −$267
- Net cashflow
- $90
Break-even live
UW: 25.0% down · 7.5% · 30yr · 1.5% tax · 5.0% vac · 8.0% maint · 8.0% mgmt
Financing live
Cash to close
- Down payment
- $38,975
- Closing costs
- $4,677
- Reserves months
- —
- Total cash needed
- —
Loan-product check · same deal, 3 products live
Conventional
25% down · 7.5% · 30yr
- Down + closing
- —
- Monthly P&I
- —
- Monthly cashflow
- —
- DSCR
- —
- Eligible?
- —
Personal DTI + credit; lowest rate.
DSCR
20% down · 8.5% · 30yr
- Down + closing
- —
- Monthly P&I
- —
- Monthly cashflow
- —
- DSCR
- —
- Eligible?
- —
No personal income docs; deal must DSCR.
Hard money
10% down · 12.0% · 12mo
- Down + closing
- —
- Monthly P&I
- —
- Monthly cashflow
- —
- DSCR
- —
- Eligible?
- —
Short-term bridge; refi at stabilization.
Rent comps 4 comps
| Address | Beds | Baths | Sqft | Rent | $/sqft | DOM | Units | Dist |
|---|---|---|---|---|---|---|---|---|
| 2795 Allison Mill Rd Talladega, AL | 3.0 | 2.0 | 1006 | $1,275 | $1.27 | 43d | 1 | 0.88mi |
| 350 Sunlight Cir Talladega, AL | 3.0 | 2.0 | 1006 | $1,275 | $1.27 | 43d | 1 | 0.91mi |
| 37 Sunlight Cir Talladega, AL | 3.0 | 2.0 | 1006 | $1,275 | $1.27 | 43d | 1 | 0.99mi |
| 145 Sunlight Cir Talladega, AL | 3.0 | 2.0 | 1006 | $1,250 | $1.24 | 43d | 1 | 1.00mi |
Listing history 9 events
-
2026-06-19days on market $155,900 Active 11 DOM
-
2026-06-18days on market $155,900 Active 10 DOM
-
2026-06-17days on market $155,900 Active 9 DOM
-
2026-06-16days on market $155,900 Active 8 DOM
-
2026-06-15days on market $155,900 Active 7 DOM
-
2026-06-14days on market $155,900 Active 5 DOM
-
2026-06-12days on market $155,900 Active 4 DOM
-
2026-06-09remarks 693-char remark
-
2026-06-09$155,900 Active 1 DOM
ⓘ Source: listings_history table (triggers on properties + properties_extension) + one-shot
backfill from property_details.listing_events for pre-trigger history.
Tax reassessment forecast AL · Resets to sale price
- Current annual tax
- $363 · $30/mo
- Projected year-2 tax
- $639 · $53/mo
- Expected delta
- +$276/yr (+$23/mo · 76.0%)
ⓘ Screening estimate from a state-policy table — verify with the county assessor before closing.
Climate risk First Street
- Flood 1/10 Low FEMA zone X (unshaded) · 0% chance over 30 yrs
- Wildfire 7/10 Severe
- Heat 7/10 Severe 7 d/yr ≥108°F today · 20 d/yr by 30 yrs out
- Wind 6/10 Major 27% chance of damaging wind over 30 yrs
- Air quality 2/10 Low 1 unhealthy d/yr today · 1 by 30 yrs out
Nearby sold comps map
Loading sold comps map…
Walkable amenities ~0.75 mi
Loading nearby amenities…
Taxation est. · year 1
- Rental income
- $15,229
- − Mortgage interest
- −$8,733
- − Property taxes
- −$363
- − Insurance
- −$780
- − Repairs & maintenance
- −$1,218
- − Management
- −$1,218
- − Depreciation
- −$4,535
- Taxable loss
- −$1,618
- Est. tax savings @ 24.0%
- +$388
- After-tax cash flow
- $1,466/yr
For passive investors: Depreciation is non-cash, so a rental often shows a tax loss while cash-flowing — sheltering income. Rental losses are passive: they offset passive income freely, and up to $25,000/yr can offset ordinary (W-2) income if you actively participate and your MAGI is under $100k (phasing out to $0 by $150k); unused losses carry forward. On sale, claimed depreciation is recaptured at up to 25%, and gains may owe capital-gains tax (a 1031 exchange can defer both). Figures are a year-1 estimate at your 24.0% rate — not tax advice; consult a CPA.
Schools (NCES district)
- District
- Talladega City
- NCES district ID
- 0103150
- Math proficiency
- 7% ▼ -19.00%
- Reading proficiency
- 25% ▼ -4.00%
- Median HH income
- $30,107
- Composite
- 12.63/100
- National rank
- #9610
- State rank
- #114 of 129 in AL
Livability — Talladega
- Score
- 59/100
- State rank
- #327
- US rank
- #19965
Category grades
Schools grade is shown separately in the Schools card above.
Census & demographics
- Census place
- Talladega, AL
- Population (ZIP)
- 26,177
Population outlook (Talladega County) Hauer SSP2
- Today (2025)
- 78,905 people
- By 2030
- 77,160 · -2.2%
- By 2040
- 72,937 · -7.6%
- By 2050
- 68,279 · -13.5%
- By 2075
- 57,884 · -26.6%
- By 2100
- 47,220 · -40.2%
Race, ethnicity, and origin ACS 2023
- Neighborhood character
- Diverse neighborhood (Simpson 0.57)
- Race & ethnicity
- White 49% Black 43% Two or more races 4% Hispanic / Latino 3%
- Common ancestry
- Slovak 2% Italian 1% Iranian 1%
- Foreign-born
- 2% · Canada
- Languages at home
- 96% English-only · Spanish 3%
Political lean MEDSL · Talladega
- 2024 margin
- Solid R (+33.8) · D 32.9% · R 66.6%
- 2008→2024 swing
- -15.3pp toward R · 2008: -18.5pp · 2024: -33.8pp
- All cycles
- 2024: R+33.8 2020: R+25.5 2016: R+25.6 2012: R+16.0 2008: R+18.5
Not yet ingested
- Civics
- —
Market trends
- HPI YoY
- ▼ -70.24%
- Current HPI
- 190.5904
- Rent YoY
- —
- Metro
- —
- State GDP YoY
- ▲ 2.94%
- F500 in state
- 4
Industry mix (Fortune 500 HQ in AL)
| Industry | F500 HQs | Revenue |
|---|---|---|
| Financial Services | 1 | $8B |
|
||
| Healthcare | 1 | $5B |
|
||
Price history
+0.6% since first listed11 events — show timeline
- 2026-06-08 Listed $155,900 Greater Alabama MLS
- 2023-08-29 Sold (Public Records) $140,000 Public Records
- 2023-08-25 Sold (MLS) $140,000 Greater Alabama MLS
- 2023-08-15 Contingent — Greater Alabama MLS
- 2023-08-07 Relisted — Greater Alabama MLS
- 2023-08-05 Contingent — Greater Alabama MLS
- 2023-07-20 Relisted — Greater Alabama MLS
- 2023-06-19 Contingent — Greater Alabama MLS
- 2023-06-02 Price Changed $145,000 Greater Alabama MLS
- 2023-05-19 Price Changed $150,000 Greater Alabama MLS
- 2023-04-05 Listed $155,000 Greater Alabama MLS
Property tax history
-3.8%/yrLatest (2025): $363 · +0.0% YoY. Source: county tax records.
Cash-flow waterfall
monthlySold comps — $/sqft
last 12 mo · ≤1 miLoading sold comps…