 🏗️ New Construction
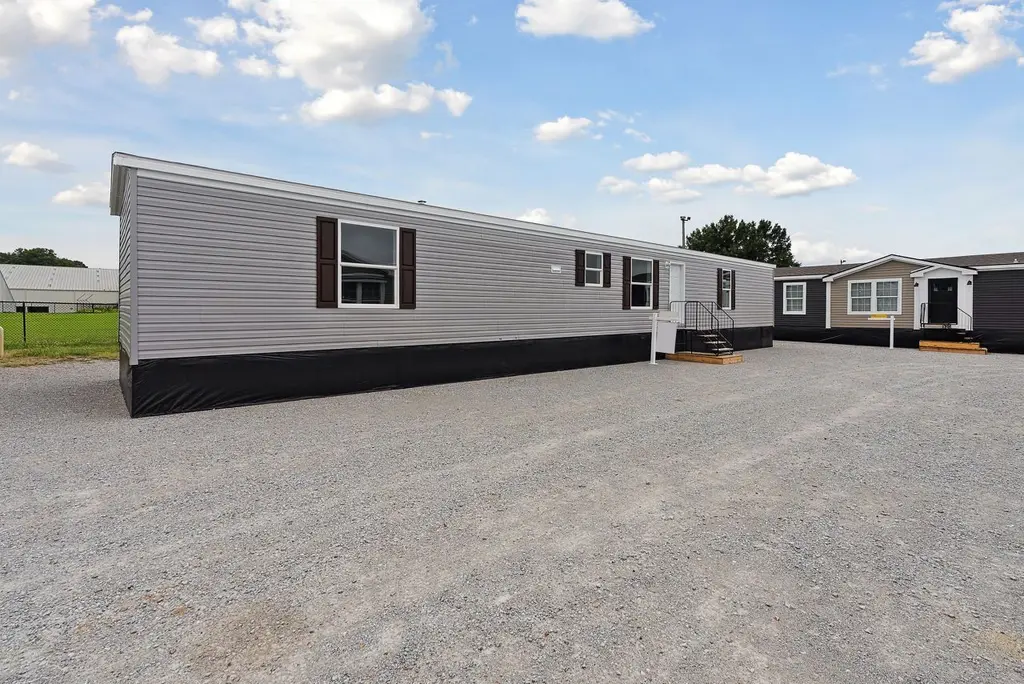
Belmont (Independence Hill) Plan · Morristown, TN
Flood risk 1/10 · Minimal
- FEMA flood zone
- X (unshaded)
- Chance of flooding over 30 yrs
- 0.0%
- Est. flood insurance / yr
- $473 – $860
Fire risk 3/10 · Minor
- Est. fire insurance / yr
- $949 – $1,763
Heat risk 5/10 · Moderate
- Hot days now (above 102°F)
- 7 days/yr
- Hot days in 30 yrs
- 20 days/yr
Wind risk 2/10 · Minimal
- Chance of severe wind over 30 yrs
- 0.0%
Air-quality risk 5/10 · Moderate
- Unhealthy air days now
- 8 days/yr
- Unhealthy air days in 30 yrs
- 9 days/yr
Risk factors via First Street. Map © Google.
Why this score? — see what drove the F grade
The composite is a weighted blend of 9 inputs, each scored 0–100. Each bar is that input's sub-score; the figure is the points it added to the 100-point composite (weight × sub-score).
- ARV discount +7.5/15.0
- Condition / age +5.0/5.0
- Livability +3.2/5.0
- Schools +2.6/10.0
- Rent growth +2.5/5.0
- 1% rule +2.3/10.0
- Cash flow +1.0/30.0
- DSCR +0.0/10.0
- Appreciation +0.0/10.0
$75,995
🖨 Deal sheet 📄 Offer letter ✓ Due diligence
Listing remarks MLS
The Belmont offers a smart, spacious layout designed for comfortable everyday living. This thoughtfully designed home features 3 bedrooms and 2 full baths, providing plenty of room for family and guests. At the heart of the home, you'll find a beautiful, well-appointed kitchen that flows seamlessly into an expansive living area with extended length-perfect for entertaining, relaxing, or creating flexible spaces to fit your lifestyle. With its open design and generous proportions, the Belmont delivers both functionality and style in a home that truly feels inviting.
Key facts
- Listed 123 days
Neighborhood map
What this means for you Summary
Snapshot
- This is a 3-bed/2.0-bath manufactured listed at $76k. Condition is rated excellent.
Deal economics
- At list price, monthly cash flow is $-862 ($-10k/yr) — negative.
- The deal already cash-flows at list — no discount required.
- Meets the 1% rule at list price ($2k rent vs $76k).
- Recommended offer: $67k (12.0% below list) — sets the bar for market timing.
- Cap rate 1.3% vs local median 2.9% in Morristown — below-typical yield; the buyer is paying a premium for something (appreciation thesis, condition, location) that the cap rate doesn't capture.
Location & tenants
- Location reads 64/100 on livability (#175 in TN) — a middle-class / working-renter tenant base. Strengths: cost of living A+, health & safety A+, housing A-; Watch: schools D-, crime F, amenities F.
- Hamblen County (urban): math 31% / reading 30% proficiency, ranked #57 of 139 in TN (top 41%) — families likely to look elsewhere, expect single-tenant / working-renter base with shorter leases.
- Market conditions: 330 active listings in the ZIP; 298 units permitted in Hamblen County in 2024 (48 in 5+ unit buildings).
- This rent runs 33% of the median local income ($56k/yr) — at the standard rent-burdened threshold; future hikes will face affordability resistance.
Forward outlook
- Local home prices are declining (-3.0%/yr); year-one equity from $1k of loan paydown is wiped out by about $6k of value loss. Plan a longer hold.
Negotiation context
- It's been on market 124 days — a 12% lower offer ($67k) is reasonable based on typical stale-listing flexibility.
Risks & watch-outs
- Watch-outs: property tax is 4.1% of price; HOA is 41% of rent.
- Climate carrying-cost: extreme-heat days projected 7→20/yr by 2055 (HVAC capex compounding) — expect insurance premiums to compound above CPI over the hold.
Questions for the listing agent
- What do current leases actually rent for vs. the listed asking? Can we see a recent rent roll and the last 12 months of T-12 income?
- It's been on market 124 days. Have you received any prior offers? Is the seller open to a 12% concession, seller financing, or rate buy-down credit?
- Property tax is high relative to price — has the assessment been appealed recently, and will the sale trigger a re-assessment?
- What does the HOA fee cover, when was the last increase, and are there any pending special assessments or reserve-fund shortfalls?
- Why hasn't it sold? Are there any deal-killer items the seller is aware of (foundation, flood, title, zoning, code violations)?
- Is there a deadline driving the sale (1031 exchange, divorce, estate, relocation)? That informs how much negotiation room exists.
- Schools are D-rated, which usually means shorter tenancies and higher turnover. Who's the typical renter profile here, and what's been the actual vacancy rate?
- Crime grade is F in this area — have there been break-ins, vandalism, or insurance claims at this property in the last 3 years? What carrier currently insures it and at what premium?
- The area grade is low — what's the realistic commute time and amenity access for the typical tenant pool here? Any planned neighborhood developments (good or bad) we should know about?
- What's the average days-on-market for RENTAL listings here right now (not sales)? A rising rental-DOM trend means longer vacancies and softer asking-rent achievability than the comps imply.
- What's the recent tenant-quality profile in this submarket — average credit score on applications, eviction rate, late-payment / NSF rate, and stable-employment percentage? A property-management company in the area should have these aggregated.
- How much new for-sale + rental construction is in the pipeline within 1–3 miles? Heavy new supply typically softens prices + rents 12–24 months out; constrained supply supports both.
Investment metrics
- 1% rule
- 0.73% ✗
- Cap rate
- 1.33%
- Cash-on-cash
- -17.74%
- DSCR
- 0.21
- GRM
- 11.4
CMA / ARV
- ARV (median comp)
- $208,219
- List price
- $75,995
- Delta
- -63.50%
- Verdict
- UNDERPRICED
- Comps
- 3 within 1.0 mi
Show comp detail 2 sales within ~0.75 mi
| Address | Dist | Beds/Ba | Sqft | Sold | Price | $/sf | Match |
|---|---|---|---|---|---|---|---|
| 2426 Buffalo Trail Trl | 0.47mi | 3/2.0 | 1,248 (+5%) | 11mo | $230,000 | $184 | 61 |
| 1003 De Vault St | 0.67mi | 3/2.0 | 1,120 (-6%) | 21mo | $214,000 | $191 | 41 |
Match score weights: distance 35% · size 25% · config 20% · recency 20%. Top-matched comps best support the ARV.
Projected returns pro-forma
-3.0% appreciation · 3.0% rent growth · sell at horizon
- IRR
- -51.3%
- Equity multiple
- -0.51×
- Total profit
- $-88,211
- Equity at exit
- $31,046
- IRR
- —
- Equity multiple
- -1.50×
- Total profit
- $-145,813
- Equity at exit
- $18,003
Cash invested: $58,301 (down + closing). Projections, not guarantees.
Landlord ↔ Tenant lean methodology
- Overall (STATE)
- 87 Strongly Landlord-Friendly
- State Tennessee
- 87 Strongly Landlord-Friendly · R+13
- County
- — inherits STATE
- City
- — inherits STATE
ZIP-level market 37814
- Home prices YoY
- -17.1%
- Active inventory
- 330
- Price-to-rent
- 4.1×
Monthly cashflow live
- Estimated rent
- $1,528 medium interval (Pro) →
- Mortgage (P&I)
- −$1,092
- Tax est. 1.5%
- −$260 /mo · $3,123/yr
- Insurance
- −$87
- HOA
- −$630
- Vacancy / Maint / Mgmt
- −$321
- Net cashflow
- $-862
Break-even live
UW: 25.0% down · 7.5% · 30yr · 1.5% tax · 5.0% vac · 8.0% maint · 8.0% mgmt
Financing live
Cash to close
- Down payment
- $52,055
- Closing costs
- $6,247
- Reserves months
- —
- Total cash needed
- —
Loan-product check · same deal, 3 products live
Conventional
25% down · 7.5% · 30yr
- Down + closing
- —
- Monthly P&I
- —
- Monthly cashflow
- —
- DSCR
- —
- Eligible?
- —
Personal DTI + credit; lowest rate.
DSCR
20% down · 8.5% · 30yr
- Down + closing
- —
- Monthly P&I
- —
- Monthly cashflow
- —
- DSCR
- —
- Eligible?
- —
No personal income docs; deal must DSCR.
Hard money
10% down · 12.0% · 12mo
- Down + closing
- —
- Monthly P&I
- —
- Monthly cashflow
- —
- DSCR
- —
- Eligible?
- —
Short-term bridge; refi at stabilization.
HOA detail
- Monthly dues
- $630 · $7,560/yr
Listing history 16 events
-
2026-06-19days on market $75,995 Active 124 DOM
-
2026-06-18days on market $75,995 Active 123 DOM
-
2026-06-17days on market $75,995 Active 122 DOM
-
2026-06-16days on market $75,995 Active 121 DOM
-
2026-06-15days on market $75,995 Active 120 DOM
-
2026-06-14days on market $75,995 Active 118 DOM
-
2026-06-12days on market $75,995 Active 117 DOM
-
2026-06-09days on market $75,995 Active 114 DOM
-
2026-06-08days on market $75,995 Active 113 DOM
-
2026-06-07days on market $75,995 Active 112 DOM
-
2026-06-05days on market $75,995 Active 109 DOM
-
2026-06-02days on market $75,995 Active 107 DOM
-
2026-06-01days on market $75,995 Active 106 DOM
-
2026-05-31days on market $75,995 Active 105 DOM
-
2026-05-30days on market $75,995 Active 104 DOM
-
2026-02-16$75,995 Active 571-char remark
Show marketing remark (571 chars)
The Belmont offers a smart, spacious layout designed for comfortable everyday living. This thoughtfully designed home features 3 bedrooms and 2 full baths, providing plenty of room for family and guests. At the heart of the home, you'll find a beautiful, well-appointed kitchen that flows seamlessly into an expansive living area with extended length-perfect for entertaining, relaxing, or creating flexible spaces to fit your lifestyle. With its open design and generous proportions, the Belmont delivers both functionality and style in a home that truly feels inviting.
ⓘ Source: listings_history table (triggers on properties + properties_extension) + one-shot
backfill from property_details.listing_events for pre-trigger history.
Climate risk First Street
- Flood 1/10 Low FEMA zone X (unshaded) · 0% chance over 30 yrs
- Wildfire 3/10 Moderate
- Heat 5/10 Major 7 d/yr ≥102°F today · 20 d/yr by 30 yrs out
- Wind 2/10 Low 0% chance of damaging wind over 30 yrs
- Air quality 5/10 Major 8 unhealthy d/yr today · 9 by 30 yrs out
Nearby sold comps map
Loading sold comps map…
Walkable amenities ~0.75 mi
Loading nearby amenities…
Taxation est. · year 1
- Rental income
- $18,338
- − Mortgage interest
- −$11,663
- − Property taxes
- −$3,123
- − Insurance
- −$1,041
- − Repairs & maintenance
- −$1,467
- − Management
- −$1,467
- − HOA
- −$7,560
- − Depreciation
- −$6,057
- Taxable loss
- −$14,041
- Est. tax savings @ 24.0%
- +$3,370
- After-tax cash flow
- $-6,970/yr
For passive investors: Depreciation is non-cash, so a rental often shows a tax loss while cash-flowing — sheltering income. Rental losses are passive: they offset passive income freely, and up to $25,000/yr can offset ordinary (W-2) income if you actively participate and your MAGI is under $100k (phasing out to $0 by $150k); unused losses carry forward. On sale, claimed depreciation is recaptured at up to 25%, and gains may owe capital-gains tax (a 1031 exchange can defer both). Figures are a year-1 estimate at your 24.0% rate — not tax advice; consult a CPA.
Condition & rehab AI · 1 photo
This Belmont manufactured home is in excellent condition with no visible repairs or maintenance needed. It is move-in ready and would be ideal for both resale and rental markets.
Schools (NCES district)
- District
- Hamblen County
- NCES district ID
- 4700001
- Math proficiency
- 31% ▼ -5.00%
- Reading proficiency
- 30% ▼ -4.00%
- Median HH income
- $39,361
- Composite
- 25.61/100
- National rank
- #7412
- State rank
- #57 of 139 in TN
Livability — Morristown
- Score
- 64/100
- State rank
- #175
- US rank
- #14625
Category grades
Schools grade is shown separately in the Schools card above.
Census & demographics
- Census place
- Morristown, TN
- County
- Hamblen County · 35,239 people
- City population
- 35,239
- Metro
- Morristown, TN
- Population (ZIP)
- 35,239
- Household income
- $55,650
- Rent vs Own
- Severe rent burden
- 1001.0
Population outlook (Hamblen County) Hauer SSP2
- Today (2025)
- 65,185 people
- By 2030
- 65,707 · +0.8%
- By 2040
- 66,189 · +1.5%
- By 2050
- 65,798 · +0.9%
- By 2075
- 62,642 · -3.9%
- By 2100
- 55,702 · -14.5%
Race, ethnicity, and origin ACS 2023
- Neighborhood character
- Predominantly White (74%)
- Race & ethnicity
- White 74% Hispanic / Latino 16% Two or more races 12% Black 4% Asian 1%
- Hispanic origin (detail)
- Mexican 12% Puerto Rican 2%
- Common ancestry
- Slovak 3% Lithuanian 2% Serbian 2%
- Foreign-born
- 8% · Canada
- Languages at home
- 85% English-only · Spanish 13% Other Asian/Pacific 1%
Political lean MEDSL · Hamblen
- 2024 margin
- Solid R (+58.9) · D 20.1% · R 79.0%
- 2008→2024 swing
- -20.5pp toward R · 2008: -38.4pp · 2024: -58.9pp
- All cycles
- 2024: R+58.9 2020: R+54.0 2016: R+57.2 2012: R+46.4 2008: R+38.4
Not yet ingested
- Civics
- —
Market trends
- HPI YoY
- ▼ -61.88%
- Current HPI
- 299.6486
- Rent YoY
- —
- Metro
- Morristown, TN
- State GDP YoY
- ▲ 2.78%
- F500 in state
- 22
Industry mix (Fortune 500 HQ in TN)
| Industry | F500 HQs | Revenue |
|---|---|---|
| Healthcare | 3 | $91B |
|
||
| Retail | 3 | $72B |
|
||
| Transportation / Logistics | 1 | $88B |
|
||
| Paper / Packaging | 1 | $19B |
|
||
| Insurance | 1 | $13B |
|
||
| Energy | 1 | $12B |
|
||
Price history
1 event — show timeline
- 2026-02-16 Listed $75,995 Zillow
Cash-flow waterfall
monthlySold comps — $/sqft
last 12 mo · ≤1 miLoading sold comps…