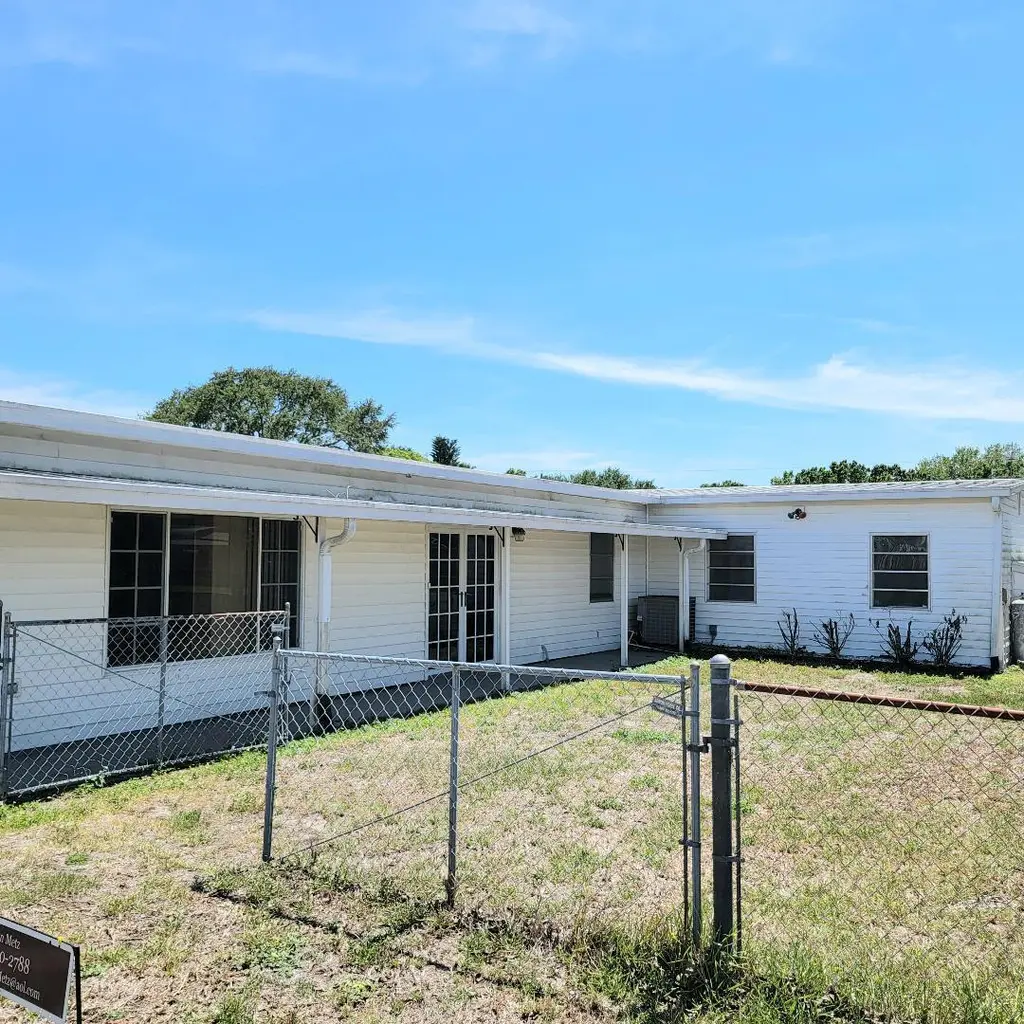
1096 8th St · Buckhead Ridge, FL
Flood risk 7/10 · Major
- FEMA flood zone
- X
- Chance of flooding over 30 yrs
- 0.77%
- Est. flood insurance / yr
- $507 – $1,088
Fire risk 5/10 · Moderate
- Est. fire insurance / yr
- $947 – $1,759
Heat risk 9/10 · Severe
- Hot days now (above 107°F)
- 7 days/yr
- Hot days in 30 yrs
- 24 days/yr
Wind risk 10/10 · Severe
- Chance of severe wind over 30 yrs
- 99.0%
Air-quality risk 2/10 · Minimal
- Unhealthy air days now
- 2 days/yr
- Unhealthy air days in 30 yrs
- 2 days/yr
Risk factors via First Street. Map © Google.
Why this score? — see what drove the B- grade
The composite is a weighted blend of 9 inputs, each scored 0–100. Each bar is that input's sub-score; the figure is the points it added to the 100-point composite (weight × sub-score).
- Cash flow +26.3/30.0
- ARV discount +15.0/15.0
- DSCR +8.9/10.0
- 1% rule +6.0/10.0
- Schools +3.3/10.0
- Livability +3.1/5.0
- Rent growth +2.5/5.0
- Condition / age +2.5/5.0
- Appreciation +0.0/10.0
$141,550
🖨 Deal sheet 📄 Offer letter ✓ Due diligence
Listing remarks
Come enjoy peaceful waterfront living in this cozy canal front home with a dock for a small boat and access to Lake Okeechobee. Lots of character starting with the Spanish Tile flooring and knotty pine kitchen cabinetry. Home has 2 bedrooms and 1 bathroom in main living area with an additional full bath in the huge, attached garage. Plenty of room for extra storage in the garage as well. The large Florida room overlooks the canal and even boasts a garden window for your plants! Wrap around wooden decks on both sides provide your own favorite fishing spot! Buckhead Ridge has a gas station, the Moose Club and is just a short drive to restaurants and grocery stores. Make this special proper
Key facts
- 6,490 sq ft lot
- 2 garage spots
- Built 1968
Property features AI
Finance
- Other: Lot dimensions approximately 65 x 100
- Financial info: No land lease
Exterior
- Parking: Attached 2-car garage; Two covered spaces; Two additional open/gravel parking spaces (4 total)
- Utilities: Public water available; Septic tank; Electricity available; Propane available
- Home design: Single-family residence; One-story with first-floor entry; Faces northeast; Resale condition
- Construction: Frame construction; Metal roof; Slab foundation; Built on one level (one story)
- Exterior features: Screened porch; Porch; Deck; Chain link fencing; Lake access and other waterfront features; Paved public road frontage (County Road)
Interior
- Kitchen: Gas range; Water heater owned
- Bedrooms: Two main-level bedrooms
- Flooring: Tile; Mexican tile
- Bathrooms: One full bathroom on the main level
- Heating & cooling: Central heating; Central air conditioning; Ceiling fans; Wall/window unit(s)
- Interior features: No special built-in interior features reported; Unfurnished
- Laundry & utility: Laundry closet with washer hookup
Neighborhood map
What this means for you Summary
Snapshot
- This is a 2-bed/1.0-bath single-family listed at $142k.
Deal economics
- At list price, monthly cash flow is $301 ($4k/yr) — positive.
- The deal already cash-flows at list — no discount required.
- Meets the 1% rule at list price ($2k rent vs $142k).
- Recommended offer: $139k (1.5% below list) — sets the bar for market timing.
- Cap rate 9.4% vs local median 5.2% in Buckhead Ridge — top-decile yield for the area; either an underpriced asset or a hidden risk that comps aren't pricing in. Stress-test before assuming the spread holds.
Location & tenants
- Location reads 61/100 on livability (#785 in FL) — a middle-class / working-renter tenant base. Strengths: crime A+, cost of living A+, housing A+; Watch: schools F, amenities F, commute F.
- Glades (town): math 38% / reading 41% proficiency, ranked #63 of 73 in FL (top 86%) — families likely to look elsewhere, expect single-tenant / working-renter base with shorter leases.
- Market conditions: 402 active listings in the ZIP; 65 units permitted in Glades County in 2024 (0 in 5+ unit buildings).
- This rent runs 35% of the median local income ($53k/yr) — at the standard rent-burdened threshold; future hikes will face affordability resistance.
Forward outlook
- Local home prices are declining (-3.0%/yr); year-one equity from $978 of loan paydown is wiped out by about $4k of value loss. Plan a longer hold.
- Glades County population projected at +15% by 2050 — long-run rental-demand tailwind backs the buy-and-hold thesis.
Negotiation context
- It's been on market 27 days — a 2% lower offer ($139k) is reasonable based on typical stale-listing flexibility.
- 7 sale attempts since 7y ago; this cycle's ask has dropped $7k (5%) from the opening price — seller is motivated, your offer sets the floor, not the list.
- Current owner paid $90k; list at $142k implies a 57% gain — meaningful room to come down on a strong offer.
Risks & watch-outs
- Watch-outs: flood insurance adds $66/mo.
- Climate carrying-cost: major flood risk; severe wind risk, 99% chance of damaging wind over 30y; moderate wildfire risk; extreme-heat days projected 7→24/yr by 2055 (HVAC capex compounding) — expect insurance premiums to compound above CPI over the hold.
Questions for the listing agent
- Built in 1968 — when were the roof, HVAC, electrical panel, plumbing, and water heater last replaced?
- What's the actual annual flood-insurance premium (NFIP or private), and is the property in a SFHA with mandatory coverage?
- Is there a deadline driving the sale (1031 exchange, divorce, estate, relocation)? That informs how much negotiation room exists.
- Schools are F-rated, which usually means shorter tenancies and higher turnover. Who's the typical renter profile here, and what's been the actual vacancy rate?
- What's the average days-on-market for RENTAL listings here right now (not sales)? A rising rental-DOM trend means longer vacancies and softer asking-rent achievability than the comps imply.
- What's the recent tenant-quality profile in this submarket — average credit score on applications, eviction rate, late-payment / NSF rate, and stable-employment percentage? A property-management company in the area should have these aggregated.
- How much new for-sale + rental construction is in the pipeline within 1–3 miles? Heavy new supply typically softens prices + rents 12–24 months out; constrained supply supports both.
Investment metrics
- 1% rule
- 1.10% ✓
- Cap rate
- 9.41%
- Cash-on-cash
- 11.12%
- DSCR
- 1.49
- GRM
- 7.6
CMA / ARV
- ARV (median comp)
- $174,616
- List price
- $141,550
- Delta
- -18.94%
- Verdict
- UNDERPRICED
- Comps
- 20 within 1.0 mi
Show comp detail 6 sales within ~0.75 mi
| Address | Dist | Beds/Ba | Sqft | Sold | Price | $/sf | Match |
|---|---|---|---|---|---|---|---|
| 1066 5th St | 0.16mi | 3/1.0 (+1) | 1,791 (+14%) | 9mo | $275,000 | $154 | 57 |
| 1147 4th St | 0.24mi | 3/2.0 (+1) | 1,432 (-9%) | 18mo | $225,000 | $157 | 50 |
| 1183 Canal Way | 0.34mi | 2/2.0 | 1,387 (-12%) | 14mo | $269,000 | $194 | 49 |
| 1166 Jordan Loop | 0.61mi | 3/2.0 (+1) | 1,672 (+7%) | 5mo | $325,000 | $194 | 48 |
| 1068 2nd St | 0.33mi | 3/2.0 (+1) | 1,402 (-11%) | 16mo | $240,000 | $171 | 44 |
| 1190 Linda Rd | 0.43mi | 3/2.0 (+1) | 1,658 (+6%) | 24mo | $269,000 | $162 | 42 |
Match score weights: distance 35% · size 25% · config 20% · recency 20%. Top-matched comps best support the ARV.
Projected returns pro-forma
-3.0% appreciation · 3.0% rent growth · sell at horizon
- IRR
- -2.5%
- Equity multiple
- 0.90×
- Total profit
- $-3,797
- Equity at exit
- $21,106
- IRR
- 7.1%
- Equity multiple
- 1.54×
- Total profit
- $21,314
- Equity at exit
- $12,239
Cash invested: $39,634 (down + closing). Projections, not guarantees.
Landlord ↔ Tenant lean methodology
- Overall (STATE)
- 87 Strongly Landlord-Friendly
- State Florida
- 87 Strongly Landlord-Friendly · R+3
- County
- — inherits STATE
- City
- — inherits STATE
ZIP-level market 34974
- Home prices YoY
- -15.6%
- Active inventory
- 402
- Price-to-rent
- 7.6×
Monthly cashflow live
- Estimated rent
- $1,551 medium interval (Pro) →
- Mortgage (P&I)
- −$742
- Tax from tax record
- −$57 /mo · $685/yr
- Insurance
- −$59
- Flood insurance flood zone
- −$66 /mo · $798/yr
- HOA
- −$0
- Vacancy / Maint / Mgmt
- −$326
- Net cashflow
- $301
Break-even live
UW: 25.0% down · 7.5% · 30yr · 1.5% tax · 5.0% vac · 8.0% maint · 8.0% mgmt
Financing live
Cash to close
- Down payment
- $35,388
- Closing costs
- $4,246
- Reserves months
- —
- Total cash needed
- —
Loan-product check · same deal, 3 products live
Conventional
25% down · 7.5% · 30yr
- Down + closing
- —
- Monthly P&I
- —
- Monthly cashflow
- —
- DSCR
- —
- Eligible?
- —
Personal DTI + credit; lowest rate.
DSCR
20% down · 8.5% · 30yr
- Down + closing
- —
- Monthly P&I
- —
- Monthly cashflow
- —
- DSCR
- —
- Eligible?
- —
No personal income docs; deal must DSCR.
Hard money
10% down · 12.0% · 12mo
- Down + closing
- —
- Monthly P&I
- —
- Monthly cashflow
- —
- DSCR
- —
- Eligible?
- —
Short-term bridge; refi at stabilization.
Listing history 22 events
-
2026-06-03days on market $141,550 Active 27 DOM
-
2026-06-02days on market $141,550 Active 26 DOM
-
2026-06-01days on market $141,550 Active 25 DOM
-
2026-05-31days on market $141,550 Active 24 DOM
-
2026-05-30days on market $141,550 Active 23 DOM
-
2026-05-18price $141,550 797-char remark
-
2026-05-05$149,000 Active 797-char remark
-
2026-04-30historical
-
2026-04-30historical
-
2026-04-18$149,000 Active
-
2026-04-17$149,000 Active
-
2025-11-25historical
-
2025-10-02price $160,000
-
2025-09-29status Active
-
2025-09-24status Pending
-
2025-08-15status Active
-
2025-08-06status Pending
-
2025-07-27price $182,000
-
2025-05-26$192,000 Active
-
2020-02-21historical
-
2019-04-25$300,000 Active
-
2004-03-01soldstatus $90,000
ⓘ Source: listings_history table (triggers on properties + properties_extension) + one-shot
backfill from property_details.listing_events for pre-trigger history.
Tax reassessment forecast FL · Resets to sale price
- Current annual tax
- $685 · $57/mo
- Projected year-2 tax
- $1,175 · $98/mo
- Expected delta
- +$490/yr (+$41/mo · 71.5%)
ⓘ Screening estimate from a state-policy table — verify with the county assessor before closing.
Climate risk First Street
- Flood 7/10 Severe FEMA zone X · 77% chance over 30 yrs
- Wildfire 5/10 Major
- Heat 9/10 Extreme 7 d/yr ≥107°F today · 24 d/yr by 30 yrs out
- Wind 10/10 Extreme 99% chance of damaging wind over 30 yrs
- Air quality 2/10 Low 2 unhealthy d/yr today · 2 by 30 yrs out
Nearby sold comps map
Loading sold comps map…
Walkable amenities ~0.75 mi
Loading nearby amenities…
Taxation est. · year 1
- Rental income
- $18,615
- − Mortgage interest
- −$7,929
- − Property taxes
- −$685
- − Insurance
- −$1,505
- − Repairs & maintenance
- −$1,489
- − Management
- −$1,489
- − Depreciation
- −$4,118
- Taxable income
- $1,400
- Est. tax owed @ 24.0%
- −$336
- After-tax cash flow
- $3,272/yr
For passive investors: Depreciation is non-cash, so a rental often shows a tax loss while cash-flowing — sheltering income. Rental losses are passive: they offset passive income freely, and up to $25,000/yr can offset ordinary (W-2) income if you actively participate and your MAGI is under $100k (phasing out to $0 by $150k); unused losses carry forward. On sale, claimed depreciation is recaptured at up to 25%, and gains may owe capital-gains tax (a 1031 exchange can defer both). Figures are a year-1 estimate at your 24.0% rate — not tax advice; consult a CPA.
Schools (NCES district)
- District
- Glades
- NCES district ID
- 1200660
- Math proficiency
- 38% ▼ -15.00%
- Reading proficiency
- 41% ▼ -5.00%
- Median HH income
- $36,758
- Composite
- 32.81/100
- National rank
- #5622
- State rank
- #63 of 73 in FL
Livability — Buckhead Ridge
- Score
- 61/100
- State rank
- #785
- US rank
- #17876
Category grades
Schools grade is shown separately in the Schools card above.
Census & demographics
- Census place
- Buckhead Ridge, FL
- County
- Okeechobee County · 23,975 people
- Metro
- Okeechobee, FL
- Population (ZIP)
- 23,975
- Household income
- $53,013
- Rent vs Own
- Severe rent burden
- 399.0
Population outlook (Glades County) Hauer SSP2
- Today (2025)
- 14,901 people
- By 2030
- 15,463 · +3.8%
- By 2040
- 16,341 · +9.7%
- By 2050
- 17,158 · +15.1%
- By 2075
- 18,881 · +26.7%
- By 2100
- 19,164 · +28.6%
Race, ethnicity, and origin ACS 2023
- Neighborhood character
- Predominantly White (74%)
- Race & ethnicity
- White 74% Hispanic / Latino 19% Two or more races 8% Asian 2% Black 2% Native American 1%
- Hispanic origin (detail)
- Mexican 12% Puerto Rican 1% Cuban 2%
- Common ancestry
- Lithuanian 2% Iranian 2% Italian 2%
- Foreign-born
- 11% · Canada, Jamaica
- Languages at home
- 81% English-only · Spanish 16% French/Haitian/Cajun 1% Other Indo-European 1%
Political lean MEDSL · Glades
- 2024 margin
- Solid R (+53.3) · D 23.1% · R 76.4%
- 2008→2024 swing
- -36.7pp toward R · 2008: -16.6pp · 2024: -53.3pp
- All cycles
- 2024: R+53.3 2020: R+46.2 2016: R+39.6 2012: R+18.6 2008: R+16.6
Not yet ingested
- Civics
- —
Market trends
- HPI YoY
- ▼ -64.47%
- Current HPI
- 348.6692
- Rent YoY
- —
- Metro
- Okeechobee, FL
- State GDP YoY
- ▲ 3.28%
- F500 in state
- 36
Industry mix (Fortune 500 HQ in FL)
| Industry | F500 HQs | Revenue |
|---|---|---|
| Industrial Technology | 2 | $29B |
|
||
| Insurance | 2 | $17B |
|
||
| Retail | 1 | $60B |
|
||
| Technology Distribution | 1 | $58B |
|
||
| Homebuilding | 1 | $35B |
|
||
| Technology Manufacturing | 1 | $35B |
|
||
Price history
+57.3% since first listed18 events — show timeline
- 2026-06-05 Listing Removed — Beaches MLS
- 2026-05-18 Price Changed $141,550 Beaches MLS
- 2026-05-05 Listed $149,000 Beaches MLS
- 2026-04-30 Listing Removed — Stellar MLS as Distributed by MLS Grid
- 2026-04-30 Listing Removed — Beaches MLS
- 2026-04-18 Listed $149,000 Stellar MLS as Distributed by MLS Grid
- 2026-04-17 Listed $149,000 Beaches MLS
- 2025-11-25 Listing Removed — Stellar MLS as Distributed by MLS Grid
- 2025-10-02 Price Changed $160,000 Stellar MLS as Distributed by MLS Grid
- 2025-09-29 Relisted — Stellar MLS as Distributed by MLS Grid
- 2025-09-24 Pending — Stellar MLS as Distributed by MLS Grid
- 2025-08-15 Relisted — Stellar MLS as Distributed by MLS Grid
- 2025-08-06 Pending — Stellar MLS as Distributed by MLS Grid
- 2025-07-27 Price Changed $182,000 Stellar MLS as Distributed by MLS Grid
- 2025-05-26 Listed $192,000 Stellar MLS as Distributed by MLS Grid
- 2020-02-21 Listing Removed — Stellar MLS as Distributed by MLS Grid
- 2019-04-25 Listed $300,000 Stellar MLS as Distributed by MLS Grid
- 2004-03-01 Sold (Public Records) $90,000 Public Records
Property tax history
+0.5%/yrLatest (2025): $685 · +6.4% YoY. Source: county tax records.
Cash-flow waterfall
monthlySold comps — $/sqft
last 12 mo · ≤1 miLoading sold comps…