 Duplex
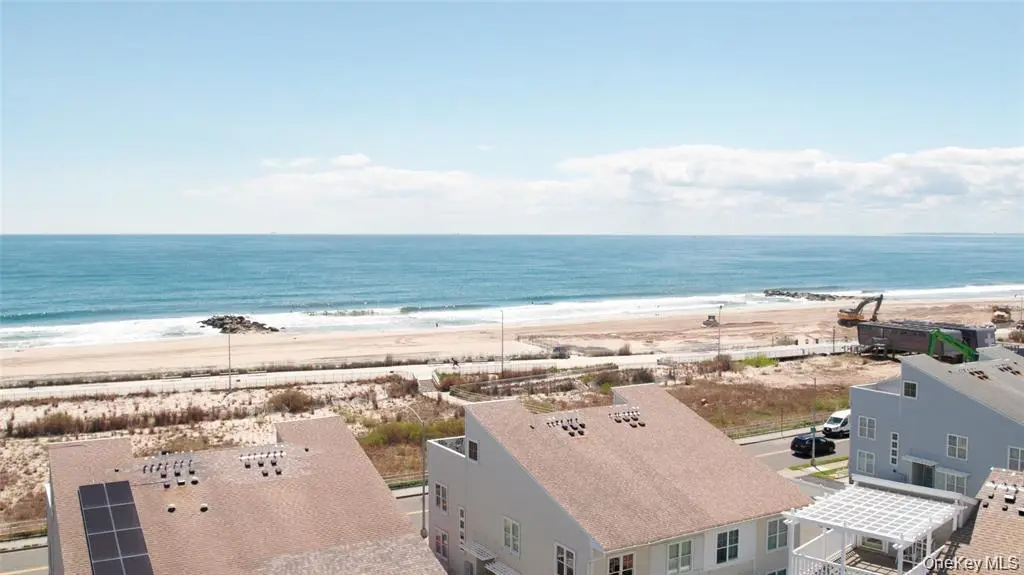
6910 Beach Front Rd · New York, NY
Flood risk 3/10 · Minor
- FEMA flood zone
- X (unshaded)
- Chance of flooding over 30 yrs
- 0.09%
- Est. flood insurance / yr
- $507 – $1,088
Fire risk 1/10 · Minimal
- Est. fire insurance / yr
- $691 – $1,283
Heat risk 7/10 · Major
- Hot days now (above 96°F)
- 7 days/yr
- Hot days in 30 yrs
- 16 days/yr
Wind risk 8/10 · Major
- Chance of severe wind over 30 yrs
- 80.0%
Air-quality risk 3/10 · Minor
- Unhealthy air days now
- 4 days/yr
- Unhealthy air days in 30 yrs
- 4 days/yr
Risk factors via First Street. Map © Google.
Why this score? — see what drove the D grade
The composite is a weighted blend of 9 inputs, each scored 0–100. Each bar is that input's sub-score; the figure is the points it added to the 100-point composite (weight × sub-score).
- ARV discount +11.9/15.0
- Appreciation +10.0/10.0
- Cash flow +6.8/30.0
- Schools +5.0/10.0
- Livability +3.8/5.0
- Rent growth +2.5/5.0
- Condition / age +2.5/5.0
- DSCR +1.0/10.0
- 1% rule +0.6/10.0
$1,178,000
🖨 Deal sheet 📄 Offer letter ✓ Due diligence
Multi-family units
County records classify this as Multi-Family (2-4 Unit). Listing-text estimate: 2 units. confirmed
Listing remarks
Welcome To Your Dream Coastal Escape In One Of NYC’s Most Vibrant Beach Communities! This Exceptional Two-Family Home Offers Breathtaking, Unobstructed Ocean Views And The Rare Opportunity To Live By The Beach While Earning Rental Income. The Second-Floor Unit Features A Bright And Airy Open-Concept Layout With Two Spacious Bedrooms And Two Full Baths. The Extra-Large Primary Suite Boasts An En Suite Bathroom And A Generous Walk-In Closet. Step Up To The Third-Floor Oceanfront Balcony—Your Private Oasis To Relax, Entertain, And Soak In Sweeping Seaside Sunsets. The First-Floor Unit Includes Three Well-Sized Bedrooms And Two Full Baths, Perfect For Extended Family, Guests, Or Ten
Key facts
- Oceanfront balcony
- Coastal living
- Ocean views
Tags
Property features AI
Finance
- HOA & community: HOA fee of $275 monthly; Community sidewalks
Exterior
- Parking: Private driveway
- Utilities: Public sewer; Water connected; Electricity connected; Natural gas connected; Cable available; Trash collection (public)
- Home design: Townhouse; Duplex; Waterfront property
- Construction: Vinyl siding; Slab foundation
- Exterior features: Balcony; Fenced yard; Shed(s); Back yard; Waterfront views
Interior
- Kitchen: Open kitchen
- Bedrooms: One 2-bedroom unit; One 3-bedroom unit
- Flooring: Carpet; Wood
- Bathrooms: 4 full bathrooms
- Heating & cooling: Central air conditioning; Forced air heating (natural gas)
- Interior features: First-floor bedroom; First-floor full bath; Primary bathroom; Master bedroom on main level; Open floor plan; Open kitchen; Walk-in closet(s); Patio
- Laundry & utility: Hall laundry
Neighborhood map
What this means for you Summary
Snapshot
- This is a 2 × 2-bed/2.5-bath units multifamily listed at $1.18M.
Deal economics
- At list price, monthly cash flow is $-2k ($-22k/yr) — negative. Per door: $-928/mo.
- To cash-flow at today's rent, offer at most $850k (27.8% below list).
- To meet the 1% rule (rent ≥ 1% of price), the offer needs to be $665k (43.5% below list).
- Recommended offer: $665k (43.5% below list) — sets the bar for 1% rule.
- Cap rate 4.4% vs local median 2.6% in New York — top-decile yield for the area; either an underpriced asset or a hidden risk that comps aren't pricing in. Stress-test before assuming the spread holds.
Location & tenants
- Location reads 75/100 on livability (#268 in NY, #4,188 nationally) — a middle-class / working-renter tenant base. Strengths: amenities A+, commute A+, health & safety A; Watch: crime F, cost of living F.
- Market conditions: 80 active listings in the ZIP; 3 comparable units currently listed for rent nearby; rentals at typical pace (median 25d on market — plan ~3-4 weeks tenant-placement turnaround); 5,302 units permitted in Queens County in 2024 (4,918 in 5+ unit buildings).
- At $6,650/mo this rent would consume 160% of the median local household income ($50k/yr) (locally 1734% of renters already pay >50% of income on rent) — very limited rent-growth headroom before tenants either downsize or default.
Forward outlook
- In year one you build about $126k of equity ($8k loan paydown + $118k appreciation (10.0% local appreciation)).
- Queens County population projected at +16% by 2050 — long-run rental-demand tailwind backs the buy-and-hold thesis.
- By year 2, paydown + projected appreciation supports a ~$202k cash-out refi (75% LTV) — recoverable capital for the next deal without selling this one.
Negotiation context
- It's been on market 82 days — a 6% lower offer ($1.11M) is reasonable based on typical stale-listing flexibility.
- 5 sale attempts since 11y ago with the ask held roughly flat each time — persistent listings suggest the price (not the market) is what's stuck; bring a comps-based counter.
- Current owner paid $840k; 40% above their basis — modest negotiation headroom, anchor on the comps not their cost.
Risks & watch-outs
- Climate carrying-cost: severe wind risk, 80% chance of damaging wind over 30y; extreme-heat days projected 7→16/yr by 2055 (HVAC capex compounding) — expect insurance premiums to compound above CPI over the hold.
Questions for the listing agent
- What do current leases actually rent for vs. the listed asking? Can we see a recent rent roll and the last 12 months of T-12 income?
- It's been on market 82 days. Have you received any prior offers? Is the seller open to a 44% concession, seller financing, or rate buy-down credit?
- Can we see the unit-by-unit rent roll, current vacancy, and any below-market leases? What's the average tenancy length?
- What capital expenditures (roof, boiler, parking lot, exteriors) have been made in the last 5 years, and what's planned in the next 2?
- Why hasn't it sold? Are there any deal-killer items the seller is aware of (foundation, flood, title, zoning, code violations)?
- Is there a deadline driving the sale (1031 exchange, divorce, estate, relocation)? That informs how much negotiation room exists.
- Schools are B-rated — typically a magnet for longer-tenancy family renters. What's the average tenant stay here, and is there a school-zone premium baked into asking?
- Crime grade is F in this area — have there been break-ins, vandalism, or insurance claims at this property in the last 3 years? What carrier currently insures it and at what premium?
- The area grade is low — what's the realistic commute time and amenity access for the typical tenant pool here? Any planned neighborhood developments (good or bad) we should know about?
- What's the average days-on-market for RENTAL listings here right now (not sales)? A rising rental-DOM trend means longer vacancies and softer asking-rent achievability than the comps imply.
- What's the recent tenant-quality profile in this submarket — average credit score on applications, eviction rate, late-payment / NSF rate, and stable-employment percentage? A property-management company in the area should have these aggregated.
- How much new apartment / multifamily construction is in the pipeline within 1–3 miles? Heavy new supply (>2% of stock underway) typically softens rents 12–24 months out; light construction supports rent growth.
Investment metrics
- 1% rule
- 0.56% ✗
- Cap rate
- 4.40%
- Cash-on-cash
- -6.75%
- DSCR
- 0.70
- GRM
- 14.8
CMA / ARV
- ARV (on-the-fly)
- $1,305,360
- Comps found
- 1
Show comp detail 1 sale within ~0.75 mi
| Address | Dist | Beds/Ba | Sqft | Sold | Price | $/sf | Match |
|---|---|---|---|---|---|---|---|
| 6523 Seaspray Ave | 0.20mi | 4/3.0 | 2,258 (-10%) | 8mo | $1,170,000 | $518 | 59 |
Match score weights: distance 35% · size 25% · config 20% · recency 20%. Top-matched comps best support the ARV.
Projected returns pro-forma
10.0% appreciation · 3.0% rent growth · sell at horizon
- IRR
- 19.5%
- Equity multiple
- 2.59×
- Total profit
- $522,800
- Equity at exit
- $1,061,236
- IRR
- 17.9%
- Equity multiple
- 5.95×
- Total profit
- $1,631,479
- Equity at exit
- $2,288,595
Cash invested: $329,840 (down + closing). Projections, not guarantees.
Landlord ↔ Tenant lean methodology
- Overall (CITY)
- 0 Strongly Tenant-Friendly
- State New York
- 15 Strongly Tenant-Friendly · D+10
- County
- — inherits STATE
- City New York
- 0 Strongly Tenant-Friendly · D+34
ZIP-level market 11692
- Home prices YoY
- 14.4%
- Active inventory
- 80
- Price-to-rent
- 29.5×
Monthly cashflow live
- Estimated rent
- $6,650 high interval (Pro) →
- Mortgage (P&I)
- −$6,178
- Tax from tax record
- −$442 /mo · $5,298/yr
- Insurance
- −$491
- HOA
- −$0
- Vacancy / Maint / Mgmt
- −$1,396
- Net cashflow
- $-1,856
Break-even live
2-unit breakdown (identical units grouped — click to expand)
| Units | Beds | Baths | Est. rent |
|---|---|---|---|
| 2× units | 2 | 2.5 | $6,650 |
| #1 | 2 | 2.5 | $3,325 |
| #2 | 2 | 2.5 | $3,325 |
| Total (2 units) | $6,650 | ||
UW: 25.0% down · 7.5% · 30yr · 1.5% tax · 5.0% vac · 8.0% maint · 8.0% mgmt
Financing live
Cash to close
- Down payment
- $294,500
- Closing costs
- $35,340
- Reserves months
- —
- Total cash needed
- —
Loan-product check · same deal, 3 products live
Conventional
25% down · 7.5% · 30yr
- Down + closing
- —
- Monthly P&I
- —
- Monthly cashflow
- —
- DSCR
- —
- Eligible?
- —
Personal DTI + credit; lowest rate.
DSCR
20% down · 8.5% · 30yr
- Down + closing
- —
- Monthly P&I
- —
- Monthly cashflow
- —
- DSCR
- —
- Eligible?
- —
No personal income docs; deal must DSCR.
Hard money
10% down · 12.0% · 12mo
- Down + closing
- —
- Monthly P&I
- —
- Monthly cashflow
- —
- DSCR
- —
- Eligible?
- —
Short-term bridge; refi at stabilization.
Rent comps 3 comps
| Address | Beds | Baths | Sqft | Rent | $/sqft | DOM | Units | Dist |
|---|---|---|---|---|---|---|---|---|
| 75-18 Aquatic Dr Unit B Arverne, NY | 3.0 | 2.5 | 2034 | $3,500 | $1.72 | 24d | 1 | 0.31mi |
| 325 Beach 46th St Far Rockaway, NY | 3.0 | 1.5 | 2250 | $3,100 | $1.38 | 24d | 1 | 1.16mi |
| 2-27R Beach 99th St Rockaway Park, NY | 3.0 | 1.0 | 2208 | $3,500 | $1.59 | 24d | 1 | 1.24mi |
Listing history 22 events
-
2026-06-08statusdays on market $1,178,000 Pending 82 DOM
-
2026-06-08days on market $1,178,000 Active 81 DOM
-
2026-06-04days on market $1,178,000 Active 78 DOM
-
2026-06-03days on market $1,178,000 Active 77 DOM
-
2026-06-01days on market $1,178,000 Active 75 DOM
-
2026-05-31days on market $1,178,000 Active 74 DOM
-
2026-03-18$1,178,000 Active
-
2025-11-09historical
-
2025-06-18price $1,199,900
-
2025-05-08$1,248,000 Active
-
2025-03-06historical
-
2025-02-12price $1,249,000
-
2024-10-24price $1,250,000
-
2024-08-05price $1,290,000
-
2024-07-01price $1,350,000
-
2024-06-28$1,300,000 Active
-
2015-07-15soldstatus $840,000
-
2015-07-01soldstatus $840,000 Closed
-
2015-07-01soldstatus $840,000
-
2015-06-09status Under Contract
-
2015-03-02$869,000 New
-
2015-03-02$869,000
ⓘ Source: listings_history table (triggers on properties + properties_extension) + one-shot
backfill from property_details.listing_events for pre-trigger history.
Tax reassessment forecast NY · Partial reset (capped growth)
- Current annual tax
- $5,298 · $442/mo
- Projected year-2 tax
- $12,603 · $1,050/mo
- Expected delta
- +$7,305/yr (+$609/mo · 137.9%)
ⓘ Screening estimate from a state-policy table — verify with the county assessor before closing.
Climate risk First Street
- Flood 3/10 Moderate FEMA zone X (unshaded) · 9% chance over 30 yrs
- Wildfire 1/10 Low
- Heat 7/10 Severe 7 d/yr ≥96°F today · 16 d/yr by 30 yrs out
- Wind 8/10 Severe 80% chance of damaging wind over 30 yrs
- Air quality 3/10 Moderate 4 unhealthy d/yr today · 4 by 30 yrs out
Nearby sold comps map
Loading sold comps map…
Walkable amenities ~0.75 mi
Loading nearby amenities…
Taxation est. · year 1
- Rental income
- $79,800
- − Mortgage interest
- −$65,986
- − Property taxes
- −$5,298
- − Insurance
- −$5,890
- − Repairs & maintenance
- −$6,384
- − Management
- −$6,384
- − Depreciation
- −$34,269
- Taxable loss
- −$44,412
- Est. tax savings @ 24.0%
- +$10,659
- After-tax cash flow
- $-11,618/yr
For passive investors: Depreciation is non-cash, so a rental often shows a tax loss while cash-flowing — sheltering income. Rental losses are passive: they offset passive income freely, and up to $25,000/yr can offset ordinary (W-2) income if you actively participate and your MAGI is under $100k (phasing out to $0 by $150k); unused losses carry forward. On sale, claimed depreciation is recaptured at up to 25%, and gains may owe capital-gains tax (a 1031 exchange can defer both). Figures are a year-1 estimate at your 24.0% rate — not tax advice; consult a CPA.
Schools (NCES district)
No district data.
Livability — New York
- Score
- 75/100
- State rank
- #268
- US rank
- #4188
Category grades
Schools grade is shown separately in the Schools card above.
Census & demographics
- Census place
- New York, NY
- County
- Queens County · 1,914,869 people
- City population
- 7,731,280
- Metro
- New York-Newark-Jersey City, NY-NJ-PA
- Population (ZIP)
- 22,734
- Household income
- $49,720
- Rent vs Own
- Severe rent burden
- 1734.0
Population outlook (Queens County) Hauer SSP2
- Today (2025)
- 2,546,320 people
- By 2030
- 2,643,059 · +3.8%
- By 2040
- 2,815,563 · +10.6%
- By 2050
- 2,944,423 · +15.6%
- By 2075
- 3,123,338 · +22.7%
- By 2100
- 3,098,688 · +21.7%
Race, ethnicity, and origin ACS 2023
- Neighborhood character
- Diverse neighborhood (Simpson 0.64)
- Race & ethnicity
- Black 53% Hispanic / Latino 24% Two or more races 15% White 13% Asian 6%
- Hispanic origin (detail)
- Puerto Rican 10% Dominican 5%
- Common ancestry
- Romanian 1%
- Foreign-born
- 31% · Canada, China, Jamaica
- Languages at home
- 67% English-only · Spanish 18% Other Indo-European 3% Russian/Polish/Slavic 3%
Political lean MEDSL · Queens
- 2024 margin
- Strong D (+24.6) · D 62.3% · R 37.7%
- 2008→2024 swing
- -26.2pp toward R · 2008: 50.8pp · 2024: 24.6pp
- All cycles
- 2024: D+24.6 2020: D+45.2 2016: D+53.4 2012: D+58.5 2008: D+50.8
Not yet ingested
- Civics
- —
Market trends
- HPI YoY
- ▲ 44.49%
- Current HPI
- 354.2007
- Rent YoY
- —
- Metro
- New York-Newark-Jersey City, NY-NJ-PA
- State GDP YoY
- ▲ 2.60%
- F500 in state
- 92
Industry mix (Fortune 500 HQ in NY)
| Industry | F500 HQs | Revenue |
|---|---|---|
| Financial Services | 10 | $950B |
|
||
| Consumer Goods | 9 | $162B |
|
||
| Insurance | 4 | $225B |
|
||
| Telecommunications | 2 | $144B |
|
||
| Pharmaceuticals | 2 | $112B |
|
||
| Media / Entertainment | 2 | $69B |
|
||
Price history
+35.6% since first listed16 events — show timeline
- 2026-03-18 Listed $1,178,000 OneKey® MLS as Distributed by MLS Grid
- 2025-11-09 Listing Removed — OneKey® MLS as Distributed by MLS Grid
- 2025-06-18 Price Changed $1,199,900 OneKey® MLS as Distributed by MLS Grid
- 2025-05-08 Listed $1,248,000 OneKey® MLS as Distributed by MLS Grid
- 2025-03-06 Listing Removed — OneKey® MLS as Distributed by MLS Grid
- 2025-02-12 Price Changed $1,249,000 OneKey® MLS as Distributed by MLS Grid
- 2024-10-24 Price Changed $1,250,000 OneKey® MLS as Distributed by MLS Grid
- 2024-08-05 Price Changed $1,290,000 OneKey® MLS as Distributed by MLS Grid
- 2024-07-01 Price Changed $1,350,000 OneKey® MLS as Distributed by MLS Grid
- 2024-06-28 Listed $1,300,000 OneKey® MLS as Distributed by MLS Grid
- 2015-07-15 Sold (Public Records) $840,000 Public Records
- 2015-07-01 Sold (MLS) $840,000 OneKey® MLS as Distributed by MLS Grid
- 2015-07-01 Sold (MLS) $840,000 MLSLI
- 2015-06-09 Pending — MLSLI
- 2015-03-02 Listed $869,000 MLSLI
- 2015-03-02 Listed $869,000 OneKey® MLS as Distributed by MLS Grid
Property tax history
+7.8%/yrLatest (2024): $5,298 · +15.6% YoY. Source: county tax records.
Cash-flow waterfall
monthlySold comps — $/sqft
last 12 mo · ≤1 miLoading sold comps…