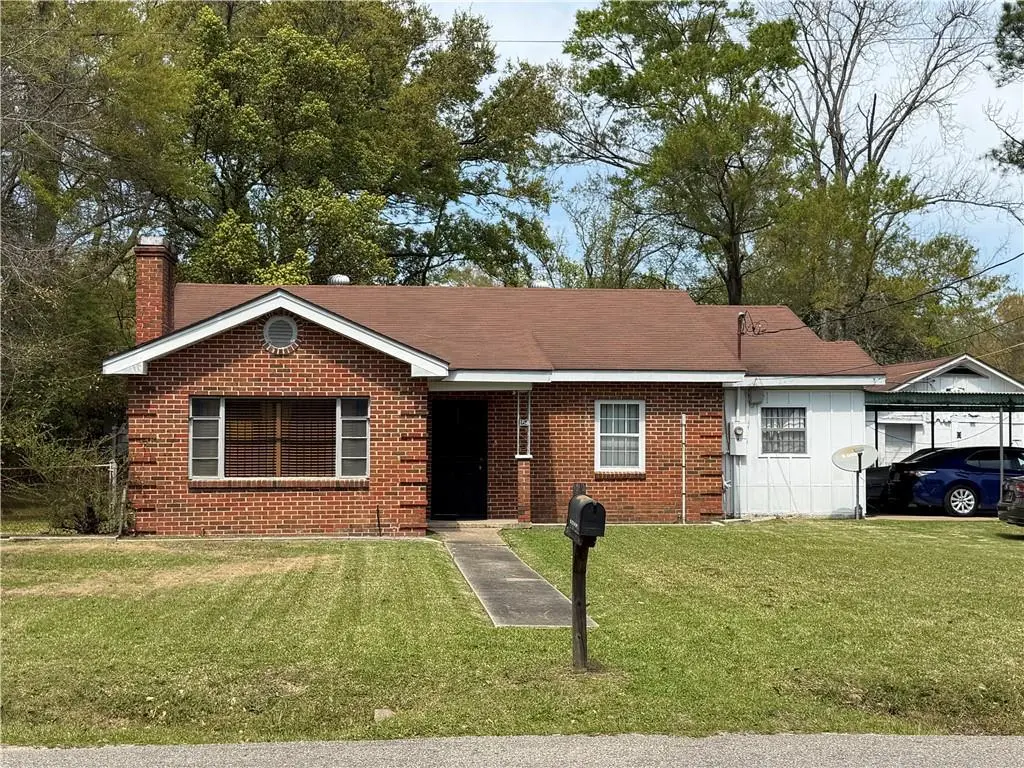
154 Chieftain Way · Chickasaw, AL
Flood risk 1/10 · Minimal
- FEMA flood zone
- X (unshaded)
- Chance of flooding over 30 yrs
- 0.0%
- Est. flood insurance / yr
- $507 – $1,088
Fire risk 2/10 · Minimal
- Est. fire insurance / yr
- $916 – $1,700
Heat risk 9/10 · Severe
- Hot days now (above 104°F)
- 7 days/yr
- Hot days in 30 yrs
- 21 days/yr
Wind risk 9/10 · Severe
- Chance of severe wind over 30 yrs
- 99.0%
Air-quality risk 2/10 · Minimal
- Unhealthy air days now
- 1 days/yr
- Unhealthy air days in 30 yrs
- 2 days/yr
Risk factors via First Street. Map © Google.
Why this score? — see what drove the B+ grade
The composite is a weighted blend of 9 inputs, each scored 0–100. Each bar is that input's sub-score; the figure is the points it added to the 100-point composite (weight × sub-score).
- Cash flow +30.0/30.0
- DSCR +10.0/10.0
- Appreciation +10.0/10.0
- 1% rule +8.4/10.0
- ARV discount +6.6/15.0
- Schools +5.0/10.0
- Livability +3.1/5.0
- Rent growth +2.5/5.0
- Condition / age +2.5/5.0
$80,000
🖨 Deal sheet 📄 Offer letter ✓ Due diligence
Listing remarks
Investor special with steady income! This solid brick home on a slab offers a reliable, long-term tenant who has been in place for over 8 years and would love to stay. Currently on a month-to-month lease at $900/month, this property provides immediate cash flow with flexibility for the new owner. The home features 3 bedrooms, 1 bathroom, a bonus room is currently used as the third bedroom. Durable LVP flooring was installed in 2017, with tile in all wet areas for easy maintenance. Major systems have been updated, including an HVAC system replaced in 2022 and a newer water heater, giving added peace of mind. Outside, you’ll find a fenced-in yard, a detached shop, and a covered carport
Key facts
- Tile in wet areas
- Updated hvac system
- Newer water heater
Tags
Neighborhood map
What this means for you Summary
Snapshot
- This is a 3-bed/1.0-bath single-family listed at $80k.
Deal economics
- At list price, monthly cash flow is $329 ($4k/yr) — positive.
- The deal already cash-flows at list — no discount required.
- Meets the 1% rule at list price ($1k rent vs $80k).
- Cap rate 11.2% vs local median 7.2% in Chickasaw — top-decile yield for the area; either an underpriced asset or a hidden risk that comps aren't pricing in. Stress-test before assuming the spread holds.
Location & tenants
- Location reads 61/100 on livability (#237 in AL) — a middle-class / working-renter tenant base. Strengths: cost of living A+, housing A-, health & safety B; Watch: crime D-, amenities F, commute F.
- Zoned schools: Chickasaw City Elementary School (math 7% / reading 30%, grade F, #480 of 627 statewide, top 77%, 550 students, 80% FRL); Chickasaw City High School (math 5% / reading 15%, grade F, #248 of 305 statewide, top 82%, 224 students, 91% FRL).
- Market conditions: 45 active listings in the ZIP; 6 comparable units currently listed for rent nearby; rentals at typical pace (median 21d on market — plan ~3-4 weeks tenant-placement turnaround); 1,678 units permitted in Mobile County in 2024 (264 in 5+ unit buildings).
Forward outlook
- In year one you build about $9k of equity ($553 loan paydown + $8k appreciation (10.0% local appreciation)).
- Mobile County population projected to shrink 8% by 2050 — rents likely to lag national; underwrite the cash flow, not the appreciation.
- At projected returns (10.0% appreciation + 3.0% rent growth), your $22k cash investment doubles in ~2 years — after that, you're playing with house money.
- By year 4, paydown + projected appreciation supports a ~$30k cash-out refi (75% LTV) — recoverable capital for the next deal without selling this one.
Negotiation context
- Only 7 days on market — expect competitive offers; lowballing is unlikely to land.
- Current owner paid $47k; list at $80k implies a 70% gain — meaningful room to come down on a strong offer.
Risks & watch-outs
- Watch-outs: built in 1951 — expect roof / HVAC / electrical / plumbing capex.
- Climate carrying-cost: severe wind risk, 99% chance of damaging wind over 30y; extreme-heat days projected 7→21/yr by 2055 (HVAC capex compounding) — expect insurance premiums to compound above CPI over the hold.
Questions for the listing agent
- Built in 1951 — when were the roof, HVAC, electrical panel, plumbing, and water heater last replaced?
- Is there a deadline driving the sale (1031 exchange, divorce, estate, relocation)? That informs how much negotiation room exists.
- Schools are F-rated, which usually means shorter tenancies and higher turnover. Who's the typical renter profile here, and what's been the actual vacancy rate?
- Crime grade is D in this area — have there been break-ins, vandalism, or insurance claims at this property in the last 3 years? What carrier currently insures it and at what premium?
- What's the average days-on-market for RENTAL listings here right now (not sales)? A rising rental-DOM trend means longer vacancies and softer asking-rent achievability than the comps imply.
- What's the recent tenant-quality profile in this submarket — average credit score on applications, eviction rate, late-payment / NSF rate, and stable-employment percentage? A property-management company in the area should have these aggregated.
- How much new for-sale + rental construction is in the pipeline within 1–3 miles? Heavy new supply typically softens prices + rents 12–24 months out; constrained supply supports both.
Investment metrics
- 1% rule
- 1.34% ✓
- Cap rate
- 11.23%
- Cash-on-cash
- 17.63%
- DSCR
- 1.78
- GRM
- 6.2
CMA / ARV
- ARV (on-the-fly)
- $78,446
- Comps found
- 12
Show comp detail 12 sales within ~0.75 mi
| Address | Dist | Beds/Ba | Sqft | Sold | Price | $/sf | Match |
|---|---|---|---|---|---|---|---|
| 154 Chieftain Way | 0.00mi | 3/1.0 | 1,286 (0%) | 1mo | $78,000 | $61 | 100 |
| 263 9th Ave | 0.27mi | 3/1.0 | 1,329 (+3%) | 0mo | $75,000 | $56 | 82 |
| 305 11th Ave | 0.26mi | 3/2.0 | 1,152 (-10%) | 1mo | $65,000 | $56 | 66 |
| 250 10th Ave | 0.21mi | 3/1.0 | 1,118 (-13%) | 8mo | $70,000 | $63 | 62 |
| 305 5th Ave | 0.58mi | 3/1.0 | 1,232 (-4%) | 11mo | $60,000 | $49 | 57 |
| 643 Gehrig Ave | 0.72mi | 3/2.0 | 1,308 (+2%) | 4mo | $76,000 | $58 | 56 |
| 94 DIAMOND St | 0.54mi | 3/2.0 | 1,215 (-6%) | 12mo | $168,000 | $138 | 52 |
| 206 5th St | 0.55mi | 2/1.0 (-1) | 1,376 (+7%) | 8mo | $53,500 | $39 | 51 |
| 310 8th Ave | 0.39mi | 2/2.0 (-1) | 1,160 (-10%) | 10mo | $76,500 | $66 | 48 |
| 315 4th Ave | 0.66mi | 3/2.0 | 1,369 (+6%) | 10mo | $129,000 | $94 | 47 |
| 346 Fall Ave | 0.74mi | 3/1.5 | 1,144 (-11%) | 1mo | $42,000 | $37 | 44 |
| 254 4th Ave | 0.63mi | 3/2.0 | 1,456 (+13%) | 8mo | $209,000 | $144 | 38 |
Match score weights: distance 35% · size 25% · config 20% · recency 20%. Top-matched comps best support the ARV.
Projected returns pro-forma
10.0% appreciation · 3.0% rent growth · sell at horizon
- IRR
- 37.4%
- Equity multiple
- 3.88×
- Total profit
- $64,527
- Equity at exit
- $72,070
- IRR
- 32.2%
- Equity multiple
- 8.75×
- Total profit
- $173,522
- Equity at exit
- $155,422
Cash invested: $22,400 (down + closing). Projections, not guarantees.
Landlord ↔ Tenant lean methodology
- Overall (STATE)
- 90 Strongly Landlord-Friendly
- State Alabama
- 90 Strongly Landlord-Friendly · R+15
- County
- — inherits STATE
- City
- — inherits STATE
ZIP-level market 36611
- Home prices YoY
- 7.0%
- Active inventory
- 45
- Price-to-rent
- 6.2×
Monthly cashflow live
- Estimated rent
- $1,070 high interval (Pro) →
- Mortgage (P&I)
- −$420
- Tax from tax record
- −$63 /mo · $755/yr
- Insurance
- −$33
- HOA
- −$0
- Vacancy / Maint / Mgmt
- −$225
- Net cashflow
- $329
Break-even live
UW: 25.0% down · 7.5% · 30yr · 1.5% tax · 5.0% vac · 8.0% maint · 8.0% mgmt
Financing live
Cash to close
- Down payment
- $20,000
- Closing costs
- $2,400
- Reserves months
- —
- Total cash needed
- —
Loan-product check · same deal, 3 products live
Conventional
25% down · 7.5% · 30yr
- Down + closing
- —
- Monthly P&I
- —
- Monthly cashflow
- —
- DSCR
- —
- Eligible?
- —
Personal DTI + credit; lowest rate.
DSCR
20% down · 8.5% · 30yr
- Down + closing
- —
- Monthly P&I
- —
- Monthly cashflow
- —
- DSCR
- —
- Eligible?
- —
No personal income docs; deal must DSCR.
Hard money
10% down · 12.0% · 12mo
- Down + closing
- —
- Monthly P&I
- —
- Monthly cashflow
- —
- DSCR
- —
- Eligible?
- —
Short-term bridge; refi at stabilization.
Rent comps 6 comps
| Address | Beds | Baths | Sqft | Rent | $/sqft | DOM | Units | Dist |
|---|---|---|---|---|---|---|---|---|
| 55 Thompson Blvd Chickasaw, AL | 3.0 | 1.0 | 939 | $1,500 | $1.60 | 20d | 1 | 0.46mi |
| 101 Grant St Chickasaw, AL | 3.0 | 1.0 | 1383 | $895 | $0.65 | 13d | 1 | 0.56mi |
| 78 Lee St Chickasaw, AL | 3.0 | 1.0 | 1412 | $1,100 | $0.78 | 43d | 1 | 0.65mi |
| 408 Rawls Ave Mobile, AL | 2.0 | 1.0 | 1032 | $1,100 | $1.07 | 13d | 1 | 0.79mi |
| 311 Grant St Chickasaw, AL | 2.0 | 1.0 | 1000 | $850 | $0.85 | 43d | 1 | 0.87mi |
| 3 Southern St Chickasaw, AL | 3.0 | 1.0 | 1108 | $795 | $0.72 | 13d | 1 | 0.89mi |
Listing history 3 events
-
2026-03-31status Pending
-
2026-03-24$80,000 Active
-
2007-09-28soldstatus $47,000
ⓘ Source: listings_history table (triggers on properties + properties_extension) + one-shot
backfill from property_details.listing_events for pre-trigger history.
Tax reassessment forecast AL · Resets to sale price
- Current annual tax
- $755 · $63/mo
- Projected year-2 tax
- $755 · $63/mo
- Expected delta
- $0/yr ($0/mo · 0.0%)
ⓘ Screening estimate from a state-policy table — verify with the county assessor before closing.
Climate risk First Street
- Flood 1/10 Low FEMA zone X (unshaded) · 0% chance over 30 yrs
- Wildfire 2/10 Low
- Heat 9/10 Extreme 7 d/yr ≥104°F today · 21 d/yr by 30 yrs out
- Wind 9/10 Extreme 99% chance of damaging wind over 30 yrs
- Air quality 2/10 Low 1 unhealthy d/yr today · 2 by 30 yrs out
Nearby sold comps map
Loading sold comps map…
Walkable amenities ~0.75 mi
Loading nearby amenities…
Taxation est. · year 1
- Rental income
- $12,834
- − Mortgage interest
- −$4,481
- − Property taxes
- −$755
- − Insurance
- −$400
- − Repairs & maintenance
- −$1,027
- − Management
- −$1,027
- − Depreciation
- −$2,327
- Taxable income
- $2,817
- Est. tax owed @ 24.0%
- −$676
- After-tax cash flow
- $3,274/yr
For passive investors: Depreciation is non-cash, so a rental often shows a tax loss while cash-flowing — sheltering income. Rental losses are passive: they offset passive income freely, and up to $25,000/yr can offset ordinary (W-2) income if you actively participate and your MAGI is under $100k (phasing out to $0 by $150k); unused losses carry forward. On sale, claimed depreciation is recaptured at up to 25%, and gains may owe capital-gains tax (a 1031 exchange can defer both). Figures are a year-1 estimate at your 24.0% rate — not tax advice; consult a CPA.
Schools (NCES district)
No district data.
Livability — Chickasaw
- Score
- 61/100
- State rank
- #237
- US rank
- #17438
Category grades
Schools grade is shown separately in the Schools card above.
Census & demographics
- Census place
- Chickasaw, AL
- City population
- 6,367
- Population (ZIP)
- 6,367
Population outlook (Mobile County) Hauer SSP2
- Today (2025)
- 415,303 people
- By 2030
- 411,755 · -0.9%
- By 2040
- 399,670 · -3.8%
- By 2050
- 382,616 · -7.9%
- By 2075
- 337,353 · -18.8%
- By 2100
- 283,391 · -31.8%
Race, ethnicity, and origin ACS 2023
- Neighborhood character
- Diverse neighborhood (Simpson 0.56)
- Race & ethnicity
- Black 55% White 38% Two or more races 4% Hispanic / Latino 2% Asian 2%
- Common ancestry
- Lithuanian 2% Serbian 1% Italian 1%
- Foreign-born
- 3% · Canada, China
- Languages at home
- 98% English-only · Spanish 1% French/Haitian/Cajun 1%
Political lean MEDSL · Mobile
- 2024 margin
- R (+16.4) · D 41.3% · R 57.7%
- 2008→2024 swing
- -7.7pp toward R · 2008: -8.7pp · 2024: -16.4pp
- All cycles
- 2024: R+16.4 2020: R+11.9 2016: R+13.9 2012: R+9.3 2008: R+8.7
Not yet ingested
- Civics
- —
Market trends
- HPI YoY
- ▲ 12.90%
- Current HPI
- 196.621
- Rent YoY
- —
- Metro
- —
- State GDP YoY
- ▲ 2.94%
- F500 in state
- 4
Industry mix (Fortune 500 HQ in AL)
| Industry | F500 HQs | Revenue |
|---|---|---|
| Financial Services | 1 | $8B |
|
||
| Healthcare | 1 | $5B |
|
||
Price history
+70.2% since first listed3 events — show timeline
- 2026-03-31 Pending — GCMLS AL
- 2026-03-24 Listed $80,000 GCMLS AL
- 2007-09-28 Sold (Public Records) $47,000 Public Records
Property tax history
+0.0%/yrLatest (2025): $755 · +12.3% YoY. Source: county tax records.
Cash-flow waterfall
monthlySold comps — $/sqft
last 12 mo · ≤1 miLoading sold comps…