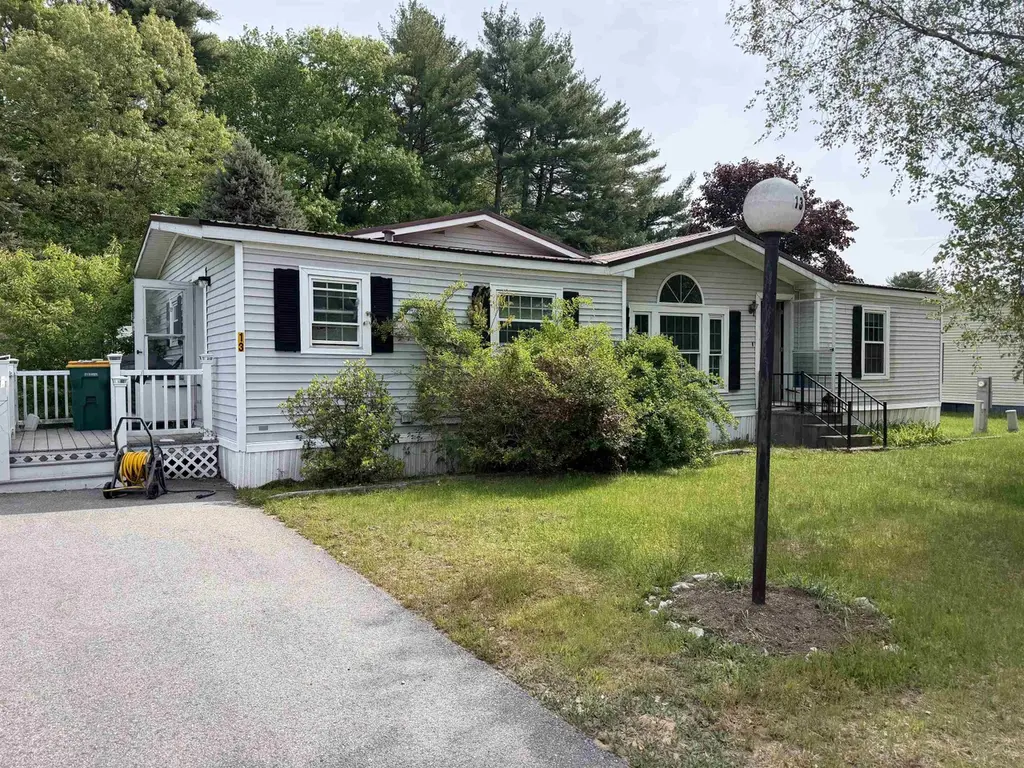
13 Caribbean Ln · Rochester, NH
Flood risk 1/10 · Minimal
- FEMA flood zone
- X (unshaded)
- Chance of flooding over 30 yrs
- 0.0%
- Est. flood insurance / yr
- $507 – $1,088
Fire risk 1/10 · Minimal
- Est. fire insurance / yr
- $507 – $941
Heat risk 4/10 · Minor
- Hot days now (above 97°F)
- 7 days/yr
- Hot days in 30 yrs
- 15 days/yr
Wind risk 4/10 · Minor
- Chance of severe wind over 30 yrs
- 21.0%
Air-quality risk 2/10 · Minimal
- Unhealthy air days now
- 1 days/yr
- Unhealthy air days in 30 yrs
- 1 days/yr
Risk factors via First Street. Map © Google.
Why this score? — see what drove the B- grade
The composite is a weighted blend of 9 inputs, each scored 0–100. Each bar is that input's sub-score; the figure is the points it added to the 100-point composite (weight × sub-score).
- Cash flow +27.2/30.0
- 1% rule +10.0/10.0
- DSCR +9.5/10.0
- ARV discount +7.5/15.0
- Livability +4.2/5.0
- Rent growth +3.6/5.0
- Schools +2.7/10.0
- Condition / age +2.5/5.0
- Appreciation +0.0/10.0
$120,000
🖨 Deal sheet 📄 Offer letter ✓ Due diligence
Listing remarks
Large open concept mobile home has a master suite huge walk in closet, sunporch, 3 bedrooms a deck outback and shed on a nice lot. Home has been cleaned out and ready for some repairs and a new owner. Located in one of Rochesters highly desired mobile home parks. Home needs work as listing price reflects. Cash offers only. Seller is conveying equitable title to this property. See disclosure. Town tax assessment is 207,900.00
Key facts
- Master suite
- Sunporch
- Shed
Tags
Property features AI
Finance
- Other: Common land acreage: 100 acres; Lot identifier: 0013
- HOA & community: Monthly park rent of $720; Park rent includes clubhouse; Briar Ridge co-op community
Exterior
- Parking: Paved driveway
- Utilities: Public water; Alternative septic system; Electric service 100 Amp (Eversource); Gas: LP/Bottle; Internet: unknown
- Home design: Manufactured/mobile home; Single-story (all principal rooms on main level); Tan exterior color; Faces unknown
- Construction: Wood frame construction; Metal roof; Built in 1988; Marlette mobile model 2835; Mobile serial number J1083083; Mobile park: Briar Ridge (co-op; park-approved)
- Exterior features: Leased lot; Level lot; Paved driveway; Paved road frontage
Interior
- Kitchen: Kitchen (main level); Refrigerator
- Bedrooms: Master bedroom suite (on main level); Additional bedroom (on main level)
- Bathrooms: Two full bathrooms
- Heating & cooling: Forced air heating
- Interior features: Seven rooms total; Living/dining area; Sunroom
- Laundry & utility: Washer; Dryer
Neighborhood map
What this means for you Summary
Snapshot
- This is a 3-bed/2.0-bath manufactured listed at $120k.
Deal economics
- At list price, monthly cash flow is $344 ($4k/yr) — positive.
- The deal already cash-flows at list — no discount required.
- Meets the 1% rule at list price ($3k rent vs $120k).
- Cap rate 9.7% vs local median 3.6% in Rochester — top-decile yield for the area; either an underpriced asset or a hidden risk that comps aren't pricing in. Stress-test before assuming the spread holds.
Location & tenants
- Location reads 84/100 on livability (#8 in NH, #698 nationally) — a professional / high-income tenant draw. Strengths: crime A+, commute A+, cost of living A+; Watch: amenities C-.
- Rochester School District (suburban): math 27% / reading 35% proficiency, ranked #83 of 98 in NH (top 85%) — families likely to look elsewhere, expect single-tenant / working-renter base with shorter leases.
- Market conditions: Rents rising fast (+4.2%/yr); 108 active listings in the ZIP; solid renter incomes; 951 units permitted in Strafford County in 2024 (551 in 5+ unit buildings).
- This rent runs 39% of the median local income ($79k/yr) — at the standard rent-burdened threshold; future hikes will face affordability resistance.
Forward outlook
- Local home prices are declining (-3.0%/yr); year-one equity from $830 of loan paydown is wiped out by about $4k of value loss. Plan a longer hold.
- Strafford County population projected at +7% by 2050 — modest demand growth; plan on rents tracking national, not racing it.
- At projected returns (-3.0% appreciation + 4.2% rent growth), your $34k cash investment doubles in ~8 years — after that, you're playing with house money.
Negotiation context
- Only 11 days on market — expect competitive offers; lowballing is unlikely to land.
- Current owner paid $60k; list at $120k implies a 99% gain — meaningful room to come down on a strong offer.
Risks & watch-outs
- Watch-outs: property tax is 2.7% of price; HOA is 28% of rent.
Questions for the listing agent
- Property tax is high relative to price — has the assessment been appealed recently, and will the sale trigger a re-assessment?
- What does the HOA fee cover, when was the last increase, and are there any pending special assessments or reserve-fund shortfalls?
- Is there a deadline driving the sale (1031 exchange, divorce, estate, relocation)? That informs how much negotiation room exists.
- What's the average days-on-market for RENTAL listings here right now (not sales)? A rising rental-DOM trend means longer vacancies and softer asking-rent achievability than the comps imply.
- What's the recent tenant-quality profile in this submarket — average credit score on applications, eviction rate, late-payment / NSF rate, and stable-employment percentage? A property-management company in the area should have these aggregated.
- How much new for-sale + rental construction is in the pipeline within 1–3 miles? Heavy new supply typically softens prices + rents 12–24 months out; constrained supply supports both.
Investment metrics
- 1% rule
- 2.12% ✓
- Cap rate
- 9.73%
- Cash-on-cash
- 12.29%
- DSCR
- 1.55
- GRM
- 3.9
CMA / ARV
- ARV (on-the-fly)
- $240,730
- Comps found
- 8
Show comp detail 8 sales within ~0.75 mi
| Address | Dist | Beds/Ba | Sqft | Sold | Price | $/sf | Match |
|---|---|---|---|---|---|---|---|
| 8 Lanai Dr | 0.14mi | 3/2.0 | 1,756 (-3%) | 9mo | $175,500 | $100 | 81 |
| 5 Bermuda Ln | 0.12mi | 3/2.0 | 1,693 (-6%) | 6mo | $200,000 | $118 | 78 |
| 44 Sagebrush Dr | 0.23mi | 2/2.0 (-1) | 1,793 (-1%) | 14mo | $302,000 | $168 | 71 |
| 13 Dockside Ln | 0.07mi | 2/2.0 (-1) | 1,604 (-11%) | 8mo | $234,900 | $146 | 66 |
| 44 Hawaii Ln | 0.22mi | 2/2.0 (-1) | 1,960 (+8%) | 9mo | $225,000 | $115 | 63 |
| 3 Falkland Ln | 0.17mi | 3/2.0 | 1,620 (-10%) | 22mo | $215,000 | $133 | 57 |
| 11 Blaine Ct | 0.65mi | 3/2.0 | 1,728 (-4%) | 12mo | $355,000 | $205 | 52 |
| 14 N Fuchsia Dr | 0.50mi | 3/2.0 | 1,652 (-9%) | 23mo | $205,000 | $124 | 43 |
Match score weights: distance 35% · size 25% · config 20% · recency 20%. Top-matched comps best support the ARV.
Projected returns pro-forma
-3.0% appreciation · 4.22% rent growth · sell at horizon
- IRR
- 4.6%
- Equity multiple
- 1.18×
- Total profit
- $6,181
- Equity at exit
- $17,892
- IRR
- 16.1%
- Equity multiple
- 2.46×
- Total profit
- $49,131
- Equity at exit
- $10,375
Cash invested: $33,600 (down + closing). Projections, not guarantees.
Landlord ↔ Tenant lean methodology
- Overall (STATE)
- 56 Moderately Landlord-Leaning
- State New Hampshire
- 56 Moderately Landlord-Leaning · D+1
- County
- — inherits STATE
- City
- — inherits STATE
ZIP-level market 03867
- Home prices YoY
- -22.0%
- Rents YoY
- 4.2%
- Active inventory
- 108
- Price-to-rent
- 3.9×
Monthly cashflow live
- Estimated rent
- $2,542 medium interval (Pro) →
- Mortgage (P&I)
- −$629
- Tax from tax record
- −$265 /mo · $3,181/yr
- Insurance
- −$50
- HOA
- −$720
- Vacancy / Maint / Mgmt
- −$534
- Net cashflow
- $344
Break-even live
UW: 25.0% down · 7.5% · 30yr · 1.5% tax · 5.0% vac · 8.0% maint · 8.0% mgmt
Financing live
Cash to close
- Down payment
- $30,000
- Closing costs
- $3,600
- Reserves months
- —
- Total cash needed
- —
Loan-product check · same deal, 3 products live
Conventional
25% down · 7.5% · 30yr
- Down + closing
- —
- Monthly P&I
- —
- Monthly cashflow
- —
- DSCR
- —
- Eligible?
- —
Personal DTI + credit; lowest rate.
DSCR
20% down · 8.5% · 30yr
- Down + closing
- —
- Monthly P&I
- —
- Monthly cashflow
- —
- DSCR
- —
- Eligible?
- —
No personal income docs; deal must DSCR.
Hard money
10% down · 12.0% · 12mo
- Down + closing
- —
- Monthly P&I
- —
- Monthly cashflow
- —
- DSCR
- —
- Eligible?
- —
Short-term bridge; refi at stabilization.
HOA detail
- Monthly dues
- $720 · $8,640/yr
Listing history 10 events
-
2026-06-13statusdays on market $120,000 Pending 11 DOM
-
2026-06-09days on market $120,000 Active 10 DOM
-
2026-06-08days on market $120,000 Active 9 DOM
-
2026-06-07days on market $120,000 Active 8 DOM
-
2026-06-04days on market $120,000 Active 5 DOM
-
2026-06-03days on market $120,000 Active 4 DOM
-
2026-06-02days on market $120,000 Active 3 DOM
-
2026-06-01days on market $120,000 Active 2 DOM
-
2026-05-31remarks 428-char remark
-
2026-05-31$120,000 Active 1 DOM
ⓘ Source: listings_history table (triggers on properties + properties_extension) + one-shot
backfill from property_details.listing_events for pre-trigger history.
Tax reassessment forecast NH · Partial reset (capped growth)
- Current annual tax
- $3,181 · $265/mo
- Projected year-2 tax
- $3,181 · $265/mo
- Expected delta
- $0/yr ($0/mo · 0.0%)
ⓘ Screening estimate from a state-policy table — verify with the county assessor before closing.
Climate risk First Street
- Flood 1/10 Low FEMA zone X (unshaded) · 0% chance over 30 yrs
- Wildfire 1/10 Low
- Heat 4/10 Moderate 7 d/yr ≥97°F today · 15 d/yr by 30 yrs out
- Wind 4/10 Moderate 21% chance of damaging wind over 30 yrs
- Air quality 2/10 Low 1 unhealthy d/yr today · 1 by 30 yrs out
Nearby sold comps map
Loading sold comps map…
Walkable amenities ~0.75 mi
Loading nearby amenities…
Taxation est. · year 1
- Rental income
- $30,509
- − Mortgage interest
- −$6,722
- − Property taxes
- −$3,181
- − Insurance
- −$600
- − Repairs & maintenance
- −$2,441
- − Management
- −$2,441
- − HOA
- −$8,640
- − Depreciation
- −$3,491
- Taxable income
- $2,993
- Est. tax owed @ 24.0%
- −$718
- After-tax cash flow
- $3,411/yr
For passive investors: Depreciation is non-cash, so a rental often shows a tax loss while cash-flowing — sheltering income. Rental losses are passive: they offset passive income freely, and up to $25,000/yr can offset ordinary (W-2) income if you actively participate and your MAGI is under $100k (phasing out to $0 by $150k); unused losses carry forward. On sale, claimed depreciation is recaptured at up to 25%, and gains may owe capital-gains tax (a 1031 exchange can defer both). Figures are a year-1 estimate at your 24.0% rate — not tax advice; consult a CPA.
Schools (NCES district)
- District
- Rochester School District
- NCES district ID
- 3305940
- Math proficiency
- 27% ▼ -15.00%
- Reading proficiency
- 35% ▼ -14.00%
- Median HH income
- $51,080
- Composite
- 27.11/100
- National rank
- #7039
- State rank
- #83 of 98 in NH
Livability — Rochester
- Score
- 84/100
- State rank
- #8
- US rank
- #698
Category grades
Schools grade is shown separately in the Schools card above.
Census & demographics
- Census place
- Rochester, NH
- County
- Strafford County · 75,181 people
- City population
- 22,732
- Metro
- Boston-Cambridge-Newton, MA-NH
- Population (ZIP)
- 22,732
- Household income
- $78,674
- Rent vs Own
- Severe rent burden
- 663.0
Population outlook (Strafford County) Hauer SSP2
- Today (2025)
- 132,503 people
- By 2030
- 135,377 · +2.2%
- By 2040
- 139,609 · +5.4%
- By 2050
- 141,803 · +7.0%
- By 2075
- 149,280 · +12.7%
- By 2100
- 148,667 · +12.2%
Race, ethnicity, and origin ACS 2023
- Neighborhood character
- Predominantly White (93%)
- Race & ethnicity
- White 93% Two or more races 4% Hispanic / Latino 2% Asian 1%
- Common ancestry
- Lithuanian 12% Romanian 2% Serbian 2%
- Foreign-born
- 3% · Canada
- Languages at home
- 96% English-only · Spanish 1% French/Haitian/Cajun 1%
Political lean MEDSL · Strafford
- 2024 margin
- D (+12.1) · D 55.5% · R 43.5% · Other 1.0%
- 2008→2024 swing
- -8.3pp toward R · 2008: 20.4pp · 2024: 12.1pp
- All cycles
- 2024: D+12.1 2020: D+15.2 2016: D+8.6 2012: D+14.5 2008: D+20.4
Not yet ingested
- Civics
- —
Market trends
- HPI YoY
- ▼ -107.34%
- Current HPI
- 379.5755
- Rent YoY
- ▲ 4.22%
- Metro
- Boston-Cambridge-Newton, MA-NH
- State GDP YoY
- —
- F500 in state
- 0
Price history
+99.0% since first listed2 events — show timeline
- 2026-05-30 Listed $120,000 PrimeMLS
- 1988-12-02 Sold (Public Records) $60,300 Public Records
Property tax history
+7.2%/yrLatest (2025): $3,181 · +3.0% YoY. Source: county tax records.
Cash-flow waterfall
monthlySold comps — $/sqft
last 12 mo · ≤1 miLoading sold comps…