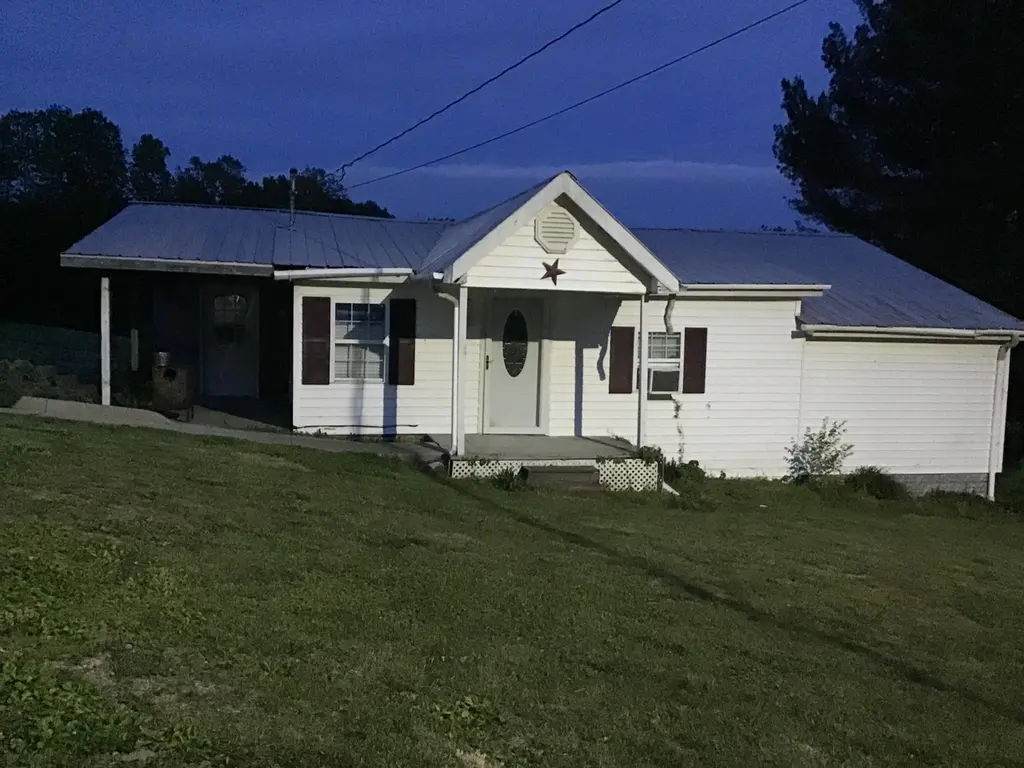
200 Brown Hollow Rd · McKinney, KY
Flood risk 1/10 · Minimal
- FEMA flood zone
- X (unshaded)
- Chance of flooding over 30 yrs
- 0.0%
- Est. flood insurance / yr
- $507 – $1,088
Fire risk 4/10 · Minor
- Est. fire insurance / yr
- $839 – $1,559
Heat risk 4/10 · Minor
- Hot days now (above 101°F)
- 7 days/yr
- Hot days in 30 yrs
- 20 days/yr
Wind risk 2/10 · Minimal
- Chance of severe wind over 30 yrs
- 3.0%
Air-quality risk 1/10 · Minimal
- Unhealthy air days now
- 0 days/yr
- Unhealthy air days in 30 yrs
- 0 days/yr
Risk factors via First Street. Map © Google.
Why this score? — see what drove the C grade
The composite is a weighted blend of 9 inputs, each scored 0–100. Each bar is that input's sub-score; the figure is the points it added to the 100-point composite (weight × sub-score).
- Cash flow +17.7/30.0
- ARV discount +15.0/15.0
- DSCR +5.5/10.0
- Appreciation +4.8/10.0
- 1% rule +3.5/10.0
- Rent growth +2.5/5.0
- Condition / age +2.5/5.0
- Schools +2.3/10.0
- Livability +2.2/5.0
$124,900
🖨 Deal sheet (PDF) 📄 Offer letter ✓ Due diligence
Listing remarks
" Calling all contractors, investors and ambitious buyers! Bring your vision to complete this home! They have already installed a new heating and air system. Drywall still needed in some areas. Design the kitchen to your liking. This home sits on 3 acres so could even build another house on property. Many options just needs a vision brought to life. Buying house as is. Will need to be cash offer or conventional loan.
Key facts
- 3 acres
- 3 acre lot
- Parking
Tags
Property features AI
Finance
- Other: Approximately 3.0 acres lot (public records); Building area approximately 1,312 total
Exterior
- Parking: Detached carport; Driveway; Carport present
- Utilities: Public water; Septic tank sewer; Electricity available; Cable available; Phone available; Water connected
- Home design: Single-story house
- Construction: Pillar/post/pier and slab foundation
- Exterior features: Metal roof; Vinyl siding; Shed(s) on the property
Interior
- Kitchen: No appliances included
- Bedrooms: Total rooms: 7 (includes bedrooms and other living spaces)
- Flooring: Carpet; Concrete
- Bathrooms: 1 full bathroom
- Heating & cooling: Heat pump heating; Electric cooling
- Interior features: Eat-in kitchen; Primary bedroom on the first floor; Blinds on windows
- Laundry & utility: Washer hookup; Electric dryer hookup
Neighborhood map
What this means for you Summary
Snapshot
- This is a 3-bed/1.0-bath single-family listed at $125k.
Deal economics
- At list price, monthly cash flow is $101 ($1k/yr) — positive.
- The deal already cash-flows at list — no discount required.
- To meet the 1% rule (rent ≥ 1% of price), the offer needs to be $107k (14.6% below list).
- Recommended offer: $107k (14.6% below list) — sets the bar for 1% rule.
Location & tenants
- Location reads 45/100 on livability (#518 in KY) — a working-class tenant base; expect higher turnover. Strengths: cost of living A+, crime A; Watch: amenities F, commute F, employment F.
- Lincoln County (rural): math 20% / reading 35% proficiency, ranked #131 of 165 in KY (top 79%) — low school quality limits family demand, transient renter base, plan for 1-2y turnover.
- Zoned schools: Hustonville Elementary School (math 37% / reading 37%, grade F, #255 of 676 statewide, top 42%, 432 students, 65% FRL); Lincoln County Middle School (math 18% / reading 38%, grade F, #165 of 217 statewide, top 77%, 745 students, 67% FRL); Lincoln County High School (math 24% / reading 32%, grade F, #151 of 254 statewide, top 61%, 951 students, 63% FRL).
- Market conditions: 27 active listings in the ZIP; 91 units permitted in Lincoln County in 2024 (0 in 5+ unit buildings).
Forward outlook
- In year one you build about $429 of equity ($864 loan paydown + $-435 appreciation (-0.3% local appreciation)).
- Lincoln County population projected at -23% by 2050 — secular population decline; favor cash flow + early exit over multi-decade hold.
Negotiation context
- It's been on market 44 days — a 3% lower offer ($121k) is reasonable based on typical stale-listing flexibility.
Risks & watch-outs
- Watch-outs: built in 1944 — expect roof / HVAC / electrical / plumbing capex.
Questions for the listing agent
- It's been on market 44 days. Have you received any prior offers? Is the seller open to a 15% concession, seller financing, or rate buy-down credit?
- Built in 1944 — when were the roof, HVAC, electrical panel, plumbing, and water heater last replaced?
- Is there a deadline driving the sale (1031 exchange, divorce, estate, relocation)? That informs how much negotiation room exists.
- Schools are B-rated — typically a magnet for longer-tenancy family renters. What's the average tenant stay here, and is there a school-zone premium baked into asking?
- What's the average days-on-market for RENTAL listings here right now (not sales)? A rising rental-DOM trend means longer vacancies and softer asking-rent achievability than the comps imply.
- What's the recent tenant-quality profile in this submarket — average credit score on applications, eviction rate, late-payment / NSF rate, and stable-employment percentage? A property-management company in the area should have these aggregated.
- How much new for-sale + rental construction is in the pipeline within 1–3 miles? Heavy new supply typically softens prices + rents 12–24 months out; constrained supply supports both.
Investment metrics
- 1% rule
- 0.85% ✗
- Cap rate
- 7.26%
- Cash-on-cash
- 3.46%
- DSCR
- 1.15
- GRM
- 9.8
CMA / ARV
- ARV (median comp)
- $153,818
- List price
- $124,900
- Delta
- -18.80%
- Verdict
- UNDERPRICED
- Comps
- 10 within 1.0 mi
Show comp detail 2 sales within ~0.75 mi
| Address | Dist | Beds/Ba | Sqft | Sold | Price | $/sf | Match |
|---|---|---|---|---|---|---|---|
| 8925 KY 698 | 0.28mi | 3/1.0 | 1,368 (+4%) | 17mo | $182,500 | $133 | 66 |
| 265 Brown Hollow Rd | 0.06mi | 4/2.0 (+1) | 1,504 (+15%) | 15mo | $85,000 | $57 | 51 |
Match score weights: distance 35% · size 25% · config 20% · recency 20%. Top-matched comps best support the ARV.
Projected returns pro-forma
-0.35% appreciation · 3.0% rent growth · sell at horizon
- IRR
- 0.4%
- Equity multiple
- 1.02×
- Total profit
- $675
- Equity at exit
- $34,106
- IRR
- 6.3%
- Equity multiple
- 1.65×
- Total profit
- $22,742
- Equity at exit
- $39,311
Cash invested: $34,972 (down + closing). Projections, not guarantees.
Landlord ↔ Tenant lean methodology
- Overall (STATE)
- 83 Strongly Landlord-Friendly
- State Kentucky
- 83 Strongly Landlord-Friendly · R+16
- County
- — inherits STATE
- City
- — inherits STATE
ZIP-level market 40437
- Home prices YoY
- -0.1%
- Active inventory
- 27
- Price-to-rent
- 9.8×
Monthly cashflow live
- Estimated rent
- $1,066 medium interval (Pro) →
- Mortgage (P&I)
- −$655
- Tax from tax record
- −$34 /mo · $412/yr
- Insurance
- −$52
- HOA
- −$0
- Vacancy / Maint / Mgmt
- −$224
- Net cashflow
- $101
Break-even live
Sensitivity live
| Price | -10% $171 | -5% $136 | +0% $101 | +5% $65 | +10% $30 |
|---|---|---|---|---|---|
| Rent | -10% $17 | -5% $59 | +0% $101 | +5% $143 | +10% $185 |
| Rate | -1.0pp $164 | -0.5pp $133 | base $101 | +0.5pp $68 | +1.0pp $35 |
UW: 25.0% down · 7.5% · 30yr · 1.5% tax · 5.0% vac · 8.0% maint · 8.0% mgmt
Financing live
Cash to close
- Down payment
- $31,225
- Closing costs
- $3,747
- Reserves months
- —
- Total cash needed
- —
Loan-product check · same deal, 3 products live
Conventional
25% down · 7.5% · 30yr
- Down + closing
- —
- Monthly P&I
- —
- Monthly cashflow
- —
- DSCR
- —
- Eligible?
- —
Personal DTI + credit; lowest rate.
DSCR
20% down · 8.5% · 30yr
- Down + closing
- —
- Monthly P&I
- —
- Monthly cashflow
- —
- DSCR
- —
- Eligible?
- —
No personal income docs; deal must DSCR.
Hard money
10% down · 12.0% · 12mo
- Down + closing
- —
- Monthly P&I
- —
- Monthly cashflow
- —
- DSCR
- —
- Eligible?
- —
Short-term bridge; refi at stabilization.
Listing history 17 events
-
2026-06-19days on market $124,900 Active 44 DOM
-
2026-06-18days on market $124,900 Active 43 DOM
-
2026-06-17days on market $124,900 Active 42 DOM
-
2026-06-16days on market $124,900 Active 41 DOM
-
2026-06-15days on market $124,900 Active 40 DOM
-
2026-06-14days on market $124,900 Active 38 DOM
-
2026-06-12days on market $124,900 Active 37 DOM
-
2026-06-09days on market $124,900 Active 34 DOM
-
2026-06-08days on market $124,900 Active 33 DOM
-
2026-06-07days on market $124,900 Active 32 DOM
-
2026-06-07days on market $124,900 Active 31 DOM
-
2026-06-03days on market $124,900 Active 28 DOM
-
2026-06-02days on market $124,900 Active 27 DOM
-
2026-06-01days on market $124,900 Active 26 DOM
-
2026-05-31days on market $124,900 Active 25 DOM
-
2026-05-30days on market $124,900 Active 24 DOM
-
2026-05-01$124,900 Active 428-char remark
ⓘ Source: listings_history table (triggers on properties + properties_extension) + one-shot
backfill from property_details.listing_events for pre-trigger history.
Tax reassessment forecast KY · Resets to sale price
- Current annual tax
- $412 · $34/mo
- Projected year-2 tax
- $1,074 · $90/mo
- Expected delta
- +$662/yr (+$55/mo · 160.4%)
ⓘ Screening estimate from a state-policy table — verify with the county assessor before closing.
Climate risk First Street
- Flood 1/10 Low FEMA zone X (unshaded) · 0% chance over 30 yrs
- Wildfire 4/10 Moderate
- Heat 4/10 Moderate 7 d/yr ≥101°F today · 20 d/yr by 30 yrs out
- Wind 2/10 Low 3% chance of damaging wind over 30 yrs
- Air quality 1/10 Low 0 unhealthy d/yr today · 0 by 30 yrs out
Nearby sold comps map
Loading sold comps map…
Walkable amenities ~0.75 mi
Loading nearby amenities…
Taxation est. · year 1
- Rental income
- $12,793
- − Mortgage interest
- −$6,996
- − Property taxes
- −$412
- − Insurance
- −$624
- − Repairs & maintenance
- −$1,023
- − Management
- −$1,023
- − Depreciation
- −$3,633
- Taxable loss
- −$921
- Est. tax savings @ 24.0%
- +$221
- After-tax cash flow
- $1,430/yr
For passive investors: Depreciation is non-cash, so a rental often shows a tax loss while cash-flowing — sheltering income. Rental losses are passive: they offset passive income freely, and up to $25,000/yr can offset ordinary (W-2) income if you actively participate and your MAGI is under $100k (phasing out to $0 by $150k); unused losses carry forward. On sale, claimed depreciation is recaptured at up to 25%, and gains may owe capital-gains tax (a 1031 exchange can defer both). Figures are a year-1 estimate at your 24.0% rate — not tax advice; consult a CPA.
Schools (NCES district)
- District
- Lincoln County
- NCES district ID
- 2103480
- Math proficiency
- 20% ▼ -18.00%
- Reading proficiency
- 35% ▼ -16.00%
- Median HH income
- $35,356
- Composite
- 22.68/100
- National rank
- #8042
- State rank
- #131 of 165 in KY
Livability — McKinney
- Score
- 45/100
- State rank
- #518
- US rank
- #26477
Category grades
Schools grade is shown separately in the Schools card above.
Census & demographics
- Population (ZIP)
- 4,488
Population outlook (Lincoln County) Hauer SSP2
- Today (2025)
- 23,293 people
- By 2030
- 22,392 · -3.9%
- By 2040
- 20,336 · -12.7%
- By 2050
- 18,016 · -22.7%
- By 2075
- 12,976 · -44.3%
- By 2100
- 8,446 · -63.7%
Race, ethnicity, and origin ACS 2023
- Neighborhood character
- Predominantly White (94%)
- Race & ethnicity
- White 94% Two or more races 2%
- Common ancestry
- Italian 3% Slovak 3% Serbian 2%
- Foreign-born
- 0%
- Languages at home
- 97% English-only · Spanish 2% Other Asian/Pacific 1%
Political lean MEDSL · Lincoln
- 2024 margin
- Solid R (+61.2) · D 18.9% · R 80.0% · Other 1.1%
- 2008→2024 swing
- -22.7pp toward R · 2008: -38.5pp · 2024: -61.2pp
- All cycles
- 2024: R+61.2 2020: R+57.1 2016: R+57.3 2012: R+41.9 2008: R+38.5
Not yet ingested
- Civics
- —
Market trends
- HPI YoY
- ▼ -0.35%
- Current HPI
- 256.6402
- Rent YoY
- —
- Metro
- —
- State GDP YoY
- ▲ 1.81%
- F500 in state
- 4
Industry mix (Fortune 500 HQ in KY)
| Industry | F500 HQs | Revenue |
|---|---|---|
| Healthcare | 1 | $118B |
|
||
| Food / Beverage | 1 | $7B |
|
||
Price history
1 event — show timeline
- 2026-05-01 Listed $124,900 ImagineMLS
Property tax history
+20.6%/yrLatest (2025): $412 · -4.3% YoY. Source: county tax records.
Cash-flow waterfall
monthlySold comps — $/sqft
last 12 mo · ≤1 miLoading sold comps…