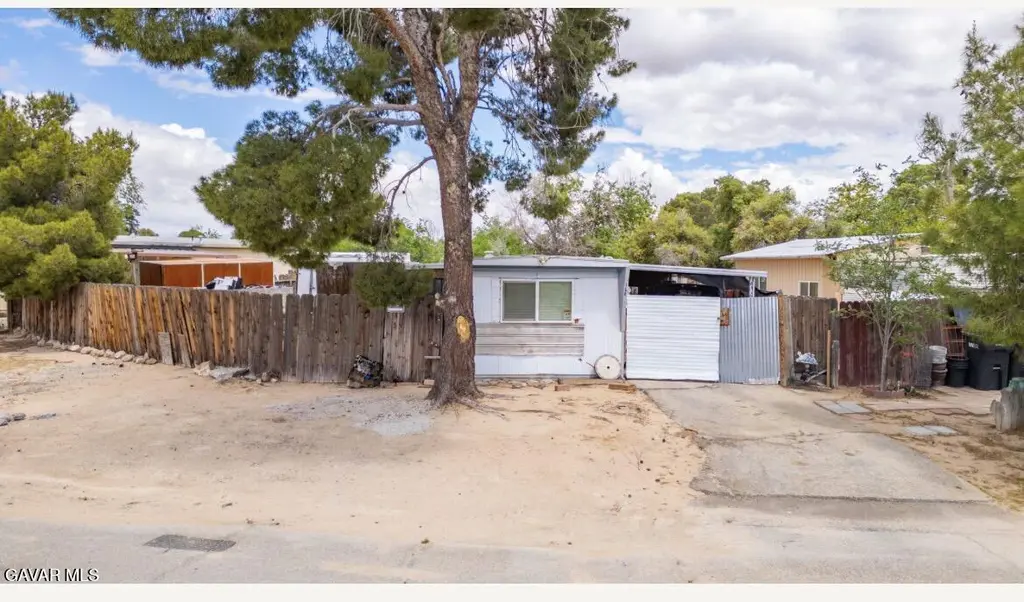
168 Camp Fire Dr #0 · California City, CA
Flood risk 1/10 · Minimal
- FEMA flood zone
- X (unshaded)
- Chance of flooding over 30 yrs
- 0.0%
- Est. flood insurance / yr
- $507 – $1,088
Fire risk 1/10 · Minimal
- Est. fire insurance / yr
- $659 – $1,223
Heat risk 8/10 · Major
- Hot days now (above 101°F)
- 3 days/yr
- Hot days in 30 yrs
- 9 days/yr
Wind risk 1/10 · Minimal
- Chance of severe wind over 30 yrs
- —
Air-quality risk 7/10 · Major
- Unhealthy air days now
- 13 days/yr
- Unhealthy air days in 30 yrs
- 15 days/yr
Risk factors via First Street. Map © Google.
Why this score? — see what drove the B grade
The composite is a weighted blend of 9 inputs, each scored 0–100. Each bar is that input's sub-score; the figure is the points it added to the 100-point composite (weight × sub-score).
- Cash flow +27.5/30.0
- Appreciation +10.0/10.0
- DSCR +9.6/10.0
- ARV discount +7.5/15.0
- 1% rule +6.2/10.0
- Rent growth +3.9/5.0
- Condition / age +2.5/5.0
- Livability +2.2/5.0
- Schools +2.1/10.0
$129,900
🖨 Deal sheet (PDF) 📄 Offer letter ✓ Due diligence
Listing remarks MLS
Affordable Living in California City! Don't miss this renovated mobile home offering 2 Bedrooms, 1 bathrooms, designed for comfort and convenience. Enjoy a fully fenced yard that provides privacy and space for outdoor living. Best of all -No Land Lease fee! Ideally located near amenities, making commuting and errands a breeze. Perfect opportunity for homeowners or investors looking for value in a growing area.
Key facts
- No land lease fee
- Fully fenced yard
- 4,356 sq ft lot
Tags
Neighborhood map
What this means for you Summary
Snapshot
- This is a 2-bed/1.0-bath single-family listed at $130k.
Deal economics
- At list price, monthly cash flow is $382 ($5k/yr) — positive.
- The deal already cash-flows at list — no discount required.
- Meets the 1% rule at list price ($1k rent vs $130k).
- Recommended offer: $122k (6.0% below list) — sets the bar for market timing.
- Cap rate 9.8% vs local median 5.2% in California City — top-decile yield for the area; either an underpriced asset or a hidden risk that comps aren't pricing in. Stress-test before assuming the spread holds.
Location & tenants
- Location reads 44/100 on livability (#1,329 in CA) — a working-class tenant base; expect higher turnover. Strengths: housing A+; Watch: crime F, amenities F, commute F.
- Mojave Unified (town): math 25% / reading 25% proficiency, ranked #411 of 517 in CA (top 80%) — low school quality limits family demand, transient renter base, plan for 1-2y turnover; 76% free/reduced lunch — lower-income household profile, screen leases tightly.
- Zoned schools: Hacienda Elementary (528 students, 92% FRL); California City Middle (501 students, 87% FRL); California City High (655 students, 85% FRL).
- Market conditions: Rents rising fast (+5.5%/yr); 704 active listings in the ZIP; 3,244 units permitted in Kern County in 2024 (73 in 5+ unit buildings).
Forward outlook
- In year one you build about $14k of equity ($898 loan paydown + $13k appreciation (10.0% local appreciation)).
- Kern County population projected at +17% by 2050 — long-run rental-demand tailwind backs the buy-and-hold thesis.
- At projected returns (10.0% appreciation + 5.5% rent growth), your $36k cash investment doubles in ~2 years — after that, you're playing with house money.
- By year 3, paydown + projected appreciation supports a ~$35k cash-out refi (75% LTV) — recoverable capital for the next deal without selling this one.
Negotiation context
- It's been on market 63 days — a 6% lower offer ($122k) is reasonable based on typical stale-listing flexibility.
Risks & watch-outs
- Climate carrying-cost: extreme-heat days projected 3→9/yr by 2055 (HVAC capex compounding) — expect insurance premiums to compound above CPI over the hold.
Questions for the listing agent
- It's been on market 63 days. Have you received any prior offers? Is the seller open to a 6% concession, seller financing, or rate buy-down credit?
- Why hasn't it sold? Are there any deal-killer items the seller is aware of (foundation, flood, title, zoning, code violations)?
- Is there a deadline driving the sale (1031 exchange, divorce, estate, relocation)? That informs how much negotiation room exists.
- Schools are F-rated, which usually means shorter tenancies and higher turnover. Who's the typical renter profile here, and what's been the actual vacancy rate?
- Crime grade is F in this area — have there been break-ins, vandalism, or insurance claims at this property in the last 3 years? What carrier currently insures it and at what premium?
- What's the average days-on-market for RENTAL listings here right now (not sales)? A rising rental-DOM trend means longer vacancies and softer asking-rent achievability than the comps imply.
- What's the recent tenant-quality profile in this submarket — average credit score on applications, eviction rate, late-payment / NSF rate, and stable-employment percentage? A property-management company in the area should have these aggregated.
- How much new for-sale + rental construction is in the pipeline within 1–3 miles? Heavy new supply typically softens prices + rents 12–24 months out; constrained supply supports both.
Investment metrics
- 1% rule
- 1.12% ✓
- Cap rate
- 9.82%
- Cash-on-cash
- 12.61%
- DSCR
- 1.56
- GRM
- 7.4
CMA / ARV
- ARV (median comp)
- $64,006
- List price
- $129,900
- Delta
- 102.95%
- Verdict
- OVERPRICED
- Comps
- 1 within 2.0 mi
Projected returns pro-forma
10.0% appreciation · 5.45% rent growth · sell at horizon
- IRR
- 34.6%
- Equity multiple
- 3.71×
- Total profit
- $98,704
- Equity at exit
- $117,024
- IRR
- 30.5%
- Equity multiple
- 8.69×
- Total profit
- $279,645
- Equity at exit
- $252,367
Cash invested: $36,372 (down + closing). Projections, not guarantees.
Landlord ↔ Tenant lean methodology
- Overall (STATE)
- 18 Strongly Tenant-Friendly
- State California
- 18 Strongly Tenant-Friendly · D+13
- County
- — inherits STATE
- City
- — inherits STATE
ZIP-level market 93505
- Home prices YoY
- 13.0%
- Rents YoY
- 5.5%
- Active inventory
- 704
- Price-to-rent
- 7.4×
Monthly cashflow live
- Estimated rent
- $1,455 medium interval (Pro) →
- Mortgage (P&I)
- −$681
- Tax from tax record
- −$32 /mo · $384/yr
- Insurance
- −$54
- HOA
- −$0
- Vacancy / Maint / Mgmt
- −$306
- Net cashflow
- $382
Break-even live
Sensitivity live
| Price | -10% $456 | -5% $419 | +0% $382 | +5% $345 | +10% $309 |
|---|---|---|---|---|---|
| Rent | -10% $267 | -5% $325 | +0% $382 | +5% $440 | +10% $497 |
| Rate | -1.0pp $448 | -0.5pp $415 | base $382 | +0.5pp $349 | +1.0pp $314 |
UW: 25.0% down · 7.5% · 30yr · 1.5% tax · 5.0% vac · 8.0% maint · 8.0% mgmt
Financing live
Cash to close
- Down payment
- $32,475
- Closing costs
- $3,897
- Reserves months
- —
- Total cash needed
- —
Loan-product check · same deal, 3 products live
Conventional
25% down · 7.5% · 30yr
- Down + closing
- —
- Monthly P&I
- —
- Monthly cashflow
- —
- DSCR
- —
- Eligible?
- —
Personal DTI + credit; lowest rate.
DSCR
20% down · 8.5% · 30yr
- Down + closing
- —
- Monthly P&I
- —
- Monthly cashflow
- —
- DSCR
- —
- Eligible?
- —
No personal income docs; deal must DSCR.
Hard money
10% down · 12.0% · 12mo
- Down + closing
- —
- Monthly P&I
- —
- Monthly cashflow
- —
- DSCR
- —
- Eligible?
- —
Short-term bridge; refi at stabilization.
Listing history 13 events
-
2026-06-15days on market $129,900 Active 63 DOM
-
2026-06-14days on market $129,900 Active 61 DOM
-
2026-06-13days on market $129,900 Active 60 DOM
-
2026-06-10days on market $129,900 Active 58 DOM
-
2026-06-09days on market $129,900 Active 57 DOM
-
2026-06-08days on market $129,900 Active 56 DOM
-
2026-06-07days on market $129,900 Active 55 DOM
-
2026-06-05days on market $129,900 Active 52 DOM
-
2026-06-03days on market $129,900 Active 51 DOM
-
2026-06-03days on market $129,900 Active 50 DOM
-
2026-06-01days on market $129,900 Active 49 DOM
-
2026-05-31days on market $129,900 Active 48 DOM
-
2026-04-13$129,900 Active 413-char remark
Show marketing remark (413 chars)
Affordable Living in California City! Don't miss this renovated mobile home offering 2 Bedrooms, 1 bathrooms, designed for comfort and convenience. Enjoy a fully fenced yard that provides privacy and space for outdoor living. Best of all -No Land Lease fee! Ideally located near amenities, making commuting and errands a breeze. Perfect opportunity for homeowners or investors looking for value in a growing area.
ⓘ Source: listings_history table (triggers on properties + properties_extension) + one-shot
backfill from property_details.listing_events for pre-trigger history.
Tax reassessment forecast CA · Resets to sale price
- Current annual tax
- $384 · $32/mo
- Projected year-2 tax
- $987 · $82/mo
- Expected delta
- +$604/yr (+$50/mo · 157.3%)
ⓘ Screening estimate from a state-policy table — verify with the county assessor before closing.
Climate risk First Street
- Flood 1/10 Low FEMA zone X (unshaded) · 0% chance over 30 yrs
- Wildfire 1/10 Low
- Heat 8/10 Severe 3 d/yr ≥101°F today · 9 d/yr by 30 yrs out
- Wind 1/10 Low
- Air quality 7/10 Severe 13 unhealthy d/yr today · 15 by 30 yrs out
Nearby sold comps map
Loading sold comps map…
Walkable amenities ~0.75 mi
Loading nearby amenities…
Taxation est. · year 1
- Rental income
- $17,461
- − Mortgage interest
- −$7,276
- − Property taxes
- −$384
- − Insurance
- −$650
- − Repairs & maintenance
- −$1,397
- − Management
- −$1,397
- − Depreciation
- −$3,779
- Taxable income
- $2,578
- Est. tax owed @ 24.0%
- −$619
- After-tax cash flow
- $3,967/yr
For passive investors: Depreciation is non-cash, so a rental often shows a tax loss while cash-flowing — sheltering income. Rental losses are passive: they offset passive income freely, and up to $25,000/yr can offset ordinary (W-2) income if you actively participate and your MAGI is under $100k (phasing out to $0 by $150k); unused losses carry forward. On sale, claimed depreciation is recaptured at up to 25%, and gains may owe capital-gains tax (a 1031 exchange can defer both). Figures are a year-1 estimate at your 24.0% rate — not tax advice; consult a CPA.
Schools (NCES district)
- District
- Mojave Unified
- NCES district ID
- 0625230
- Math proficiency
- 25% ▲ 11.00%
- Reading proficiency
- 25% ▼ -1.00%
- Median HH income
- $43,017
- Composite
- 21.4/100
- National rank
- #8350
- State rank
- #411 of 517 in CA
Livability — California City
- Score
- 44/100
- State rank
- #1329
- US rank
- #26753
Category grades
Schools grade is shown separately in the Schools card above.
Census & demographics
- Census place
- California City, CA
- County
- Kern County · 710,371 people
- City population
- 14,353
- Metro
- Bakersfield, CA
- Population (ZIP)
- 14,353
- Household income
- $59,827
- Rent vs Own
- Severe rent burden
- 883.0
Population outlook (Kern County) Hauer SSP2
- Today (2025)
- 947,286 people
- By 2030
- 978,984 · +3.3%
- By 2040
- 1,045,018 · +10.3%
- By 2050
- 1,105,232 · +16.7%
- By 2075
- 1,229,538 · +29.8%
- By 2100
- 1,238,059 · +30.7%
Race, ethnicity, and origin ACS 2023
- Neighborhood character
- Highly diverse neighborhood (Simpson 0.70)
- Race & ethnicity
- Hispanic / Latino 40% White 30% Black 22% Two or more races 16% Native American 3% Asian 1%
- Hispanic origin (detail)
- Mexican 29%
- Common ancestry
- Italian 3% Lithuanian 1% Romanian 1%
- Foreign-born
- 13% · Canada, Dominican Republic
- Languages at home
- 68% English-only · Spanish 29%
Political lean MEDSL · Kern
- 2024 margin
- Strong R (+21.1) · D 38.2% · R 59.3% · Other 2.5%
- 2008→2024 swing
- -3.3pp toward R · 2008: -17.8pp · 2024: -21.1pp
- All cycles
- 2024: R+21.1 2020: R+10.2 2016: R+15.0 2012: R+20.9 2008: R+17.8
Not yet ingested
- Civics
- —
Market trends
- HPI YoY
- ▲ 46.32%
- Current HPI
- 402.4192
- Rent YoY
- ▲ 5.45%
- Metro
- Bakersfield, CA
- State GDP YoY
- ▲ 3.21%
- F500 in state
- 116
Industry mix (Fortune 500 HQ in CA)
| Industry | F500 HQs | Revenue |
|---|---|---|
| Technology | 27 | $1,492B |
|
||
| Financial Services | 3 | $174B |
|
||
| Retail | 3 | $44B |
|
||
| Insurance | 3 | $26B |
|
||
| Media / Entertainment | 2 | $115B |
|
||
| Pharmaceuticals / Biotech | 2 | $62B |
|
||
Price history
1 event — show timeline
- 2026-04-13 Listed $129,900 AVMLS
Property tax history
+5.0%/yrLatest (2025): $384 · -1.7% YoY. Source: county tax records.
Cash-flow waterfall
monthlySold comps — $/sqft
last 12 mo · ≤1 miLoading sold comps…