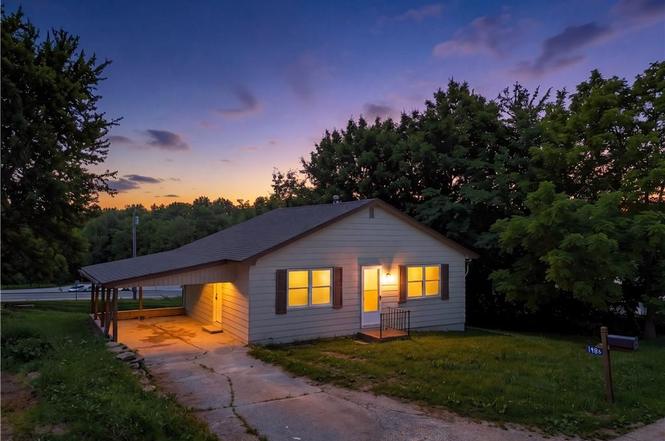
19860 E Elm St · Princeton, MO
Flood risk 1/10 · Minimal
- FEMA flood zone
- X (unshaded)
- Chance of flooding over 30 yrs
- 0.0%
- Est. flood insurance / yr
- $507 – $1,088
Fire risk 5/10 · Moderate
- Est. fire insurance / yr
- $1,054 – $1,958
Heat risk 3/10 · Minor
- Hot days now (above 104°F)
- 7 days/yr
- Hot days in 30 yrs
- 15 days/yr
Wind risk 2/10 · Minimal
- Chance of severe wind over 30 yrs
- —
Air-quality risk 1/10 · Minimal
- Unhealthy air days now
- 0 days/yr
- Unhealthy air days in 30 yrs
- 0 days/yr
Risk factors via First Street. Map © Google.
Why this score? — see what drove the B+ grade
The composite is a weighted blend of 9 inputs, each scored 0–100. Each bar is that input's sub-score; the figure is the points it added to the 100-point composite (weight × sub-score).
- Cash flow +30.0/30.0
- 1% rule +10.0/10.0
- DSCR +10.0/10.0
- ARV discount +7.5/15.0
- Appreciation +5.3/10.0
- Schools +4.2/10.0
- Livability +3.2/5.0
- Rent growth +2.5/5.0
- Condition / age +2.5/5.0
$49,900
🖨 Deal sheet 📄 Offer letter ✓ Due diligence
Listing remarks
Completely remodeled and move-in ready! This charming 1-bedroom, 1-bath home offers low-maintenance living with all the comforts of modern updates. Inside, you'll find an open-concept layout that seamlessly connects the living room, dining area, kitchen, and laundry space, creating a bright and functional living environment. With approximately 720 square feet, this thoughtfully updated home makes excellent use of every inch of space. The single-level floor plan features no interior steps, providing easy accessibility and everyday convenience. Recent improvements throughout the home allow you to move in and enjoy without the hassle of renovation projects. Outside, the attached carport provid
Key facts
- Spacious yard
- Attached carport
- Conveniently located
Tags
Property features AI
Finance
- Other: Lot size about 0.23 acres
- HOA & community: No association fees
Exterior
- Parking: Attached carport; 1 garage space
- Utilities: Public water; Public sewer
- Home design: Single-family residence; Residential property; Faces north; One-story
- Construction: Frame construction; Composition roof; Estimated age: 76–100 years
- Exterior features: Not in a flood plain; Directions: Heading north on 65 into Princeton, turn east on Elm St.; home is on the right
Interior
- Kitchen: Kitchen on main level
- Bedrooms: 1 bedroom (first floor)
- Bathrooms: 1 full bathroom (first floor)
- Heating & cooling: Natural gas heating; Wall furnace; Has cooling (type: other)
- Interior features: Ranch floor plan; Slab basement
Neighborhood map
What this means for you Summary
Snapshot
- This is a 1-bed/1.0-bath other listed at $50k.
Deal economics
- At list price, monthly cash flow is $448 ($5k/yr) — positive.
- The deal already cash-flows at list — no discount required.
- Meets the 1% rule at list price ($948 rent vs $50k).
Location & tenants
- Location reads 63/100 on livability (#355 in MO) — a middle-class / working-renter tenant base. Strengths: cost of living A+, crime B+, housing B+; Watch: employment D+, amenities F, commute F.
- Princeton R-V (rural): math 50% / reading 45% proficiency, ranked #158 of 535 in MO (top 30%) — families likely to look elsewhere, expect single-tenant / working-renter base with shorter leases.
- Market conditions: 24 active listings in the ZIP.
Forward outlook
- In year one you build about $637 of equity ($345 loan paydown + $292 appreciation (0.6% local appreciation)).
- Mercer County population projected at -18% by 2050 — secular population decline; favor cash flow + early exit over multi-decade hold.
- At projected returns (0.6% appreciation + 3.0% rent growth), your $14k cash investment doubles in ~3 years — after that, you're playing with house money.
Negotiation context
- Only 4 days on market — expect competitive offers; lowballing is unlikely to land.
Risks & watch-outs
- Watch-outs: built in 1942 — expect roof / HVAC / electrical / plumbing capex.
- Climate carrying-cost: moderate wildfire risk — expect insurance premiums to compound above CPI over the hold.
Questions for the listing agent
- Built in 1942 — when were the roof, HVAC, electrical panel, plumbing, and water heater last replaced?
- Is there a deadline driving the sale (1031 exchange, divorce, estate, relocation)? That informs how much negotiation room exists.
- What's the average days-on-market for RENTAL listings here right now (not sales)? A rising rental-DOM trend means longer vacancies and softer asking-rent achievability than the comps imply.
- What's the recent tenant-quality profile in this submarket — average credit score on applications, eviction rate, late-payment / NSF rate, and stable-employment percentage? A property-management company in the area should have these aggregated.
- How much new for-sale + rental construction is in the pipeline within 1–3 miles? Heavy new supply typically softens prices + rents 12–24 months out; constrained supply supports both.
Investment metrics
- 1% rule
- 1.90% ✓
- Cap rate
- 17.06%
- Cash-on-cash
- 38.47%
- DSCR
- 2.71
- GRM
- 4.4
CMA / ARV
No comps found within radius.
Projected returns pro-forma
0.59% appreciation · 3.0% rent growth · sell at horizon
- IRR
- 40.3%
- Equity multiple
- 3.04×
- Total profit
- $28,443
- Equity at exit
- $15,968
- IRR
- 42.7%
- Equity multiple
- 5.98×
- Total profit
- $69,605
- Equity at exit
- $20,417
Cash invested: $13,972 (down + closing). Projections, not guarantees.
Landlord ↔ Tenant lean methodology
- Overall (STATE)
- 81 Strongly Landlord-Friendly
- State Missouri
- 81 Strongly Landlord-Friendly · R+10
- County
- — inherits STATE
- City
- — inherits STATE
ZIP-level market 64673
- Home prices YoY
- 0.3%
- Active inventory
- 24
- Price-to-rent
- 4.4×
Monthly cashflow live
- Estimated rent
- $948 medium interval (Pro) →
- Mortgage (P&I)
- −$262
- Tax from tax record
- −$19 /mo · $223/yr
- Insurance
- −$21
- HOA
- −$0
- Vacancy / Maint / Mgmt
- −$199
- Net cashflow
- $448
Break-even live
UW: 25.0% down · 7.5% · 30yr · 1.5% tax · 5.0% vac · 8.0% maint · 8.0% mgmt
Financing live
Cash to close
- Down payment
- $12,475
- Closing costs
- $1,497
- Reserves months
- —
- Total cash needed
- —
Loan-product check · same deal, 3 products live
Conventional
25% down · 7.5% · 30yr
- Down + closing
- —
- Monthly P&I
- —
- Monthly cashflow
- —
- DSCR
- —
- Eligible?
- —
Personal DTI + credit; lowest rate.
DSCR
20% down · 8.5% · 30yr
- Down + closing
- —
- Monthly P&I
- —
- Monthly cashflow
- —
- DSCR
- —
- Eligible?
- —
No personal income docs; deal must DSCR.
Hard money
10% down · 12.0% · 12mo
- Down + closing
- —
- Monthly P&I
- —
- Monthly cashflow
- —
- DSCR
- —
- Eligible?
- —
Short-term bridge; refi at stabilization.
Listing history 5 events
-
2026-06-18days on market $49,900 Active 4 DOM
-
2026-06-17days on market $49,900 Active 3 DOM
-
2026-06-16days on market $49,900 Active 2 DOM
-
2026-06-15remarks 699-char remark
-
2026-06-15$49,900 Active 1 DOM
ⓘ Source: listings_history table (triggers on properties + properties_extension) + one-shot
backfill from property_details.listing_events for pre-trigger history.
Tax reassessment forecast MO · Resets to sale price
- Current annual tax
- $223 · $19/mo
- Projected year-2 tax
- $484 · $40/mo
- Expected delta
- +$261/yr (+$22/mo · 116.9%)
ⓘ Screening estimate from a state-policy table — verify with the county assessor before closing.
Climate risk First Street
- Flood 1/10 Low FEMA zone X (unshaded) · 0% chance over 30 yrs
- Wildfire 5/10 Major
- Heat 3/10 Moderate 7 d/yr ≥104°F today · 15 d/yr by 30 yrs out
- Wind 2/10 Low
- Air quality 1/10 Low 0 unhealthy d/yr today · 0 by 30 yrs out
Nearby sold comps map
Loading sold comps map…
Walkable amenities ~0.75 mi
Loading nearby amenities…
Taxation est. · year 1
- Rental income
- $11,376
- − Mortgage interest
- −$2,795
- − Property taxes
- −$223
- − Insurance
- −$250
- − Repairs & maintenance
- −$910
- − Management
- −$910
- − Depreciation
- −$1,452
- Taxable income
- $4,837
- Est. tax owed @ 24.0%
- −$1,161
- After-tax cash flow
- $4,214/yr
For passive investors: Depreciation is non-cash, so a rental often shows a tax loss while cash-flowing — sheltering income. Rental losses are passive: they offset passive income freely, and up to $25,000/yr can offset ordinary (W-2) income if you actively participate and your MAGI is under $100k (phasing out to $0 by $150k); unused losses carry forward. On sale, claimed depreciation is recaptured at up to 25%, and gains may owe capital-gains tax (a 1031 exchange can defer both). Figures are a year-1 estimate at your 24.0% rate — not tax advice; consult a CPA.
Schools (NCES district)
- District
- Princeton R-V
- NCES district ID
- 2925590
- Math proficiency
- 50% ▲ 1.00%
- Reading proficiency
- 45% ▲ 1.00%
- Median HH income
- $42,232
- Composite
- 42.1/100
- National rank
- #7042
- State rank
- #158 of 535 in MO
Livability — Princeton
- Score
- 63/100
- State rank
- #355
- US rank
- #15724
Category grades
Schools grade is shown separately in the Schools card above.
Census & demographics
- Census place
- Princeton, MO
- Population (ZIP)
- 2,492
Population outlook (Mercer County) Hauer SSP2
- Today (2025)
- 3,512 people
- By 2030
- 3,383 · -3.7%
- By 2040
- 3,134 · -10.8%
- By 2050
- 2,894 · -17.6%
- By 2075
- 2,397 · -31.7%
- By 2100
- 1,787 · -49.1%
Race, ethnicity, and origin ACS 2023
- Neighborhood character
- Predominantly White (90%)
- Race & ethnicity
- White 90% Hispanic / Latino 5% Two or more races 4%
- Hispanic origin (detail)
- Mexican 4%
- Common ancestry
- Portuguese 2% Lithuanian 1% Slovak 1%
- Foreign-born
- 3% · Canada
- Languages at home
- 94% English-only · Spanish 4% German/W. Germanic 2% Tagalog/Filipino 1%
Political lean MEDSL · Mercer
- 2024 margin
- Solid R (+73.1) · D 13.1% · R 86.2%
- 2008→2024 swing
- -35.9pp toward R · 2008: -37.2pp · 2024: -73.1pp
- All cycles
- 2024: R+73.1 2020: R+74.1 2016: R+73.0 2012: R+54.5 2008: R+37.2
Not yet ingested
- Civics
- —
Market trends
- HPI YoY
- ▲ 0.59%
- Current HPI
- 174.6594
- Rent YoY
- —
- Metro
- —
- State GDP YoY
- ▲ 1.84%
- F500 in state
- 20
Industry mix (Fortune 500 HQ in MO)
| Industry | F500 HQs | Revenue |
|---|---|---|
| Healthcare | 1 | $163B |
|
||
| Insurance | 1 | $21B |
|
||
| Industrial Technology | 1 | $17B |
|
||
| Retail | 1 | $16B |
|
||
| Industrial Distribution | 1 | $10B |
|
||
| Utilities | 1 | $9B |
|
||
Price history
1 event — show timeline
- 2026-06-14 Listed $49,900 Heartland MLS as Distributed by MLS Grid
Property tax history
-3.2%/yrLatest (2024): $223 · +4.2% YoY. Source: county tax records.
Cash-flow waterfall
monthlySold comps — $/sqft
last 12 mo · ≤1 miLoading sold comps…