3910 Cherry Ln · Sylacauga, AL
Flood risk No data
- FEMA flood zone
- —
- Chance of flooding over 30 yrs
- —
- Est. flood insurance / yr
- —
Fire risk No data
- Est. fire insurance / yr
- —
Heat risk No data
- Hot days now (above threshold)
- —
- Hot days in 30 yrs
- —
Wind risk No data
- Chance of severe wind over 30 yrs
- —
Air-quality risk No data
- Unhealthy air days now
- —
- Unhealthy air days in 30 yrs
- —
Risk factors via First Street. Map © Google.
Why this score? — see what drove the C- grade
The composite is a weighted blend of 9 inputs, each scored 0–100. Each bar is that input's sub-score; the figure is the points it added to the 100-point composite (weight × sub-score).
- Cash flow +16.7/30.0
- ARV discount +15.0/15.0
- DSCR +5.2/10.0
- 1% rule +4.5/10.0
- Livability +3.2/5.0
- Rent growth +2.5/5.0
- Schools +2.5/10.0
- Condition / age +1.0/5.0
- Appreciation +0.0/10.0
$114,000
🖨 Deal sheet (PDF) 📄 Offer letter ✓ Due diligence
Listing remarks MLS
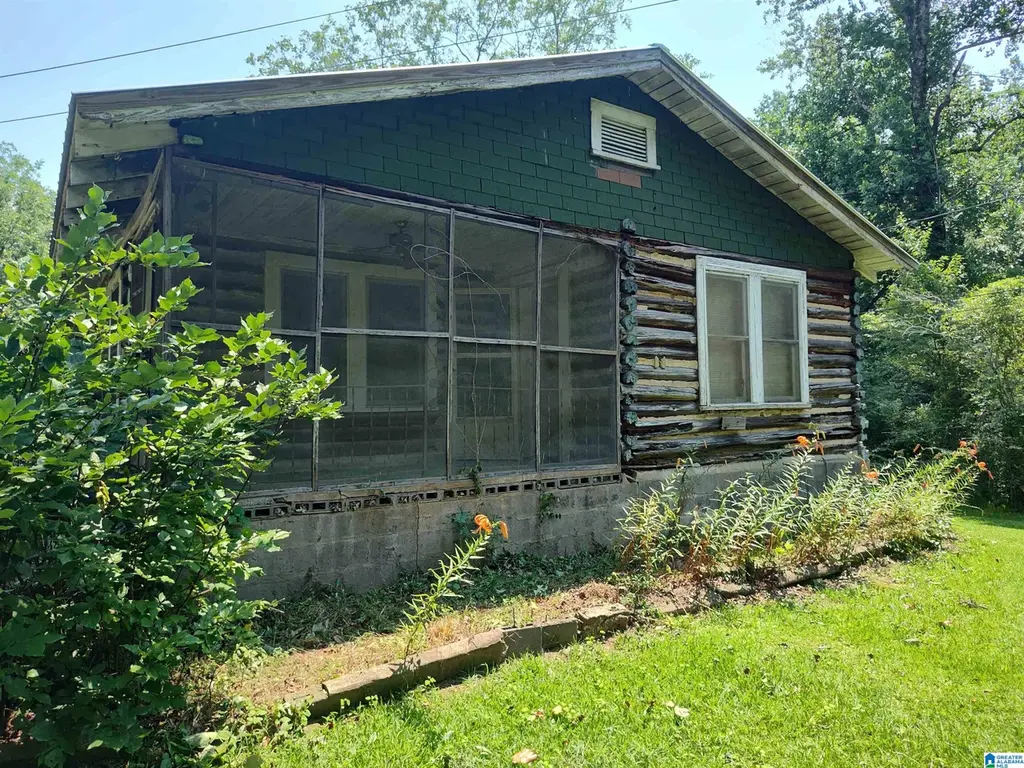
5 Acres with a log house!! Beautiful acreage with fruit trees, pecan trees, etc. Home has 2bedrooms and 1 bath, a living room, a kitchen, and laundry. Ready for you to add your design ideas! Several outbuildings on the property, and a picturesque setting. Sold As Is.
Key facts
- Kitchen
- Living room
- 5 acres
Tags
Neighborhood map
What this means for you Summary
Snapshot
- This is a 2-bed/1.0-bath single-family listed at $114k. Condition is rated poor.
Deal economics
- At list price, monthly cash flow is $71 ($848/yr) — positive.
- The deal already cash-flows at list — no discount required.
- To meet the 1% rule (rent ≥ 1% of price), the offer needs to be $109k (4.7% below list).
- Recommended offer: $100k (12.0% below list) — sets the bar for market timing.
- Cap rate 7.0% vs local median 4.3% in Sylacauga — top-decile yield for the area; either an underpriced asset or a hidden risk that comps aren't pricing in. Stress-test before assuming the spread holds.
Location & tenants
- Location reads 64/100 on livability (#157 in AL) — a middle-class / working-renter tenant base. Strengths: cost of living A+, housing A, health & safety A-; Watch: schools D+, crime F, amenities F.
- Talladega County (rural): math 15% / reading 44% proficiency, ranked #75 of 129 in AL (top 58%) — low school quality limits family demand, transient renter base, plan for 1-2y turnover; 64% free/reduced lunch — lower-income household profile, screen leases tightly.
- Market conditions: 134 active listings in the ZIP; 189 units permitted in Talladega County in 2024 (6 in 5+ unit buildings).
Forward outlook
- Local home prices are declining (-3.0%/yr); year-one equity from $788 of loan paydown is wiped out by about $3k of value loss. Plan a longer hold.
- Talladega County population projected at -14% by 2050 — secular population decline; favor cash flow + early exit over multi-decade hold.
Negotiation context
- It's been on market 128 days — a 12% lower offer ($100k) is reasonable based on typical stale-listing flexibility.
Risks & watch-outs
- Watch-outs: built in 1930 — expect roof / HVAC / electrical / plumbing capex.
Questions for the listing agent
- It's been on market 128 days. Have you received any prior offers? Is the seller open to a 12% concession, seller financing, or rate buy-down credit?
- Have any recent inspections been done? Can we get a copy of the seller's disclosures and any deferred-maintenance estimates?
- Built in 1930 — when were the roof, HVAC, electrical panel, plumbing, and water heater last replaced?
- Why hasn't it sold? Are there any deal-killer items the seller is aware of (foundation, flood, title, zoning, code violations)?
- Is there a deadline driving the sale (1031 exchange, divorce, estate, relocation)? That informs how much negotiation room exists.
- Schools are D-rated, which usually means shorter tenancies and higher turnover. Who's the typical renter profile here, and what's been the actual vacancy rate?
- Crime grade is F in this area — have there been break-ins, vandalism, or insurance claims at this property in the last 3 years? What carrier currently insures it and at what premium?
- What's the average days-on-market for RENTAL listings here right now (not sales)? A rising rental-DOM trend means longer vacancies and softer asking-rent achievability than the comps imply.
- What's the recent tenant-quality profile in this submarket — average credit score on applications, eviction rate, late-payment / NSF rate, and stable-employment percentage? A property-management company in the area should have these aggregated.
- How much new for-sale + rental construction is in the pipeline within 1–3 miles? Heavy new supply typically softens prices + rents 12–24 months out; constrained supply supports both.
Investment metrics
- 1% rule
- 0.95% ✗
- Cap rate
- 7.04%
- Cash-on-cash
- 2.66%
- DSCR
- 1.12
- GRM
- 8.7
CMA / ARV
- ARV (median comp)
- $179,117
- List price
- $114,000
- Delta
- -36.35%
- Verdict
- UNDERPRICED
- Comps
- 2 within 1.0 mi
Show comp detail 1 sale within ~0.75 mi
| Address | Dist | Beds/Ba | Sqft | Sold | Price | $/sf | Match |
|---|---|---|---|---|---|---|---|
| 631 Old Rockhouse Rd | 0.48mi | 3/1.0 (+1) | 1,189 (+13%) | 3mo | $134,000 | $113 | 48 |
Match score weights: distance 35% · size 25% · config 20% · recency 20%. Top-matched comps best support the ARV.
Projected returns pro-forma
-3.0% appreciation · 3.0% rent growth · sell at horizon
- IRR
- -12.1%
- Equity multiple
- 0.56×
- Total profit
- $-13,956
- Equity at exit
- $16,998
- IRR
- -2.9%
- Equity multiple
- 0.80×
- Total profit
- $-6,291
- Equity at exit
- $9,857
Cash invested: $31,920 (down + closing). Projections, not guarantees.
Landlord ↔ Tenant lean methodology
- Overall (STATE)
- 90 Strongly Landlord-Friendly
- State Alabama
- 90 Strongly Landlord-Friendly · R+15
- County
- — inherits STATE
- City
- — inherits STATE
ZIP-level market 35150
- Home prices YoY
- -7.9%
- Active inventory
- 134
- Price-to-rent
- 8.7×
Monthly cashflow live
- Estimated rent
- $1,087 medium interval (Pro) →
- Mortgage (P&I)
- −$598
- Tax est. 1.5%
- −$142 /mo · $1,710/yr
- Insurance
- −$48
- HOA
- −$0
- Vacancy / Maint / Mgmt
- −$228
- Net cashflow
- $71
Break-even live
Sensitivity live
| Price | -10% $149 | -5% $110 | +0% $71 | +5% $31 | +10% $-8 |
|---|---|---|---|---|---|
| Rent | -10% $-15 | -5% $28 | +0% $71 | +5% $114 | +10% $157 |
| Rate | -1.0pp $128 | -0.5pp $100 | base $71 | +0.5pp $41 | +1.0pp $11 |
UW: 25.0% down · 7.5% · 30yr · 1.5% tax · 5.0% vac · 8.0% maint · 8.0% mgmt
Financing live
Cash to close
- Down payment
- $28,500
- Closing costs
- $3,420
- Reserves months
- —
- Total cash needed
- —
Loan-product check · same deal, 3 products live
Conventional
25% down · 7.5% · 30yr
- Down + closing
- —
- Monthly P&I
- —
- Monthly cashflow
- —
- DSCR
- —
- Eligible?
- —
Personal DTI + credit; lowest rate.
DSCR
20% down · 8.5% · 30yr
- Down + closing
- —
- Monthly P&I
- —
- Monthly cashflow
- —
- DSCR
- —
- Eligible?
- —
No personal income docs; deal must DSCR.
Hard money
10% down · 12.0% · 12mo
- Down + closing
- —
- Monthly P&I
- —
- Monthly cashflow
- —
- DSCR
- —
- Eligible?
- —
Short-term bridge; refi at stabilization.
Listing history 18 events
-
2026-06-19days on market $114,000 Active 128 DOM
-
2026-06-18days on market $114,000 Active 127 DOM
-
2026-06-17days on market $114,000 Active 126 DOM
-
2026-06-16days on market $114,000 Active 125 DOM
-
2026-06-15days on market $114,000 Active 124 DOM
-
2026-06-14days on market $114,000 Active 122 DOM
-
2026-06-13days on market $114,000 Active 121 DOM
-
2026-06-10days on market $114,000 Active 119 DOM
-
2026-06-09days on market $114,000 Active 118 DOM
-
2026-06-08days on market $114,000 Active 117 DOM
-
2026-06-07days on market $114,000 Active 116 DOM
-
2026-06-05days on market $114,000 Active 113 DOM
-
2026-06-03days on market $114,000 Active 112 DOM
-
2026-06-02days on market $114,000 Active 111 DOM
-
2026-06-01days on market $114,000 Active 110 DOM
-
2026-05-31days on market $114,000 Active 109 DOM
-
2026-05-30days on market $114,000 Active 108 DOM
-
2026-02-11$114,000 Active 267-char remark
Show marketing remark (267 chars)
5 Acres with a log house!! Beautiful acreage with fruit trees, pecan trees, etc. Home has 2bedrooms and 1 bath, a living room, a kitchen, and laundry. Ready for you to add your design ideas! Several outbuildings on the property, and a picturesque setting. Sold As Is.
ⓘ Source: listings_history table (triggers on properties + properties_extension) + one-shot
backfill from property_details.listing_events for pre-trigger history.
Nearby sold comps map
Loading sold comps map…
Walkable amenities ~0.75 mi
Loading nearby amenities…
Taxation est. · year 1
- Rental income
- $13,040
- − Mortgage interest
- −$6,386
- − Property taxes
- −$1,710
- − Insurance
- −$570
- − Repairs & maintenance
- −$1,043
- − Management
- −$1,043
- − Depreciation
- −$3,316
- Taxable loss
- −$1,028
- Est. tax savings @ 24.0%
- +$247
- After-tax cash flow
- $1,095/yr
For passive investors: Depreciation is non-cash, so a rental often shows a tax loss while cash-flowing — sheltering income. Rental losses are passive: they offset passive income freely, and up to $25,000/yr can offset ordinary (W-2) income if you actively participate and your MAGI is under $100k (phasing out to $0 by $150k); unused losses carry forward. On sale, claimed depreciation is recaptured at up to 25%, and gains may owe capital-gains tax (a 1031 exchange can defer both). Figures are a year-1 estimate at your 24.0% rate — not tax advice; consult a CPA.
Condition & rehab AI · 12 photos
This property requires extensive repairs and updates to bring it up to a livable condition. Significant investment is needed to address the deteriorating exterior, roof, and interior conditions.
Repairs flagged
- Major siding — Severe damage and peeling
- Major roof — Visible damage to shingles
- Major exterior paint — Peeling and deteriorating
- Major interior paint — Peeling and deteriorating
- Major bathroom fixtures — Dirty and outdated
- Major kitchen cabinets — Outdated and worn
- Major HVAC system — No visible signs of recent maintenance
Value-add opportunities
- Both exterior paint — Enhances curb appeal and property value
- Both roof repair — Critical for structural integrity and safety
- Both HVAC system replacement — Improves comfort and energy efficiency
- Both kitchen and bathroom updates — Modernizes spaces and increases appeal
Renovation cost estimate screening
| Repair item | Severity | Est. cost |
|---|---|---|
| siding · Severe damage and peeling | Major | $15,000–50,000 |
| roof · Visible damage to shingles | Major | $15,000–50,000 |
| exterior paint · Peeling and deteriorating | Major | $15,000–50,000 |
| interior paint · Peeling and deteriorating | Major | $15,000–50,000 |
| bathroom fixtures · Dirty and outdated | Major | $15,000–50,000 |
| kitchen cabinets · Outdated and worn | Major | $15,000–50,000 |
| HVAC system · No visible signs of recent maintenance | Major | $15,000–50,000 |
| Total estimated repair cost · 7 items | $105,000–350,000 |
Value-add ROI direction
- Both exterior paint — Enhances curb appeal and property value ↑
- Both roof repair — Critical for structural integrity and safety ↑
- Both HVAC system replacement — Improves comfort and energy efficiency ↑
- Both kitchen and bathroom updates — Modernizes spaces and increases appeal ↑
ⓘ Cost ranges are severity-bucket heuristics (US national rule-of-thumb). Get contractor quotes + a written scope before underwriting a rehab budget.
Schools (NCES district)
- District
- Talladega County
- NCES district ID
- 0103180
- Math proficiency
- 15% ▼ -24.00%
- Reading proficiency
- 44% ▲ 3.00%
- Median HH income
- $37,715
- Composite
- 24.5/100
- National rank
- #7650
- State rank
- #75 of 129 in AL
Livability — Sylacauga
- Score
- 64/100
- State rank
- #157
- US rank
- #14297
Category grades
Schools grade is shown separately in the Schools card above.
Census & demographics
- City population
- 17,118
- Population (ZIP)
- 17,118
Population outlook (Talladega County) Hauer SSP2
- Today (2025)
- 78,905 people
- By 2030
- 77,160 · -2.2%
- By 2040
- 72,937 · -7.6%
- By 2050
- 68,279 · -13.5%
- By 2075
- 57,884 · -26.6%
- By 2100
- 47,220 · -40.2%
Race, ethnicity, and origin ACS 2023
- Neighborhood character
- Majority White (62%)
- Race & ethnicity
- White 62% Black 32% Two or more races 3% Hispanic / Latino 2%
- Common ancestry
- Slovak 1% Hispanic 1% Italian 1%
- Foreign-born
- 1% · Canada
- Languages at home
- 97% English-only · Spanish 2% Other Indo-European 1%
Political lean MEDSL · Talladega
- 2024 margin
- Solid R (+33.8) · D 32.9% · R 66.6%
- 2008→2024 swing
- -15.3pp toward R · 2008: -18.5pp · 2024: -33.8pp
- All cycles
- 2024: R+33.8 2020: R+25.5 2016: R+25.6 2012: R+16.0 2008: R+18.5
Not yet ingested
- Civics
- —
Market trends
- HPI YoY
- ▼ -20.65%
- Current HPI
- 240.527
- Rent YoY
- —
- Metro
- —
- State GDP YoY
- ▲ 2.94%
- F500 in state
- 4
Industry mix (Fortune 500 HQ in AL)
| Industry | F500 HQs | Revenue |
|---|---|---|
| Financial Services | 1 | $8B |
|
||
| Healthcare | 1 | $5B |
|
||
Price history
1 event — show timeline
- 2026-02-11 Listed $114,000 Greater Alabama MLS
Cash-flow waterfall
monthlySold comps — $/sqft
last 12 mo · ≤1 miLoading sold comps…