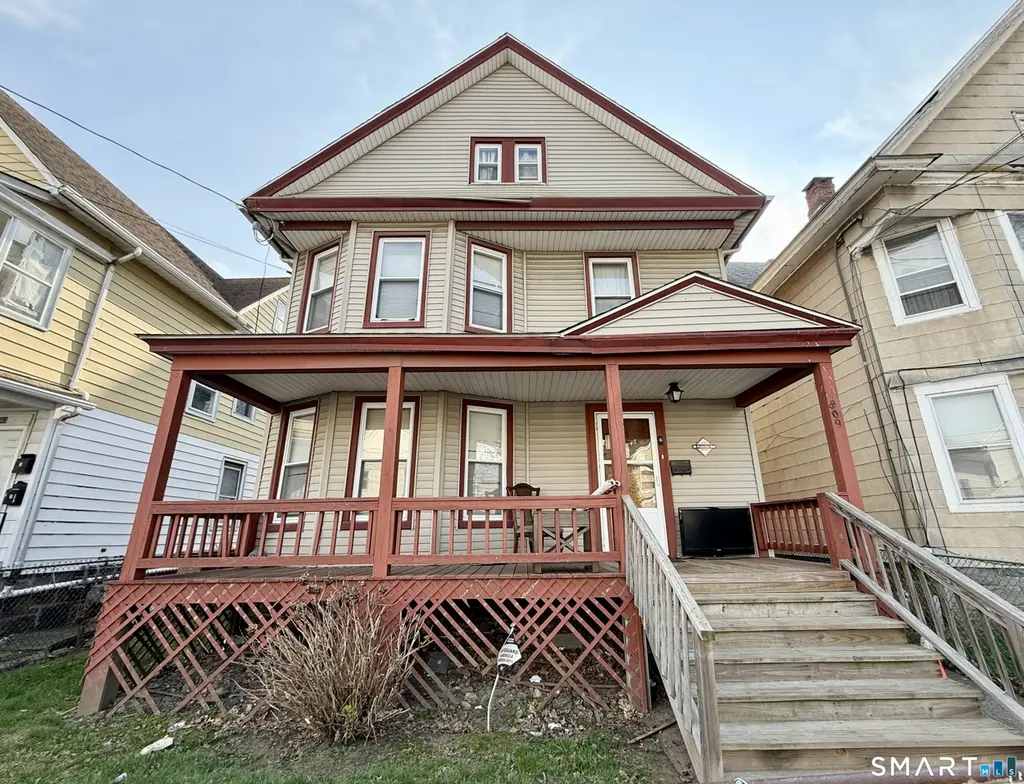
809 Norman St · Bridgeport, CT
Flood risk 1/10 · Minimal
- FEMA flood zone
- X (unshaded)
- Chance of flooding over 30 yrs
- 0.0%
- Est. flood insurance / yr
- $473 – $860
Fire risk 1/10 · Minimal
- Est. fire insurance / yr
- $829 – $1,539
Heat risk 6/10 · Moderate
- Hot days now (above 97°F)
- 7 days/yr
- Hot days in 30 yrs
- 16 days/yr
Wind risk 6/10 · Moderate
- Chance of severe wind over 30 yrs
- 41.0%
Air-quality risk 4/10 · Minor
- Unhealthy air days now
- 5 days/yr
- Unhealthy air days in 30 yrs
- 7 days/yr
Risk factors via First Street. Map © Google.
Why this score? — see what drove the D+ grade
The composite is a weighted blend of 9 inputs, each scored 0–100. Each bar is that input's sub-score; the figure is the points it added to the 100-point composite (weight × sub-score).
- Cash flow +15.1/30.0
- ARV discount +15.0/15.0
- DSCR +4.6/10.0
- 1% rule +4.3/10.0
- Livability +4.0/5.0
- Rent growth +3.0/5.0
- Condition / age +2.5/5.0
- Schools +1.2/10.0
- Appreciation +0.0/10.0
$349,000
🖨 Deal sheet 📄 Offer letter ✓ Due diligence
Listing remarks MLS
Large Stratfield Historic District Colonial With Five Bed- Rooms Near Maplewood Avenue / Great For Large Family / Wallsin Most Of Home Being Replaced By Sheet Rock / Alarm System Call Now Before It's Too Late !!!
Key facts
- 3,484 sq ft lot
- Parking
- Built 1897
Tags
Neighborhood map
What this means for you Summary
Snapshot
- This is a 5-bed/1.5-bath single-family listed at $349k.
Deal economics
- At list price, monthly cash flow is $113 ($1k/yr) — positive.
- The deal already cash-flows at list — no discount required.
- To meet the 1% rule (rent ≥ 1% of price), the offer needs to be $326k (6.6% below list).
- Recommended offer: $326k (6.6% below list) — sets the bar for 1% rule.
- Cap rate 6.7% vs local median 5.0% in Bridgeport — top-decile yield for the area; either an underpriced asset or a hidden risk that comps aren't pricing in. Stress-test before assuming the spread holds.
Location & tenants
- Location reads 81/100 on livability (#15 in CT, #1,374 nationally) — a professional / high-income tenant draw. Strengths: amenities A+, commute A+, health & safety A+; Watch: crime C-, employment D+.
- Bridgeport School District (urban): math 9% / reading 19% proficiency, ranked #151 of 153 in CT (top 99%) — low school quality limits family demand, transient renter base, plan for 1-2y turnover; 97% free/reduced lunch — lower-income household profile, screen leases tightly.
- Zoned schools: James J. Curiale School (math 3% / reading 11%, grade F, #538 of 553 statewide, top 97%, 523 students, 94% FRL); Bassick High School (math 2% / reading 8%, grade F, #192 of 194 statewide, top 100%, 1,009 students, 87% FRL).
- Market conditions: Rents rising (+1.8%/yr); 47 active listings in the ZIP; 16 comparable units currently listed for rent nearby; rentals at typical pace (median 24d on market — plan ~3-4 weeks tenant-placement turnaround); 852 units permitted in Greater Bridgeport Planning Region in 2024 (698 in 5+ unit buildings).
- At $3,259/mo this rent would consume 70% of the median local household income ($56k/yr) (locally 2367% of renters already pay >50% of income on rent) — very limited rent-growth headroom before tenants either downsize or default.
Forward outlook
- Local home prices are declining (-3.0%/yr); year-one equity from $2k of loan paydown is wiped out by about $10k of value loss. Plan a longer hold.
Negotiation context
- Only 7 days on market — expect competitive offers; lowballing is unlikely to land.
- 7 sale attempts since 32y ago with the ask held roughly flat each time — persistent listings suggest the price (not the market) is what's stuck; bring a comps-based counter.
- Current owner paid $159k; list at $349k implies a 119% gain — meaningful room to come down on a strong offer.
Risks & watch-outs
- Watch-outs: built in 1897 — expect roof / HVAC / electrical / plumbing capex.
- Climate carrying-cost: major wind risk, 41% chance of damaging wind over 30y; extreme-heat days projected 7→16/yr by 2055 (HVAC capex compounding) — expect insurance premiums to compound above CPI over the hold.
Questions for the listing agent
- Built in 1897 — when were the roof, HVAC, electrical panel, plumbing, and water heater last replaced?
- Is there a deadline driving the sale (1031 exchange, divorce, estate, relocation)? That informs how much negotiation room exists.
- Schools are D-rated, which usually means shorter tenancies and higher turnover. Who's the typical renter profile here, and what's been the actual vacancy rate?
- The area grade is low — what's the realistic commute time and amenity access for the typical tenant pool here? Any planned neighborhood developments (good or bad) we should know about?
- What's the average days-on-market for RENTAL listings here right now (not sales)? A rising rental-DOM trend means longer vacancies and softer asking-rent achievability than the comps imply.
- What's the recent tenant-quality profile in this submarket — average credit score on applications, eviction rate, late-payment / NSF rate, and stable-employment percentage? A property-management company in the area should have these aggregated.
- How much new for-sale + rental construction is in the pipeline within 1–3 miles? Heavy new supply typically softens prices + rents 12–24 months out; constrained supply supports both.
Investment metrics
- 1% rule
- 0.93% ✗
- Cap rate
- 6.68%
- Cash-on-cash
- 1.39%
- DSCR
- 1.06
- GRM
- 8.9
CMA / ARV
- ARV (on-the-fly)
- $423,280
- Comps found
- 12
Show comp detail 12 sales within ~0.75 mi
| Address | Dist | Beds/Ba | Sqft | Sold | Price | $/sf | Match |
|---|---|---|---|---|---|---|---|
| 809 Norman St | 0.00mi | 5/1.5 | 1,924 (0%) | 0mo | $370,000 | $192 | 100 |
| 40 Rosedale St | 0.28mi | 5/2.0 | 1,975 (+3%) | 12mo | $380,000 | $192 | 70 |
| 125 E Eaton St | 0.50mi | 5/2.5 | 2,000 (+4%) | 5mo | $515,000 | $258 | 62 |
| 1224 Iranistan Ave | 0.25mi | 4/1.5 (-1) | 1,812 (-6%) | 16mo | $350,000 | $193 | 60 |
| 324 Norman St | 0.44mi | 4/2.0 (-1) | 1,878 (-2%) | 13mo | $350,000 | $186 | 58 |
| 32 Wade St | 0.50mi | 4/2.0 (-1) | 1,992 (+4%) | 18mo | $500,000 | $251 | 49 |
| 1057 Briarwood Ave | 0.66mi | 4/1.0 (-1) | 1,876 (-2%) | 12mo | $401,000 | $214 | 48 |
| 152 Lorraine St | 0.40mi | 4/2.0 (-1) | 1,800 (-6%) | 19mo | $365,000 | $203 | 47 |
| 1410 Norman St | 0.58mi | 4/3.0 (-1) | 2,038 (+6%) | 18mo | $500,000 | $245 | 37 |
| 684 W Taft Ave | 0.68mi | 4/2.0 (-1) | 2,109 (+10%) | 14mo | $465,000 | $220 | 34 |
| 615 W Taft Ave | 0.64mi | 4/2.5 (-1) | 1,744 (-9%) | 20mo | $550,000 | $315 | 29 |
| 195 Dixon St | 0.59mi | 4/2.5 (-1) | 1,684 (-12%) | 18mo | $490,000 | $291 | 28 |
Match score weights: distance 35% · size 25% · config 20% · recency 20%. Top-matched comps best support the ARV.
Projected returns pro-forma
-3.0% appreciation · 1.81% rent growth · sell at horizon
- IRR
- -15.4%
- Equity multiple
- 0.46×
- Total profit
- $-53,133
- Equity at exit
- $52,037
- IRR
- -9.1%
- Equity multiple
- 0.47×
- Total profit
- $-52,126
- Equity at exit
- $30,175
Cash invested: $97,720 (down + closing). Projections, not guarantees.
Landlord ↔ Tenant lean methodology
- Overall (STATE)
- 27 Tenant-Leaning
- State Connecticut
- 27 Tenant-Leaning · D+7
- County
- — inherits STATE
- City
- — inherits STATE
ZIP-level market 06605
- Home prices YoY
- -14.5%
- Rents YoY
- 1.8%
- Active inventory
- 47
- Price-to-rent
- 8.9×
Monthly cashflow live
- Estimated rent
- $3,259 high interval (Pro) →
- Mortgage (P&I)
- −$1,830
- Tax from tax record
- −$486 /mo · $5,831/yr
- Insurance
- −$145
- HOA
- −$0
- Vacancy / Maint / Mgmt
- −$684
- Net cashflow
- $113
Break-even live
UW: 25.0% down · 7.5% · 30yr · 1.5% tax · 5.0% vac · 8.0% maint · 8.0% mgmt
Financing live
Cash to close
- Down payment
- $87,250
- Closing costs
- $10,470
- Reserves months
- —
- Total cash needed
- —
Loan-product check · same deal, 3 products live
Conventional
25% down · 7.5% · 30yr
- Down + closing
- —
- Monthly P&I
- —
- Monthly cashflow
- —
- DSCR
- —
- Eligible?
- —
Personal DTI + credit; lowest rate.
DSCR
20% down · 8.5% · 30yr
- Down + closing
- —
- Monthly P&I
- —
- Monthly cashflow
- —
- DSCR
- —
- Eligible?
- —
No personal income docs; deal must DSCR.
Hard money
10% down · 12.0% · 12mo
- Down + closing
- —
- Monthly P&I
- —
- Monthly cashflow
- —
- DSCR
- —
- Eligible?
- —
Short-term bridge; refi at stabilization.
Rent comps 16 comps
| Address | Beds | Baths | Sqft | Rent | $/sqft | DOM | Units | Dist |
|---|---|---|---|---|---|---|---|---|
| 259 Laurel Ave Unit 2 Bridgeport, CT | 4.0 | 1.0 | 1432 | $3,200 | $2.23 | 3d | 1 | 0.27mi |
| 102 Hanover St Bridgeport, CT | 4.0 | 1.5 | 1552 | $2,800 | $1.80 | 14d | 1 | 0.55mi |
| 143 Highland Ave Bridgeport, CT | 4.0 | 1.0 | 1362 | $2,500 | $1.84 | 23d | 1 | 0.56mi |
| 241 Lewis St Unit 241 Bridgeport, CT | 6.0 | 2.0 | 2300 | $3,500 | $1.52 | 43d | 1 | 0.65mi |
| 111 Arcadia Ave Bridgeport, CT | 4.0 | 1.5 | 2010 | $4,000 | $1.99 | 2d | 1 | 0.79mi |
| 99 Johnson St Unit 2 Bridgeport, CT | 4.0 | 2.0 | 1500 | $3,600 | $2.40 | 43d | 1 | 0.94mi |
| 583 Gregory St Bridgeport, CT | 4.0 | 4.5 | 1750 | $3,250 | $1.86 | 43d | 1 | 1.06mi |
| 125 High Ridge Dr Bridgeport, CT | 4.0 | 1.5 | 2160 | $3,400 | $1.57 | 2d | 1 | 1.14mi |
| 7 Armstrong Pl Bridgeport, CT | 5.0 | 1.0 | 2449 | $2,750 | $1.12 | 23d | 1 | 1.16mi |
| 110 Maple St Unit 1L Bridgeport, CT | 6.0 | 2.5 | 1700 | $3,000 | $1.76 | 43d | 1 | 1.19mi |
| 281 Harriet St Unit 281 Bridgeport, CT | 4.0 | 2.5 | 2297 | $3,900 | $1.70 | 43d | 1 | 1.23mi |
| 95 Parrott Ave Bridgeport, CT | 4.0 | 1.0 | 1782 | $3,450 | $1.94 | 23d | 1 | 1.28mi |
| 141 Hicks St Bridgeport, CT | 4.0 | 1.0 | 2311 | $2,400 | $1.04 | 23d | 1 | 1.29mi |
| 146 Warsaw St Fairfield, CT | 4.0 | 1.0 | 1400 | $3,100 | $2.21 | 23d | 1 | 1.40mi |
| 36-38 Pleasant St Unit 2 Bridgeport, CT | 4.0 | 1.0 | 2395 | $2,700 | $1.13 | 14d | 1 | 1.44mi |
| 52-54 Ives Ct Bridgeport, CT | 4.0 | 1.0 | 2092 | $2,750 | $1.31 | 43d | 1 | 1.45mi |
Listing history 16 events
-
2026-04-24status Under Contract
-
2026-04-16$349,000 Active
-
2004-08-19soldstatus $159,000
-
2004-08-17soldstatus $159,000 212-char remark
Show marketing remark (212 chars)
Large Stratfield Historic District Colonial With Five Bed- Rooms Near Maplewood Avenue / Great For Large Family / Wallsin Most Of Home Being Replaced By Sheet Rock / Alarm System Call Now Before It's Too Late !!!
-
2004-05-02$159,000 212-char remark
Show marketing remark (212 chars)
Large Stratfield Historic District Colonial With Five Bed- Rooms Near Maplewood Avenue / Great For Large Family / Wallsin Most Of Home Being Replaced By Sheet Rock / Alarm System Call Now Before It's Too Late !!!
-
1999-09-02soldstatus $76,000 1-char remark
Show marketing remark (1 chars)
.
-
1999-09-01soldstatus $78,900
-
1999-03-11$79,900 1-char remark
Show marketing remark (1 chars)
.
-
1998-10-31historical
-
1998-04-16$79,900
-
1998-04-14historical
-
1997-12-15$89,900
-
1995-06-30historical
-
1995-01-11$82,900
-
1994-12-31historical
-
1994-08-27$79,900
ⓘ Source: listings_history table (triggers on properties + properties_extension) + one-shot
backfill from property_details.listing_events for pre-trigger history.
Tax reassessment forecast CT · Partial reset (capped growth)
- Current annual tax
- $5,831 · $486/mo
- Projected year-2 tax
- $6,650 · $554/mo
- Expected delta
- +$819/yr (+$68/mo · 14.0%)
ⓘ Screening estimate from a state-policy table — verify with the county assessor before closing.
Climate risk First Street
- Flood 1/10 Low FEMA zone X (unshaded) · 0% chance over 30 yrs
- Wildfire 1/10 Low
- Heat 6/10 Major 7 d/yr ≥97°F today · 16 d/yr by 30 yrs out
- Wind 6/10 Major 41% chance of damaging wind over 30 yrs
- Air quality 4/10 Moderate 5 unhealthy d/yr today · 7 by 30 yrs out
Nearby sold comps map
Loading sold comps map…
Walkable amenities ~0.75 mi
Loading nearby amenities…
Taxation est. · year 1
- Rental income
- $39,107
- − Mortgage interest
- −$19,549
- − Property taxes
- −$5,831
- − Insurance
- −$1,745
- − Repairs & maintenance
- −$3,129
- − Management
- −$3,129
- − Depreciation
- −$10,153
- Taxable loss
- −$4,428
- Est. tax savings @ 24.0%
- +$1,063
- After-tax cash flow
- $2,419/yr
For passive investors: Depreciation is non-cash, so a rental often shows a tax loss while cash-flowing — sheltering income. Rental losses are passive: they offset passive income freely, and up to $25,000/yr can offset ordinary (W-2) income if you actively participate and your MAGI is under $100k (phasing out to $0 by $150k); unused losses carry forward. On sale, claimed depreciation is recaptured at up to 25%, and gains may owe capital-gains tax (a 1031 exchange can defer both). Figures are a year-1 estimate at your 24.0% rate — not tax advice; consult a CPA.
Schools (NCES district)
- District
- Bridgeport School District
- NCES district ID
- 0900450
- Math proficiency
- 9% ▼ -7.00%
- Reading proficiency
- 19% ▼ -10.00%
- Median HH income
- $41,507
- Composite
- 12.09/100
- National rank
- #9656
- State rank
- #151 of 153 in CT
Livability — Bridgeport
- Score
- 81/100
- State rank
- #15
- US rank
- #1374
Category grades
Schools grade is shown separately in the Schools card above.
Census & demographics
- Census place
- Bridgeport, CT
- County
- Fairfield County · 765,532 people
- City population
- 149,153
- Metro
- Bridgeport-Stamford-Norwalk, CT
- Population (ZIP)
- 25,929
- Household income
- $56,179
- Rent vs Own
- Severe rent burden
- 2367.0
Population outlook (Greater Bridgeport County) Hauer SSP2
- By 2040
- 365,581
Race, ethnicity, and origin ACS 2023
- Neighborhood character
- Diverse neighborhood (Simpson 0.70)
- Race & ethnicity
- Hispanic / Latino 39% White 33% Black 19% Two or more races 12% Asian 5% Native American 1%
- Hispanic origin (detail)
- Mexican 6% Puerto Rican 17% Cuban 3% Dominican 3%
- Common ancestry
- Romanian 4% Hispanic 3% Scotch-Irish 2%
- Foreign-born
- 25% · Canada, Guatemala, China
- Languages at home
- 54% English-only · Spanish 32% Other Indo-European 4% French/Haitian/Cajun 3%
Political lean MEDSL · Greater Bridgeport
- 2024 margin
- Strong D (+23.3) · D 60.9% · R 37.6% · Other 1.5%
- All cycles
- 2024: D+23.3
Not yet ingested
- Civics
- —
Market trends
- HPI YoY
- ▼ -40.42%
- Current HPI
- 238.1786
- Rent YoY
- ▲ 1.81%
- Metro
- Bridgeport-Stamford-Norwalk, CT
- State GDP YoY
- ▲ 1.06%
- F500 in state
- 38
Industry mix (Fortune 500 HQ in CT)
| Industry | F500 HQs | Revenue |
|---|---|---|
| Industrial Machinery | 4 | $38B |
|
||
| Insurance | 3 | $71B |
|
||
| Financial Services | 2 | $25B |
|
||
| Transportation / Logistics | 2 | $18B |
|
||
| Healthcare | 1 | $247B |
|
||
| Telecommunications | 1 | $55B |
|
||
Price history
+336.8% since first listed16 events — show timeline
- 2026-04-24 Pending — Smart MLS
- 2026-04-16 Listed $349,000 Smart MLS
- 2004-08-19 Sold (Public Records) $159,000 Public Records
- 2004-08-17 Sold (MLS) $159,000 Smart MLS
- 2004-05-02 Listed $159,000 Smart MLS
- 1999-09-02 Sold (MLS) $76,000 Smart MLS
- 1999-09-01 Sold (Public Records) $78,900 Public Records
- 1999-03-11 Listed $79,900 Smart MLS
- 1998-10-31 Listing Removed — Smart MLS
- 1998-04-16 Listed $79,900 Smart MLS
- 1998-04-14 Listing Removed — Smart MLS
- 1997-12-15 Listed $89,900 Smart MLS
- 1995-06-30 Listing Removed — Smart MLS
- 1995-01-11 Listed $82,900 Smart MLS
- 1994-12-31 Listing Removed — Smart MLS
- 1994-08-27 Listed $79,900 Smart MLS
Property tax history
+1.4%/yrLatest (2023): $5,831 · +0.0% YoY. Source: county tax records.
Cash-flow waterfall
monthlySold comps — $/sqft
last 12 mo · ≤1 miLoading sold comps…