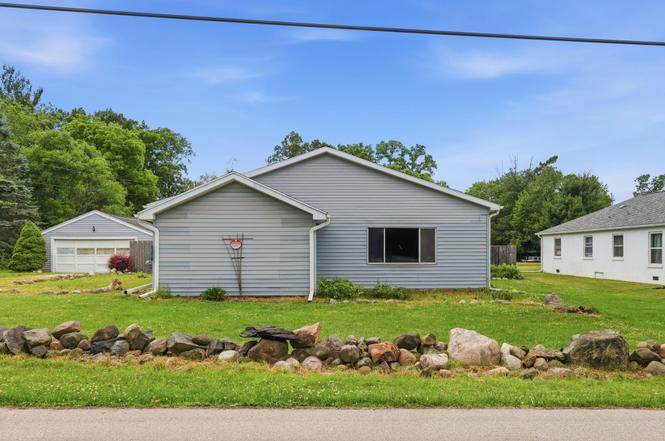
212 Woodland Ave · Blackman, MI
Flood risk 1/10 · Minimal
- FEMA flood zone
- X (unshaded)
- Chance of flooding over 30 yrs
- 0.0%
- Est. flood insurance / yr
- $473 – $860
Fire risk 2/10 · Minimal
- Est. fire insurance / yr
- $784 – $1,456
Heat risk 2/10 · Minimal
- Hot days now (above 96°F)
- 7 days/yr
- Hot days in 30 yrs
- 15 days/yr
Wind risk 2/10 · Minimal
- Chance of severe wind over 30 yrs
- —
Air-quality risk 2/10 · Minimal
- Unhealthy air days now
- 1 days/yr
- Unhealthy air days in 30 yrs
- 2 days/yr
Risk factors via First Street. Map © Google.
Why this score? — see what drove the B grade
The composite is a weighted blend of 9 inputs, each scored 0–100. Each bar is that input's sub-score; the figure is the points it added to the 100-point composite (weight × sub-score).
- Cash flow +30.0/30.0
- 1% rule +10.0/10.0
- DSCR +10.0/10.0
- ARV discount +7.5/15.0
- Rent growth +4.4/5.0
- Schools +3.6/10.0
- Livability +2.5/5.0
- Condition / age +2.5/5.0
- Appreciation +0.0/10.0
$79,900
🖨 Deal sheet (PDF) 📄 Offer letter ✓ Due diligence
Listing remarks MLS
Unlock the Potential!Attention investors, flippers, and rehab enthusiasts! This property is packed with potential and ready for its next chapter. While the home requires renovation and updating, the opportunity to build equity and transform this property into something special is undeniable. Whether you're looking for your next flip project, rental investment, or renovation masterpiece, this home offers a chance to bring your vision to life. Sold as-is.
Key facts
- 0.92 acre lot
- 2 garage spots
- Built 1940
Property features AI
Exterior
- Parking: Detached 2-car garage
- Utilities: Public water
- Home design: Ranch-style single family residence; One-story (ranch)
- Construction: Built in 1940; Aluminum siding; Shingle roof
- Exterior features: Public water; 0.46-acre lot
Interior
- Bathrooms: 1 full bathroom
- Heating & cooling: Forced air heating
- Interior features: 9 total rooms; Partial basement
Neighborhood map
What this means for you Summary
Snapshot
- This is a 3-bed/1.0-bath single-family listed at $80k.
Deal economics
- At list price, monthly cash flow is $681 ($8k/yr) — positive.
- The deal already cash-flows at list — no discount required.
- Meets the 1% rule at list price ($2k rent vs $80k).
Location & tenants
- Location reads: area grade B — affects rentability + tenant quality, not the cash-flow math above.
- Western School District (rural): math 33% / reading 50% proficiency, ranked #179 of 540 in MI (top 33%) — families likely to look elsewhere, expect single-tenant / working-renter base with shorter leases.
- Zoned schools: Bean Elementary School (math 32% / reading 47%, grade F, #606 of 1,397 statewide, top 48%, 402 students, 35% FRL); Western Middle School (math 29% / reading 46%, grade F, #243 of 493 statewide, top 50%, 586 students, 41% FRL); Western High School (math 42% / reading 67%, grade C-, #109 of 713 statewide, top 17%, 846 students, 30% FRL) — zoned schools at 35% FRL track the district average.
- Market conditions: Rents rising fast (+7.5%/yr); 172 active listings in the ZIP; 317 units permitted in Jackson County in 2024 (103 in 5+ unit buildings).
- This rent runs 34% of the median local income ($56k/yr) — at the standard rent-burdened threshold; future hikes will face affordability resistance.
Forward outlook
- Local home prices are declining (-3.0%/yr); year-one equity from $552 of loan paydown is wiped out by about $2k of value loss. Plan a longer hold.
- Jackson County population projected at -13% by 2050 — secular population decline; favor cash flow + early exit over multi-decade hold.
- At projected returns (-3.0% appreciation + 7.5% rent growth), your $22k cash investment doubles in ~3 years — after that, you're playing with house money.
Negotiation context
- Only 4 days on market — expect competitive offers; lowballing is unlikely to land.
- 3 sale attempts with the ask held roughly flat each time — persistent listings suggest the price (not the market) is what's stuck; bring a comps-based counter.
Risks & watch-outs
- Watch-outs: built in 1940 — expect roof / HVAC / electrical / plumbing capex.
Questions for the listing agent
- Built in 1940 — when were the roof, HVAC, electrical panel, plumbing, and water heater last replaced?
- Is there a deadline driving the sale (1031 exchange, divorce, estate, relocation)? That informs how much negotiation room exists.
- What's the average days-on-market for RENTAL listings here right now (not sales)? A rising rental-DOM trend means longer vacancies and softer asking-rent achievability than the comps imply.
- What's the recent tenant-quality profile in this submarket — average credit score on applications, eviction rate, late-payment / NSF rate, and stable-employment percentage? A property-management company in the area should have these aggregated.
- How much new for-sale + rental construction is in the pipeline within 1–3 miles? Heavy new supply typically softens prices + rents 12–24 months out; constrained supply supports both.
Investment metrics
- 1% rule
- 1.98% ✓
- Cap rate
- 16.53%
- Cash-on-cash
- 36.55%
- DSCR
- 2.63
- GRM
- 4.2
CMA / ARV
- ARV (on-the-fly)
- $294,668
- Comps found
- 7
Show comp detail 7 sales within ~0.75 mi
| Address | Dist | Beds/Ba | Sqft | Sold | Price | $/sf | Match |
|---|---|---|---|---|---|---|---|
| 3803 Catherine St | 0.39mi | 3/1.5 | 1,966 (-1%) | 13mo | $290,000 | $148 | 66 |
| 314 Pershing Ave | 0.15mi | 3/1.5 | 1,832 (-8%) | 21mo | $162,500 | $89 | 61 |
| 2850 Sheridan Cir #62 | 0.64mi | 3/2.0 | 1,770 (-11%) | 2mo | $461,840 | $261 | 46 |
| 163 Robinson Rd | 0.48mi | 3/2.0 | 1,756 (-12%) | 12mo | $250,000 | $142 | 44 |
| 3836 Westchester Blvd | 0.71mi | 3/1.5 | 1,892 (-5%) | 20mo | $233,000 | $123 | 40 |
| 2904 Sheridan Cir #58 | 0.67mi | 3/2.0 | 1,741 (-13%) | 13mo | $554,312 | $318 | 33 |
| 410 Robinson Rd | 0.60mi | 3/3.0 | 2,203 (+11%) | 18mo | $345,000 | $157 | 31 |
Match score weights: distance 35% · size 25% · config 20% · recency 20%. Top-matched comps best support the ARV.
Projected returns pro-forma
-3.0% appreciation · 7.54% rent growth · sell at horizon
- IRR
- 37.5%
- Equity multiple
- 2.70×
- Total profit
- $38,032
- Equity at exit
- $11,913
- IRR
- 46.3%
- Equity multiple
- 6.50×
- Total profit
- $123,156
- Equity at exit
- $6,908
Cash invested: $22,372 (down + closing). Projections, not guarantees.
Landlord ↔ Tenant lean methodology
- Overall (STATE)
- 62 Landlord-Friendly
- State Michigan
- 62 Landlord-Friendly · EVEN
- County
- — inherits STATE
- City
- — inherits STATE
ZIP-level market 49203
- Home prices YoY
- -31.7%
- Rents YoY
- 7.5%
- Active inventory
- 172
- Price-to-rent
- 4.2×
Monthly cashflow live
- Estimated rent
- $1,580 medium interval (Pro) →
- Mortgage (P&I)
- −$419
- Tax from tax record
- −$115 /mo · $1,376/yr
- Insurance
- −$33
- HOA
- −$0
- Vacancy / Maint / Mgmt
- −$332
- Net cashflow
- $681
Break-even live
Sensitivity live
| Price | -10% $727 | -5% $704 | +0% $681 | +5% $659 | +10% $636 |
|---|---|---|---|---|---|
| Rent | -10% $557 | -5% $619 | +0% $681 | +5% $744 | +10% $806 |
| Rate | -1.0pp $722 | -0.5pp $702 | base $681 | +0.5pp $661 | +1.0pp $640 |
UW: 25.0% down · 7.5% · 30yr · 1.5% tax · 5.0% vac · 8.0% maint · 8.0% mgmt
Financing live
Cash to close
- Down payment
- $19,975
- Closing costs
- $2,397
- Reserves months
- —
- Total cash needed
- —
Loan-product check · same deal, 3 products live
Conventional
25% down · 7.5% · 30yr
- Down + closing
- —
- Monthly P&I
- —
- Monthly cashflow
- —
- DSCR
- —
- Eligible?
- —
Personal DTI + credit; lowest rate.
DSCR
20% down · 8.5% · 30yr
- Down + closing
- —
- Monthly P&I
- —
- Monthly cashflow
- —
- DSCR
- —
- Eligible?
- —
No personal income docs; deal must DSCR.
Hard money
10% down · 12.0% · 12mo
- Down + closing
- —
- Monthly P&I
- —
- Monthly cashflow
- —
- DSCR
- —
- Eligible?
- —
Short-term bridge; refi at stabilization.
Listing history 5 events
-
2026-06-21days on market $79,900 Active 4 DOM
-
2026-06-19remarks 498-char remark
-
2026-06-19days on market $79,900 Active 2 DOM
-
2026-06-17remarks 461-char remark
Show marketing remark (457 chars)
Unlock the Potential!Attention investors, flippers, and rehab enthusiasts! This property is packed with potential and ready for its next chapter. While the home requires renovation and updating, the opportunity to build equity and transform this property into something special is undeniable. Whether you're looking for your next flip project, rental investment, or renovation masterpiece, this home offers a chance to bring your vision to life. Sold as-is.
-
2026-06-17$79,900 Active 1 DOM
Show marketing remark (457 chars)
Unlock the Potential!Attention investors, flippers, and rehab enthusiasts! This property is packed with potential and ready for its next chapter. While the home requires renovation and updating, the opportunity to build equity and transform this property into something special is undeniable. Whether you're looking for your next flip project, rental investment, or renovation masterpiece, this home offers a chance to bring your vision to life. Sold as-is.
ⓘ Source: listings_history table (triggers on properties + properties_extension) + one-shot
backfill from property_details.listing_events for pre-trigger history.
Tax reassessment forecast MI · Partial reset (capped growth)
- Current annual tax
- $1,376 · $115/mo
- Projected year-2 tax
- $1,376 · $115/mo
- Expected delta
- $0/yr ($0/mo · -0.0%)
ⓘ Screening estimate from a state-policy table — verify with the county assessor before closing.
Climate risk First Street
- Flood 1/10 Low FEMA zone X (unshaded) · 0% chance over 30 yrs
- Wildfire 2/10 Low
- Heat 2/10 Low 7 d/yr ≥96°F today · 15 d/yr by 30 yrs out
- Wind 2/10 Low
- Air quality 2/10 Low 1 unhealthy d/yr today · 2 by 30 yrs out
Nearby sold comps map
Loading sold comps map…
Walkable amenities ~0.75 mi
Loading nearby amenities…
Taxation est. · year 1
- Rental income
- $18,962
- − Mortgage interest
- −$4,476
- − Property taxes
- −$1,376
- − Insurance
- −$400
- − Repairs & maintenance
- −$1,517
- − Management
- −$1,517
- − Depreciation
- −$2,324
- Taxable income
- $7,353
- Est. tax owed @ 24.0%
- −$1,765
- After-tax cash flow
- $6,412/yr
For passive investors: Depreciation is non-cash, so a rental often shows a tax loss while cash-flowing — sheltering income. Rental losses are passive: they offset passive income freely, and up to $25,000/yr can offset ordinary (W-2) income if you actively participate and your MAGI is under $100k (phasing out to $0 by $150k); unused losses carry forward. On sale, claimed depreciation is recaptured at up to 25%, and gains may owe capital-gains tax (a 1031 exchange can defer both). Figures are a year-1 estimate at your 24.0% rate — not tax advice; consult a CPA.
Schools (NCES district)
- District
- Western School District
- NCES district ID
- 2635940
- Math proficiency
- 33% ▼ -9.00%
- Reading proficiency
- 50% ▼ -2.00%
- Median HH income
- $54,441
- Composite
- 36.1/100
- National rank
- #4755
- State rank
- #179 of 540 in MI
Livability — Blackman
No livability data for this city. (Only ~50 U.S. cities are tracked.)
Census & demographics
- County
- Jackson County · 85,581 people
- Metro
- Jackson, MI
- Population (ZIP)
- 36,474
- Household income
- $56,201
- Rent vs Own
- Severe rent burden
- 1383.0
Population outlook (Jackson County) Hauer SSP2
- Today (2025)
- 156,365 people
- By 2030
- 153,123 · -2.1%
- By 2040
- 144,981 · -7.3%
- By 2050
- 135,671 · -13.2%
- By 2075
- 113,833 · -27.2%
- By 2100
- 86,592 · -44.6%
Race, ethnicity, and origin ACS 2023
- Neighborhood character
- Predominantly White (73%)
- Race & ethnicity
- White 73% Black 15% Two or more races 9% Hispanic / Latino 5%
- Common ancestry
- Romanian 6% Lithuanian 3% Slovak 2%
- Foreign-born
- 2% · Canada
- Languages at home
- 97% English-only · Spanish 1% Other Indo-European 1%
Political lean MEDSL · Jackson
- 2024 margin
- Strong R (+21.3) · D 38.6% · R 59.9% · Other 1.5%
- 2008→2024 swing
- -23.7pp toward R · 2008: 2.4pp · 2024: -21.3pp
- All cycles
- 2024: R+21.3 2020: R+19.0 2016: R+20.1 2012: R+5.8 2008: D+2.4
Not yet ingested
- Civics
- —
Market trends
- HPI YoY
- ▼ -98.09%
- Current HPI
- 211.5474
- Rent YoY
- ▲ 7.54%
- Metro
- Jackson, MI
- State GDP YoY
- ▲ 1.37%
- F500 in state
- 28
Industry mix (Fortune 500 HQ in MI)
| Industry | F500 HQs | Revenue |
|---|---|---|
| Automotive Parts | 3 | $48B |
|
||
| Automotive | 2 | $372B |
|
||
| Chemicals | 1 | $45B |
|
||
| Automotive Retail | 1 | $29B |
|
||
| Healthcare / Medical Devices | 1 | $23B |
|
||
| Automotive Technology | 1 | $20B |
|
||
Price history
+0.0% since first listed3 events — show timeline
- 2026-06-17 Listed $79,900 REALCOMP
- 2026-06-16 Listed $79,900 MiRealSource-MiMLS
- 2026-06-16 Listed $79,900 SW Michigan MLS
Property tax history
+3.5%/yrLatest (2025): $1,376 · +2.7% YoY. Source: county tax records.
Cash-flow waterfall
monthlySold comps — $/sqft
last 12 mo · ≤1 miLoading sold comps…