49133 Manzanita Dr · Homestead Valley, CA
Flood risk 1/10 · Minimal
- FEMA flood zone
- D
- Chance of flooding over 30 yrs
- 0.0%
- Est. flood insurance / yr
- $544 – $1,084
Fire risk 4/10 · Minor
- Est. fire insurance / yr
- $659 – $1,223
Heat risk 7/10 · Major
- Hot days now (above 96°F)
- 7 days/yr
- Hot days in 30 yrs
- 20 days/yr
Wind risk 1/10 · Minimal
- Chance of severe wind over 30 yrs
- —
Air-quality risk 6/10 · Moderate
- Unhealthy air days now
- 10 days/yr
- Unhealthy air days in 30 yrs
- 12 days/yr
Risk factors via First Street. Map © Google.
Why this score? — see what drove the B grade
The composite is a weighted blend of 9 inputs, each scored 0–100. Each bar is that input's sub-score; the figure is the points it added to the 100-point composite (weight × sub-score).
- Cash flow +28.3/30.0
- DSCR +10.0/10.0
- Appreciation +10.0/10.0
- 1% rule +7.5/10.0
- ARV discount +7.5/15.0
- Rent growth +2.5/5.0
- Schools +2.5/10.0
- Livability +2.5/5.0
- Condition / age +2.5/5.0
$193,200
🖨 Deal sheet 📄 Offer letter ✓ Due diligence
Listing remarks
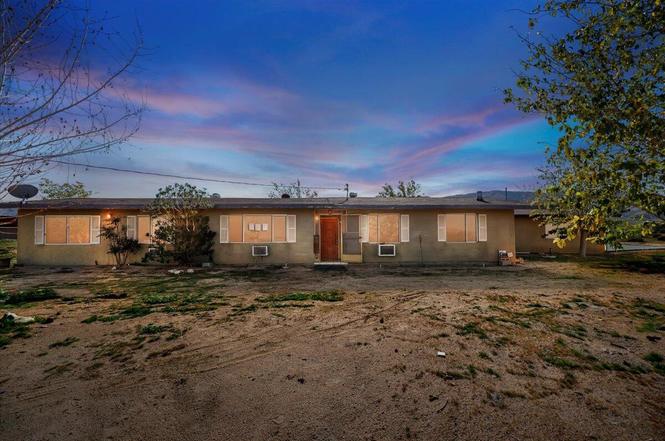
Enjoy stunning mountain views in Johnson Valley from this four-bedroom, two-bath home situated on five acres of peaceful, private land. The home features a spacious living room with an open floor plan, perfect for entertaining, along with a two-car garage. Experience wide-open space, quiet surroundings, and endless possibilities in this serene desert retreat.
Key facts
- Open floor plan
- Five acres
- Mountain views
Tags
Property features AI
Finance
- Other: Directions: Hwy 247, turn south on Gin and west on Manzanita; cross streets Gin and Joshua Tree Road; Short term rental status unknown; Will not consider lease
- Financial info: Sale considered for Cash and FHA; Standard sale; Possession at close of escrow; Property sold As Is
- HOA & community: No monthly association fee
Exterior
- Parking: Circular driveway; Driveway; Attached 2-car garage; 2 total parking spaces
- Security: No security features
- Utilities: Well water; Septic tank
- Home design: Single family residence; Detached; Single-story; Ground level entry; Appraiser-sourced year built
- Exterior features: Desert, valley and mountain views; Fee simple land
Interior
- Flooring: Concrete; Other
- Bathrooms: 2 full bathrooms
- Heating & cooling: Central heating; Wood stove; Wood fuel heating; Wall/window cooling units
- Interior features: Unfurnished; Living room
- Laundry & utility: Propane
Neighborhood map
What this means for you Summary
Snapshot
- This is a 4-bed/2.0-bath single-family listed at $193k.
Deal economics
- At list price, monthly cash flow is $620 ($7k/yr) — positive.
- The deal already cash-flows at list — no discount required.
- Meets the 1% rule at list price ($2k rent vs $193k).
- Recommended offer: $182k (6.0% below list) — sets the bar for market timing.
- Cap rate 10.1% vs local median 3.7% in Homestead Valley — top-decile yield for the area; either an underpriced asset or a hidden risk that comps aren't pricing in. Stress-test before assuming the spread holds.
Location & tenants
- Location reads 49/100 on livability (#1,167 in CA) — a working-class tenant base; expect higher turnover. Strengths: housing A+; Watch: schools F, amenities F, commute F.
- Lucerne Valley Unified (rural): math 22% / reading 33% proficiency, ranked #1,155 of 1,400 in CA (top 82%) — low school quality limits family demand, transient renter base, plan for 1-2y turnover; 78% free/reduced lunch — lower-income household profile, screen leases tightly.
- Market conditions: 196 active listings in the ZIP; 5,458 units permitted in San Bernardino County in 2024 (1,500 in 5+ unit buildings).
Forward outlook
- In year one you build about $21k of equity ($1k loan paydown + $19k appreciation (10.0% local appreciation)).
- San Bernardino County population projected at +15% by 2050 — modest demand growth; plan on rents tracking national, not racing it.
- At projected returns (10.0% appreciation + 3.0% rent growth), your $54k cash investment doubles in ~2 years — after that, you're playing with house money.
- By year 2, paydown + projected appreciation supports a ~$33k cash-out refi (75% LTV) — recoverable capital for the next deal without selling this one.
Negotiation context
- It's been on market 75 days — a 6% lower offer ($182k) is reasonable based on typical stale-listing flexibility.
- 3 sale attempts; this cycle's ask has dropped $17k (8%) from the opening price — seller is motivated, your offer sets the floor, not the list.
- Current owner paid $62k; list at $193k implies a 209% gain — meaningful room to come down on a strong offer.
Risks & watch-outs
- Watch-outs: built in 1957 — expect roof / HVAC / electrical / plumbing capex.
- Climate carrying-cost: extreme-heat days projected 7→20/yr by 2055 (HVAC capex compounding) — expect insurance premiums to compound above CPI over the hold.
Questions for the listing agent
- It's been on market 75 days. Have you received any prior offers? Is the seller open to a 6% concession, seller financing, or rate buy-down credit?
- Built in 1957 — when were the roof, HVAC, electrical panel, plumbing, and water heater last replaced?
- Why hasn't it sold? Are there any deal-killer items the seller is aware of (foundation, flood, title, zoning, code violations)?
- Is there a deadline driving the sale (1031 exchange, divorce, estate, relocation)? That informs how much negotiation room exists.
- Schools are F-rated, which usually means shorter tenancies and higher turnover. Who's the typical renter profile here, and what's been the actual vacancy rate?
- What's the average days-on-market for RENTAL listings here right now (not sales)? A rising rental-DOM trend means longer vacancies and softer asking-rent achievability than the comps imply.
- What's the recent tenant-quality profile in this submarket — average credit score on applications, eviction rate, late-payment / NSF rate, and stable-employment percentage? A property-management company in the area should have these aggregated.
- How much new for-sale + rental construction is in the pipeline within 1–3 miles? Heavy new supply typically softens prices + rents 12–24 months out; constrained supply supports both.
Investment metrics
- 1% rule
- 1.25% ✓
- Cap rate
- 10.15%
- Cash-on-cash
- 13.76%
- DSCR
- 1.61
- GRM
- 6.7
CMA / ARV
No comps found within radius.
Projected returns pro-forma
10.0% appreciation · 3.0% rent growth · sell at horizon
- IRR
- 34.4%
- Equity multiple
- 3.68×
- Total profit
- $144,742
- Equity at exit
- $174,050
- IRR
- 29.7%
- Equity multiple
- 8.31×
- Total profit
- $395,172
- Equity at exit
- $375,345
Cash invested: $54,096 (down + closing). Projections, not guarantees.
Landlord ↔ Tenant lean methodology
- Overall (STATE)
- 18 Strongly Tenant-Friendly
- State California
- 18 Strongly Tenant-Friendly · D+13
- County
- — inherits STATE
- City
- — inherits STATE
ZIP-level market 92285
- Home prices YoY
- 31.4%
- Active inventory
- 196
- Price-to-rent
- 6.7×
Monthly cashflow live
- Estimated rent
- $2,408 medium interval (Pro) →
- Mortgage (P&I)
- −$1,013
- Tax from tax record
- −$188 /mo · $2,260/yr
- Insurance
- −$80
- HOA
- −$0
- Vacancy / Maint / Mgmt
- −$506
- Net cashflow
- $620
Break-even live
UW: 25.0% down · 7.5% · 30yr · 1.5% tax · 5.0% vac · 8.0% maint · 8.0% mgmt
Financing live
Cash to close
- Down payment
- $48,300
- Closing costs
- $5,796
- Reserves months
- —
- Total cash needed
- —
Loan-product check · same deal, 3 products live
Conventional
25% down · 7.5% · 30yr
- Down + closing
- —
- Monthly P&I
- —
- Monthly cashflow
- —
- DSCR
- —
- Eligible?
- —
Personal DTI + credit; lowest rate.
DSCR
20% down · 8.5% · 30yr
- Down + closing
- —
- Monthly P&I
- —
- Monthly cashflow
- —
- DSCR
- —
- Eligible?
- —
No personal income docs; deal must DSCR.
Hard money
10% down · 12.0% · 12mo
- Down + closing
- —
- Monthly P&I
- —
- Monthly cashflow
- —
- DSCR
- —
- Eligible?
- —
Short-term bridge; refi at stabilization.
Listing history 9 events
-
2026-06-13statusdays on market $193,200 Pending 75 DOM
-
2026-06-09days on market $193,200 Active 74 DOM
-
2026-06-08days on market $193,200 Active 73 DOM
-
2026-06-07days on market $193,200 Active 72 DOM
-
2026-06-04days on market $193,200 Active 69 DOM
-
2026-06-03days on market $193,200 Active 68 DOM
-
2026-06-02days on market $193,200 Active 67 DOM
-
2026-06-01days on market $193,200 Active 66 DOM
-
2026-05-31days on market $193,200 Active 65 DOM
ⓘ Source: listings_history table (triggers on properties + properties_extension) + one-shot
backfill from property_details.listing_events for pre-trigger history.
Tax reassessment forecast CA · Resets to sale price
- Current annual tax
- $2,260 · $188/mo
- Projected year-2 tax
- $2,260 · $188/mo
- Expected delta
- $0/yr ($0/mo · 0.0%)
ⓘ Screening estimate from a state-policy table — verify with the county assessor before closing.
Climate risk First Street
- Flood 1/10 Low FEMA zone D · 0% chance over 30 yrs
- Wildfire 4/10 Moderate
- Heat 7/10 Severe 7 d/yr ≥96°F today · 20 d/yr by 30 yrs out
- Wind 1/10 Low
- Air quality 6/10 Major 10 unhealthy d/yr today · 12 by 30 yrs out
Nearby sold comps map
Loading sold comps map…
Walkable amenities ~0.75 mi
Loading nearby amenities…
Taxation est. · year 1
- Rental income
- $28,897
- − Mortgage interest
- −$10,822
- − Property taxes
- −$2,260
- − Insurance
- −$966
- − Repairs & maintenance
- −$2,312
- − Management
- −$2,312
- − Depreciation
- −$5,620
- Taxable income
- $4,606
- Est. tax owed @ 24.0%
- −$1,105
- After-tax cash flow
- $6,340/yr
For passive investors: Depreciation is non-cash, so a rental often shows a tax loss while cash-flowing — sheltering income. Rental losses are passive: they offset passive income freely, and up to $25,000/yr can offset ordinary (W-2) income if you actively participate and your MAGI is under $100k (phasing out to $0 by $150k); unused losses carry forward. On sale, claimed depreciation is recaptured at up to 25%, and gains may owe capital-gains tax (a 1031 exchange can defer both). Figures are a year-1 estimate at your 24.0% rate — not tax advice; consult a CPA.
Schools (NCES district)
- District
- Lucerne Valley Unified
- NCES district ID
- 0600015
- Math proficiency
- 22% ▲ 6.00%
- Reading proficiency
- 33% ▲ 1.00%
- Median HH income
- $28,341
- Composite
- 24.98/100
- National rank
- #12969
- State rank
- #1155 of 1400 in CA
Livability — Homestead Valley
- Score
- 49/100
- State rank
- #1167
- US rank
- #25885
Category grades
Schools grade is shown separately in the Schools card above.
Census & demographics
- Population (ZIP)
- 2,914
Population outlook (San Bernardino County) Hauer SSP2
- Today (2025)
- 2,300,329 people
- By 2030
- 2,378,907 · +3.4%
- By 2040
- 2,523,137 · +9.7%
- By 2050
- 2,642,388 · +14.9%
- By 2075
- 2,880,769 · +25.2%
- By 2100
- 2,909,436 · +26.5%
Race, ethnicity, and origin ACS 2023
- Neighborhood character
- Predominantly White (67%)
- Race & ethnicity
- White 67% Hispanic / Latino 20% Two or more races 15% Black 4% Native American 4% Asian 2%
- Hispanic origin (detail)
- Mexican 17%
- Common ancestry
- Italian 6% Romanian 3% Iranian 2%
- Foreign-born
- 8% · Canada, Philippines
- Languages at home
- 82% English-only · Spanish 16%
Political lean MEDSL · San Bernardino
- 2024 margin
- Toss-up / Even · D 47.5% · R 49.7% · Other 2.8%
- 2008→2024 swing
- -8.5pp toward R · 2008: 6.3pp · 2024: -2.1pp
- All cycles
- 2024: R+2.1 2020: D+10.7 2016: D+9.8 2012: D+5.4 2008: D+6.3
Not yet ingested
- Civics
- —
Market trends
- HPI YoY
- ▲ 128.05%
- Current HPI
- 536.4822
- Rent YoY
- —
- Metro
- —
- State GDP YoY
- ▲ 3.21%
- F500 in state
- 116
Industry mix (Fortune 500 HQ in CA)
| Industry | F500 HQs | Revenue |
|---|---|---|
| Technology | 27 | $1,492B |
|
||
| Financial Services | 3 | $174B |
|
||
| Retail | 3 | $44B |
|
||
| Insurance | 3 | $26B |
|
||
| Media / Entertainment | 2 | $115B |
|
||
| Pharmaceuticals / Biotech | 2 | $62B |
|
||
Price history
+209.1% since first listed8 events — show timeline
- 2026-05-27 Relisted — GPSMLS
- 2026-02-23 Listing Removed — GPSMLS
- 2026-02-23 Pending — GPSMLS
- 2026-02-10 Relisted — GPSMLS
- 2026-02-05 Pending — GPSMLS
- 2026-02-03 Price Changed $193,200 GPSMLS
- 2025-12-19 Listed $210,000 GPSMLS
- 2002-01-11 Sold (Public Records) $62,500 Public Records
Property tax history
+6.6%/yrLatest (2025): $2,260 · +89.1% YoY. Source: county tax records.
Cash-flow waterfall
monthlySold comps — $/sqft
last 12 mo · ≤1 miLoading sold comps…