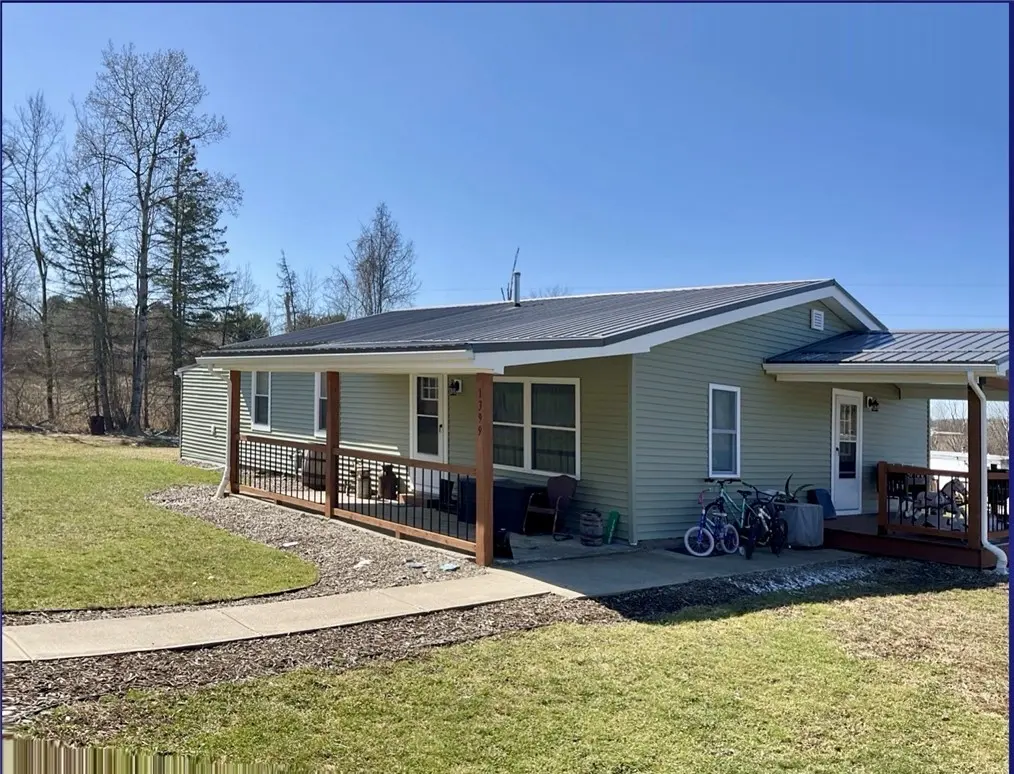
1399 Martin Hill Rd · South Corning, NY
Flood risk 1/10 · Minimal
- FEMA flood zone
- X
- Chance of flooding over 30 yrs
- 0.0%
- Est. flood insurance / yr
- $473 – $860
Fire risk 4/10 · Minor
- Est. fire insurance / yr
- $691 – $1,283
Heat risk 2/10 · Minimal
- Hot days now (above 93°F)
- 7 days/yr
- Hot days in 30 yrs
- 15 days/yr
Wind risk 1/10 · Minimal
- Chance of severe wind over 30 yrs
- 0.0%
Air-quality risk 1/10 · Minimal
- Unhealthy air days now
- 0 days/yr
- Unhealthy air days in 30 yrs
- 0 days/yr
Risk factors via First Street. Map © Google.
Why this score? — see what drove the D grade
The composite is a weighted blend of 9 inputs, each scored 0–100. Each bar is that input's sub-score; the figure is the points it added to the 100-point composite (weight × sub-score).
- Cash flow +13.9/30.0
- ARV discount +7.5/15.0
- 1% rule +4.3/10.0
- DSCR +4.2/10.0
- Schools +4.2/10.0
- Livability +3.8/5.0
- Rent growth +2.5/5.0
- Condition / age +2.5/5.0
- Appreciation +0.0/10.0
$189,900
🖨 Deal sheet (PDF) 📄 Offer letter ✓ Due diligence
Listing remarks
A perfect blend of country living, and comfort in this 4 bed, 2 full bath ranch with so many updates! Take the drive just outside of south corning, and see this country ranch with new siding, new kitchen, refinished hardwood floors, refreshed bathrooms, new electrical service, replacement windows and doors, new plumbing, new gas lines in the house, as well as from road to the meter. Additionally seamless gutters, main level laundry and a new side porch are just few of the updates on a very long list. Longing for a bit of the quiet life, but yet close to everything you need? Here is your chance to claim this one, because the work has already been done. This could very well be the place you w
Key facts
- New kitchen
- New siding
- Refreshed bathrooms
Tags
Neighborhood map
What this means for you Summary
Snapshot
- This is a 3-bed/2.0-bath single-family listed at $190k.
Deal economics
- At list price, monthly cash flow is $20 ($243/yr) — positive.
- The deal already cash-flows at list — no discount required.
- To meet the 1% rule (rent ≥ 1% of price), the offer needs to be $177k (6.7% below list).
- Recommended offer: $177k (6.7% below list) — sets the bar for 1% rule.
Location & tenants
- Location reads 76/100 on livability (#228 in NY, #3,596 nationally) — a middle-class / working-renter tenant base. Strengths: housing A+, health & safety A+, crime A; Watch: schools D, amenities F, commute F.
- Corning City School District (town): math 44% / reading 53% proficiency, ranked #406 of 590 in NY (top 69%) — families likely to look elsewhere, expect single-tenant / working-renter base with shorter leases.
- Market conditions: 106 active listings in the ZIP; 196 units permitted in Steuben County in 2024 (0 in 5+ unit buildings).
Forward outlook
- Local home prices are declining (-3.0%/yr); year-one equity from $1k of loan paydown is wiped out by about $6k of value loss. Plan a longer hold.
- Steuben County population projected at -20% by 2050 — secular population decline; favor cash flow + early exit over multi-decade hold.
Negotiation context
- Only 3 days on market — expect competitive offers; lowballing is unlikely to land.
- Current owner paid $80k; list at $190k implies a 137% gain — meaningful room to come down on a strong offer.
Questions for the listing agent
- Built in 1961 — when were the roof, HVAC, electrical panel, plumbing, and water heater last replaced?
- Is there a deadline driving the sale (1031 exchange, divorce, estate, relocation)? That informs how much negotiation room exists.
- Schools are D-rated, which usually means shorter tenancies and higher turnover. Who's the typical renter profile here, and what's been the actual vacancy rate?
- The area grade is low — what's the realistic commute time and amenity access for the typical tenant pool here? Any planned neighborhood developments (good or bad) we should know about?
- What's the average days-on-market for RENTAL listings here right now (not sales)? A rising rental-DOM trend means longer vacancies and softer asking-rent achievability than the comps imply.
- What's the recent tenant-quality profile in this submarket — average credit score on applications, eviction rate, late-payment / NSF rate, and stable-employment percentage? A property-management company in the area should have these aggregated.
- How much new for-sale + rental construction is in the pipeline within 1–3 miles? Heavy new supply typically softens prices + rents 12–24 months out; constrained supply supports both.
Investment metrics
- 1% rule
- 0.93% ✗
- Cap rate
- 6.42%
- Cash-on-cash
- 0.46%
- DSCR
- 1.02
- GRM
- 8.9
CMA / ARV
No comps found within radius.
Projected returns pro-forma
-3.0% appreciation · 3.0% rent growth · sell at horizon
- IRR
- -15.5%
- Equity multiple
- 0.45×
- Total profit
- $-29,414
- Equity at exit
- $28,315
- IRR
- -7.0%
- Equity multiple
- 0.55×
- Total profit
- $-23,674
- Equity at exit
- $16,419
Cash invested: $53,172 (down + closing). Projections, not guarantees.
Landlord ↔ Tenant lean methodology
- Overall (STATE)
- 15 Strongly Tenant-Friendly
- State New York
- 15 Strongly Tenant-Friendly · D+10
- County
- — inherits STATE
- City
- — inherits STATE
ZIP-level market 14830
- Active inventory
- 106
- Price-to-rent
- 8.9×
Monthly cashflow live
- Estimated rent
- $1,773 medium interval (Pro) →
- Mortgage (P&I)
- −$996
- Tax from tax record
- −$305 /mo · $3,662/yr
- Insurance
- −$79
- HOA
- −$0
- Vacancy / Maint / Mgmt
- −$372
- Net cashflow
- $20
Break-even live
Sensitivity live
| Price | -10% $128 | -5% $74 | +0% $20 | +5% $-33 | +10% $-87 |
|---|---|---|---|---|---|
| Rent | -10% $-120 | -5% $-50 | +0% $20 | +5% $90 | +10% $160 |
| Rate | -1.0pp $116 | -0.5pp $69 | base $20 | +0.5pp $-29 | +1.0pp $-79 |
UW: 25.0% down · 7.5% · 30yr · 1.5% tax · 5.0% vac · 8.0% maint · 8.0% mgmt
Financing live
Cash to close
- Down payment
- $47,475
- Closing costs
- $5,697
- Reserves months
- —
- Total cash needed
- —
Loan-product check · same deal, 3 products live
Conventional
25% down · 7.5% · 30yr
- Down + closing
- —
- Monthly P&I
- —
- Monthly cashflow
- —
- DSCR
- —
- Eligible?
- —
Personal DTI + credit; lowest rate.
DSCR
20% down · 8.5% · 30yr
- Down + closing
- —
- Monthly P&I
- —
- Monthly cashflow
- —
- DSCR
- —
- Eligible?
- —
No personal income docs; deal must DSCR.
Hard money
10% down · 12.0% · 12mo
- Down + closing
- —
- Monthly P&I
- —
- Monthly cashflow
- —
- DSCR
- —
- Eligible?
- —
Short-term bridge; refi at stabilization.
Listing history 4 events
-
2026-03-28status Pending
-
2026-03-25$189,900 Active
-
2023-04-04soldstatus $80,000
-
2015-03-10soldstatus $28,000
ⓘ Source: listings_history table (triggers on properties + properties_extension) + one-shot
backfill from property_details.listing_events for pre-trigger history.
Tax reassessment forecast NY · Partial reset (capped growth)
- Current annual tax
- $3,662 · $305/mo
- Projected year-2 tax
- $3,662 · $305/mo
- Expected delta
- $0/yr ($0/mo · 0.0%)
ⓘ Screening estimate from a state-policy table — verify with the county assessor before closing.
Climate risk First Street
- Flood 1/10 Low FEMA zone X · 0% chance over 30 yrs
- Wildfire 4/10 Moderate
- Heat 2/10 Low 7 d/yr ≥93°F today · 15 d/yr by 30 yrs out
- Wind 1/10 Low 0% chance of damaging wind over 30 yrs
- Air quality 1/10 Low 0 unhealthy d/yr today · 0 by 30 yrs out
Nearby sold comps map
Loading sold comps map…
Walkable amenities ~0.75 mi
Loading nearby amenities…
Taxation est. · year 1
- Rental income
- $21,272
- − Mortgage interest
- −$10,637
- − Property taxes
- −$3,662
- − Insurance
- −$950
- − Repairs & maintenance
- −$1,702
- − Management
- −$1,702
- − Depreciation
- −$5,524
- Taxable loss
- −$2,905
- Est. tax savings @ 24.0%
- +$697
- After-tax cash flow
- $940/yr
For passive investors: Depreciation is non-cash, so a rental often shows a tax loss while cash-flowing — sheltering income. Rental losses are passive: they offset passive income freely, and up to $25,000/yr can offset ordinary (W-2) income if you actively participate and your MAGI is under $100k (phasing out to $0 by $150k); unused losses carry forward. On sale, claimed depreciation is recaptured at up to 25%, and gains may owe capital-gains tax (a 1031 exchange can defer both). Figures are a year-1 estimate at your 24.0% rate — not tax advice; consult a CPA.
Schools (NCES district)
- District
- Corning City School District
- NCES district ID
- 3608400
- Math proficiency
- 44% ▼ -12.00%
- Reading proficiency
- 53% ▲ 4.00%
- Median HH income
- $53,042
- Composite
- 41.8/100
- National rank
- #3392
- State rank
- #406 of 590 in NY
Livability — South Corning
- Score
- 76/100
- State rank
- #228
- US rank
- #3596
Category grades
Schools grade is shown separately in the Schools card above.
Census & demographics
- County
- Steuben County · 41,193 people
- Metro
- Corning, NY
- Population (ZIP)
- 19,015
- Household income
- $73,263
- Rent vs Own
- Severe rent burden
- 565.0
Population outlook (Steuben County) Hauer SSP2
- Today (2025)
- 93,062 people
- By 2030
- 89,793 · -3.5%
- By 2040
- 82,353 · -11.5%
- By 2050
- 74,286 · -20.2%
- By 2075
- 55,589 · -40.3%
- By 2100
- 37,587 · -59.6%
Race, ethnicity, and origin ACS 2023
- Neighborhood character
- Predominantly White (91%)
- Race & ethnicity
- White 91% Two or more races 3% Black 3% Hispanic / Latino 3% Asian 2%
- Common ancestry
- Romanian 4% Slovak 3% Lithuanian 2%
- Foreign-born
- 5% · Canada, China
- Languages at home
- 95% English-only · Russian/Polish/Slavic 1% Spanish 1% Other Asian/Pacific 1%
Political lean MEDSL · Steuben
- 2024 margin
- Solid R (+31.8) · D 34.1% · R 65.9%
- 2008→2024 swing
- -15.0pp toward R · 2008: -16.8pp · 2024: -31.8pp
- All cycles
- 2024: R+31.8 2020: R+29.6 2016: R+36.2 2012: R+16.4 2008: R+16.8
Not yet ingested
- Civics
- —
Market trends
- HPI YoY
- ▼ -94.59%
- Current HPI
- 173.9857
- Rent YoY
- —
- Metro
- Corning, NY
- State GDP YoY
- ▲ 2.60%
- F500 in state
- 92
Industry mix (Fortune 500 HQ in NY)
| Industry | F500 HQs | Revenue |
|---|---|---|
| Financial Services | 10 | $950B |
|
||
| Consumer Goods | 9 | $162B |
|
||
| Insurance | 4 | $225B |
|
||
| Telecommunications | 2 | $144B |
|
||
| Pharmaceuticals | 2 | $112B |
|
||
| Media / Entertainment | 2 | $69B |
|
||
Price history
+578.2% since first listed4 events — show timeline
- 2026-03-28 Pending — UNYREIS
- 2026-03-25 Listed $189,900 UNYREIS
- 2023-04-04 Sold (Public Records) $80,000 Public Records
- 2015-03-10 Sold (Public Records) $28,000 Public Records
Property tax history
+3.8%/yrLatest (2025): $3,662 · +3.3% YoY. Source: county tax records.
Cash-flow waterfall
monthlySold comps — $/sqft
last 12 mo · ≤1 miLoading sold comps…