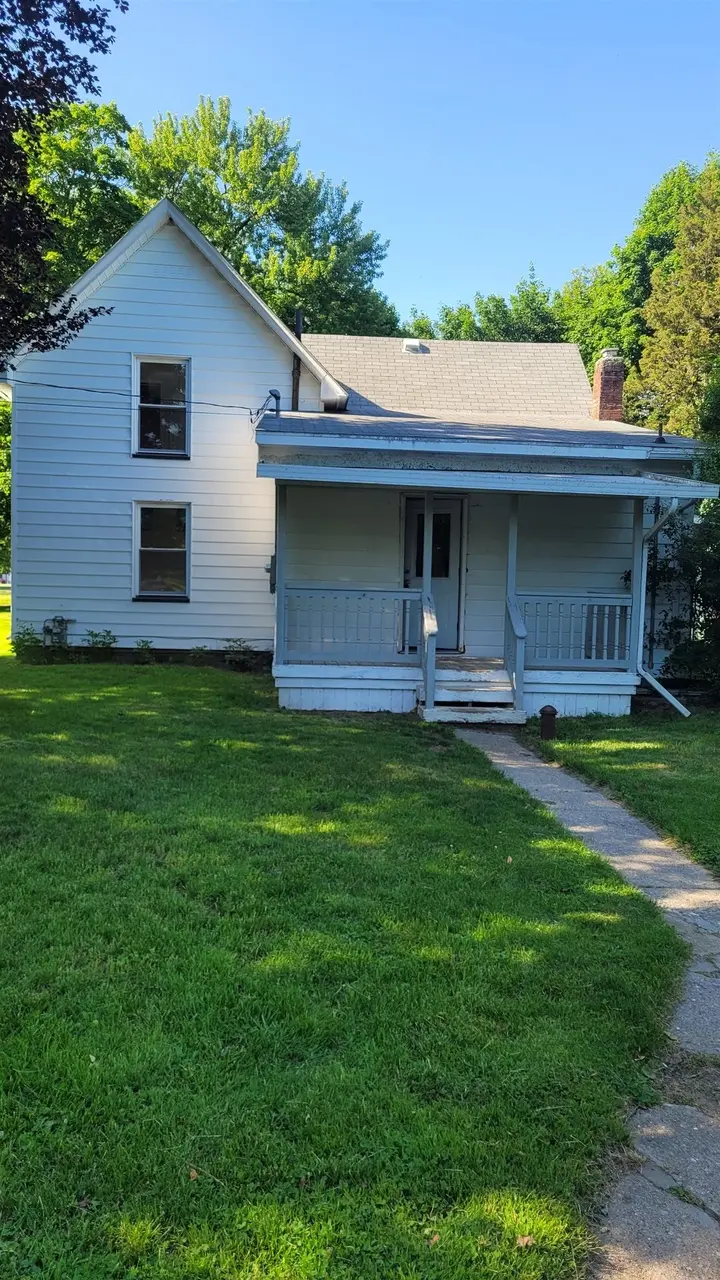
1013 Oak St · Lennon, MI
Flood risk 1/10 · Minimal
- FEMA flood zone
- X (unshaded)
- Chance of flooding over 30 yrs
- 0.0%
- Est. flood insurance / yr
- $507 – $1,088
Fire risk 1/10 · Minimal
- Est. fire insurance / yr
- $784 – $1,456
Heat risk 2/10 · Minimal
- Hot days now (above 97°F)
- 7 days/yr
- Hot days in 30 yrs
- 15 days/yr
Wind risk 2/10 · Minimal
- Chance of severe wind over 30 yrs
- —
Air-quality risk 2/10 · Minimal
- Unhealthy air days now
- 1 days/yr
- Unhealthy air days in 30 yrs
- 3 days/yr
Risk factors via First Street. Map © Google.
Why this score? — see what drove the B grade
The composite is a weighted blend of 9 inputs, each scored 0–100. Each bar is that input's sub-score; the figure is the points it added to the 100-point composite (weight × sub-score).
- Cash flow +25.2/30.0
- ARV discount +15.0/15.0
- Appreciation +10.0/10.0
- DSCR +8.2/10.0
- 1% rule +5.5/10.0
- Livability +3.2/5.0
- Rent growth +2.5/5.0
- Condition / age +2.5/5.0
- Schools +2.4/10.0
$125,000
🖨 Deal sheet 📄 Offer letter ✓ Due diligence
Listing remarks MLS
Great opportunity to make this 4 bedroom home your own! This home sits on over an acre in Lennon. This home is totally livable but could use some TLC. Vinyl windows, First floor laundry. Hardwood floors. Well water. Fresh paint. All appliances stay. Large, fenced yard.
Key facts
- Vinyl windows
- First floor laundry
- Large fenced yard
Tags
Property features AI
Finance
- Other: Approximately 1.19 acre lot (irregular shape)
- HOA & community: Homeowners association present
Exterior
- Utilities: Private well water; Public sewer
- Home design: Single-family residence; One and one-half stories
- Construction: Aluminum siding
- Exterior features: Patio; Porch
Interior
- Kitchen: Dishwasher; Microwave; Oven; Refrigerator; Range
- Bedrooms: Total rooms: 7
- Bathrooms: 1 full bathroom
- Heating & cooling: Central air; Forced air heating; Natural gas heating
- Interior features: Dishwasher; Dryer; Microwave; Oven; Refrigerator; Range; Washer; Crawl space basement
- Laundry & utility: Washer; Dryer
Neighborhood map
What this means for you Summary
Snapshot
- This is a 4-bed/1.0-bath single-family listed at $125k.
Deal economics
- At list price, monthly cash flow is $278 ($3k/yr) — positive.
- The deal already cash-flows at list — no discount required.
- Meets the 1% rule at list price ($1k rent vs $125k).
Location & tenants
- Location reads 63/100 on livability (#510 in MI) — a middle-class / working-renter tenant base. Strengths: cost of living A+, housing A+; Watch: employment D+, schools D-, crime D-.
- Durand Area Schools (rural): math 17% / reading 38% proficiency, ranked #395 of 540 in MI (top 73%) — low school quality limits family demand, transient renter base, plan for 1-2y turnover.
- Market conditions: 17 active listings in the ZIP; 74 units permitted in Shiawassee County in 2024 (0 in 5+ unit buildings).
Forward outlook
- In year one you build about $13k of equity ($864 loan paydown + $12k appreciation (10.0% local appreciation)).
- Shiawassee County population projected at -25% by 2050 — secular population decline; favor cash flow + early exit over multi-decade hold.
- At projected returns (10.0% appreciation + 3.0% rent growth), your $35k cash investment doubles in ~2 years — after that, you're playing with house money.
- By year 3, paydown + projected appreciation supports a ~$34k cash-out refi (75% LTV) — recoverable capital for the next deal without selling this one.
Negotiation context
- Only 11 days on market — expect competitive offers; lowballing is unlikely to land.
- 6 sale attempts since 4y ago with the ask held roughly flat each time — persistent listings suggest the price (not the market) is what's stuck; bring a comps-based counter.
- Current owner paid $80k; list at $125k implies a 56% gain — meaningful room to come down on a strong offer.
Risks & watch-outs
- Watch-outs: built in 1889 — expect roof / HVAC / electrical / plumbing capex.
Questions for the listing agent
- Built in 1889 — when were the roof, HVAC, electrical panel, plumbing, and water heater last replaced?
- Is there a deadline driving the sale (1031 exchange, divorce, estate, relocation)? That informs how much negotiation room exists.
- Schools are D-rated, which usually means shorter tenancies and higher turnover. Who's the typical renter profile here, and what's been the actual vacancy rate?
- Crime grade is D in this area — have there been break-ins, vandalism, or insurance claims at this property in the last 3 years? What carrier currently insures it and at what premium?
- What's the average days-on-market for RENTAL listings here right now (not sales)? A rising rental-DOM trend means longer vacancies and softer asking-rent achievability than the comps imply.
- What's the recent tenant-quality profile in this submarket — average credit score on applications, eviction rate, late-payment / NSF rate, and stable-employment percentage? A property-management company in the area should have these aggregated.
- How much new for-sale + rental construction is in the pipeline within 1–3 miles? Heavy new supply typically softens prices + rents 12–24 months out; constrained supply supports both.
Investment metrics
- 1% rule
- 1.05% ✓
- Cap rate
- 8.96%
- Cash-on-cash
- 9.54%
- DSCR
- 1.42
- GRM
- 7.9
CMA / ARV
- ARV (on-the-fly)
- $158,600
- Comps found
- 1
Show comp detail 1 sale within ~0.75 mi
| Address | Dist | Beds/Ba | Sqft | Sold | Price | $/sf | Match |
|---|---|---|---|---|---|---|---|
| 2509 S Sheridan Rd | 0.29mi | 3/1.0 (-1) | 1,184 (-9%) | 0mo | $145,000 | $122 | 66 |
Match score weights: distance 35% · size 25% · config 20% · recency 20%. Top-matched comps best support the ARV.
Projected returns pro-forma
10.0% appreciation · 3.0% rent growth · sell at horizon
- IRR
- 31.2%
- Equity multiple
- 3.45×
- Total profit
- $85,751
- Equity at exit
- $112,610
- IRR
- 27.0%
- Equity multiple
- 7.81×
- Total profit
- $238,501
- Equity at exit
- $242,848
Cash invested: $35,000 (down + closing). Projections, not guarantees.
Landlord ↔ Tenant lean methodology
- Overall (STATE)
- 62 Landlord-Friendly
- State Michigan
- 62 Landlord-Friendly · EVEN
- County
- — inherits STATE
- City
- — inherits STATE
ZIP-level market 48449
- Home prices YoY
- 26.4%
- Active inventory
- 17
- Price-to-rent
- 7.9×
Monthly cashflow live
- Estimated rent
- $1,313 medium interval (Pro) →
- Mortgage (P&I)
- −$656
- Tax from tax record
- −$52 /mo · $619/yr
- Insurance
- −$52
- HOA
- −$0
- Vacancy / Maint / Mgmt
- −$276
- Net cashflow
- $278
Break-even live
UW: 25.0% down · 7.5% · 30yr · 1.5% tax · 5.0% vac · 8.0% maint · 8.0% mgmt
Financing live
Cash to close
- Down payment
- $31,250
- Closing costs
- $3,750
- Reserves months
- —
- Total cash needed
- —
Loan-product check · same deal, 3 products live
Conventional
25% down · 7.5% · 30yr
- Down + closing
- —
- Monthly P&I
- —
- Monthly cashflow
- —
- DSCR
- —
- Eligible?
- —
Personal DTI + credit; lowest rate.
DSCR
20% down · 8.5% · 30yr
- Down + closing
- —
- Monthly P&I
- —
- Monthly cashflow
- —
- DSCR
- —
- Eligible?
- —
No personal income docs; deal must DSCR.
Hard money
10% down · 12.0% · 12mo
- Down + closing
- —
- Monthly P&I
- —
- Monthly cashflow
- —
- DSCR
- —
- Eligible?
- —
Short-term bridge; refi at stabilization.
Listing history 9 events
-
2026-06-15statusdays on market $125,000 Pending 11 DOM
-
2026-06-14days on market $125,000 Active 10 DOM
-
2026-06-13days on market $125,000 Active 9 DOM
-
2026-06-10days on market $125,000 Active 7 DOM
-
2026-06-09days on market $125,000 Active 6 DOM
-
2026-06-08days on market $125,000 Active 5 DOM
-
2026-06-07days on market $125,000 Active 4 DOM
-
2026-06-03remarks 269-char remark
-
2026-06-03$125,000 Active 1 DOM
ⓘ Source: listings_history table (triggers on properties + properties_extension) + one-shot
backfill from property_details.listing_events for pre-trigger history.
Tax reassessment forecast MI · Partial reset (capped growth)
- Current annual tax
- $619 · $52/mo
- Projected year-2 tax
- $1,272 · $106/mo
- Expected delta
- +$653/yr (+$54/mo · 105.6%)
ⓘ Screening estimate from a state-policy table — verify with the county assessor before closing.
Climate risk First Street
- Flood 1/10 Low FEMA zone X (unshaded) · 0% chance over 30 yrs
- Wildfire 1/10 Low
- Heat 2/10 Low 7 d/yr ≥97°F today · 15 d/yr by 30 yrs out
- Wind 2/10 Low
- Air quality 2/10 Low 1 unhealthy d/yr today · 3 by 30 yrs out
Nearby sold comps map
Loading sold comps map…
Walkable amenities ~0.75 mi
Loading nearby amenities…
Taxation est. · year 1
- Rental income
- $15,757
- − Mortgage interest
- −$7,002
- − Property taxes
- −$619
- − Insurance
- −$625
- − Repairs & maintenance
- −$1,261
- − Management
- −$1,261
- − Depreciation
- −$3,636
- Taxable income
- $1,354
- Est. tax owed @ 24.0%
- −$325
- After-tax cash flow
- $3,013/yr
For passive investors: Depreciation is non-cash, so a rental often shows a tax loss while cash-flowing — sheltering income. Rental losses are passive: they offset passive income freely, and up to $25,000/yr can offset ordinary (W-2) income if you actively participate and your MAGI is under $100k (phasing out to $0 by $150k); unused losses carry forward. On sale, claimed depreciation is recaptured at up to 25%, and gains may owe capital-gains tax (a 1031 exchange can defer both). Figures are a year-1 estimate at your 24.0% rate — not tax advice; consult a CPA.
Schools (NCES district)
- District
- Durand Area Schools
- NCES district ID
- 2612330
- Math proficiency
- 17% ▼ -16.00%
- Reading proficiency
- 38% ▼ -14.00%
- Median HH income
- $45,999
- Composite
- 23.67/100
- National rank
- #7838
- State rank
- #395 of 540 in MI
Livability — Lennon
- Score
- 63/100
- State rank
- #510
- US rank
- #15198
Category grades
Schools grade is shown separately in the Schools card above.
Census & demographics
- Census place
- Lennon, MI
- Population (ZIP)
- 2,760
Population outlook (Shiawassee County) Hauer SSP2
- Today (2025)
- 64,238 people
- By 2030
- 61,434 · -4.4%
- By 2040
- 55,054 · -14.3%
- By 2050
- 48,426 · -24.6%
- By 2075
- 35,995 · -44.0%
- By 2100
- 26,678 · -58.5%
Race, ethnicity, and origin ACS 2023
- Neighborhood character
- Predominantly White (89%)
- Race & ethnicity
- White 89% Two or more races 8% Hispanic / Latino 5%
- Hispanic origin (detail)
- Mexican 3% Dominican 2%
- Common ancestry
- Romanian 5% Lithuanian 4% Serbian 2%
- Foreign-born
- 0%
- Languages at home
- 99% English-only · German/W. Germanic 1%
Political lean MEDSL · Shiawassee
- 2024 margin
- Strong R (+23.1) · D 37.7% · R 60.8% · Other 1.6%
- 2008→2024 swing
- -31.7pp toward R · 2008: 8.6pp · 2024: -23.1pp
- All cycles
- 2024: R+23.1 2020: R+19.9 2016: R+19.6 2012: D+3.7 2008: D+8.6
Not yet ingested
- Civics
- —
Market trends
- HPI YoY
- ▲ 76.59%
- Current HPI
- 367.19
- Rent YoY
- —
- Metro
- —
- State GDP YoY
- ▲ 1.37%
- F500 in state
- 28
Industry mix (Fortune 500 HQ in MI)
| Industry | F500 HQs | Revenue |
|---|---|---|
| Automotive Parts | 3 | $48B |
|
||
| Automotive | 2 | $372B |
|
||
| Chemicals | 1 | $45B |
|
||
| Automotive Retail | 1 | $29B |
|
||
| Healthcare / Medical Devices | 1 | $23B |
|
||
| Automotive Technology | 1 | $20B |
|
||
Price history
+37.4% since first listed18 events — show timeline
- 2026-06-02 Listed $125,000 REALCOMP
- 2026-06-02 Listed $125,000 MiRealSource-MiMLS
- 2023-03-08 Sold (MLS) $80,000 MiRealSource-MiMLS
- 2023-03-08 Sold (MLS) $80,000 REALCOMP
- 2023-02-23 Sold (Public Records) $80,000 Public Records
- 2023-01-18 Pending — MiRealSource-MiMLS
- 2023-01-18 Pending — REALCOMP
- 2022-12-14 Price Changed $79,900 MiRealSource-MiMLS
- 2022-12-13 Price Changed $79,900 REALCOMP
- 2022-11-14 Relisted — MiRealSource-MiMLS
- 2022-11-14 Relisted — REALCOMP
- 2022-11-01 Pending — MiRealSource-MiMLS
- 2022-11-01 Pending — REALCOMP
- 2022-10-26 Price Changed $89,900 MiRealSource-MiMLS
- 2022-10-25 Price Changed $89,900 REALCOMP
- 2022-09-29 Listed $99,900 MiRealSource-MiMLS
- 2022-09-29 Listed $99,900 REALCOMP
- 2008-11-20 Sold (Public Records) $91,000 Public Records
Property tax history
-7.4%/yrLatest (2025): $619 · -76.3% YoY. Source: county tax records.
Cash-flow waterfall
monthlySold comps — $/sqft
last 12 mo · ≤1 miLoading sold comps…