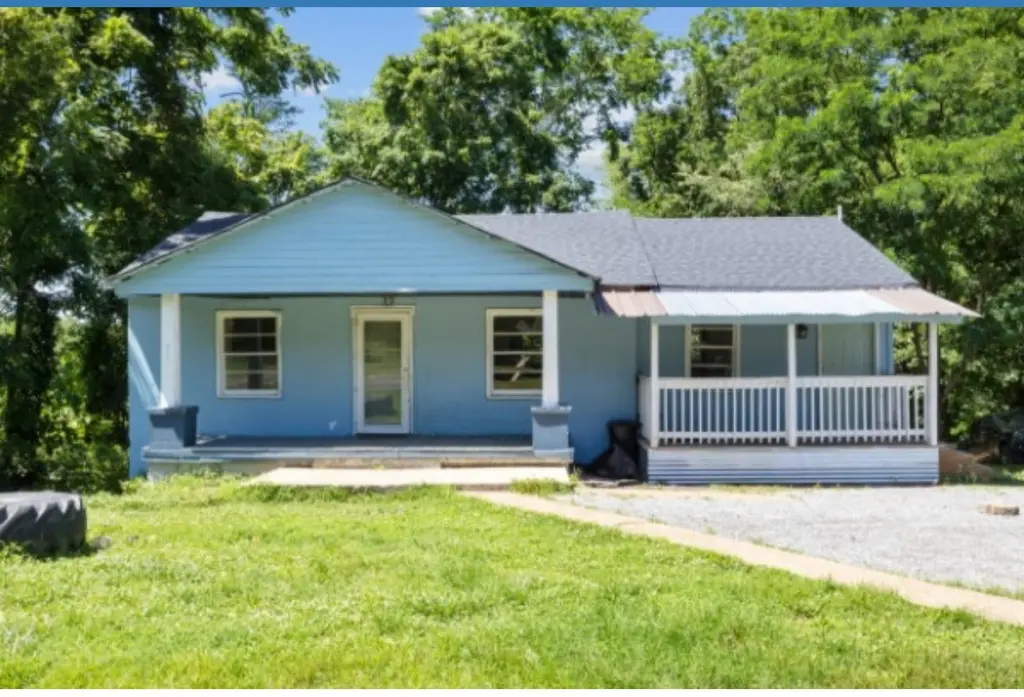
559 Palmyra Rd · Clarksville, TN
Flood risk 1/10 · Minimal
- FEMA flood zone
- X (unshaded)
- Chance of flooding over 30 yrs
- 0.0%
- Est. flood insurance / yr
- $473 – $860
Fire risk 4/10 · Minor
- Est. fire insurance / yr
- $949 – $1,763
Heat risk 5/10 · Moderate
- Hot days now (above 108°F)
- 7 days/yr
- Hot days in 30 yrs
- 20 days/yr
Wind risk 4/10 · Minor
- Chance of severe wind over 30 yrs
- 9.0%
Air-quality risk 1/10 · Minimal
- Unhealthy air days now
- 0 days/yr
- Unhealthy air days in 30 yrs
- 0 days/yr
Risk factors via First Street. Map © Google.
Why this score? — see what drove the B grade
The composite is a weighted blend of 9 inputs, each scored 0–100. Each bar is that input's sub-score; the figure is the points it added to the 100-point composite (weight × sub-score).
- Cash flow +28.5/30.0
- ARV discount +15.0/15.0
- DSCR +10.0/10.0
- 1% rule +6.7/10.0
- Livability +4.2/5.0
- Rent growth +2.8/5.0
- Schools +2.5/10.0
- Condition / age +2.5/5.0
- Appreciation +0.0/10.0
$175,000
🖨 Deal sheet 📄 Offer letter ✓ Due diligence
Listing remarks MLS
This property was being used as a rental and has been cleared out and is ready for the next homeowner or investor to take over! House is a little bigger than 1148 sq ft. There was an addition built by the previous seller on main level of 250-300 sq ft. The unfinished basement can be finished out which would bring this property to a 5/3 and about 1932+ sq ft (not including the addition). All information is deemed accurate to our knowledge, buyer/buyer's agent responsible to verify any important information. Please send all offers to [email protected]. Offers Due by Sunday, June 16th, @ 5pm, Seller will respond by Sunday night. Seller has the right to take an offer beforehand.
Key facts
- 0.36 acre lot
- Built 1947
- Listed 159 days
Property features AI
Finance
- Financial info: $736 annual tax amount
Exterior
- Parking: No covered spaces listed; No total parking spaces listed
- Utilities: Public water; Septic tank; Water available
- Home design: Single-family residence; One story
- Construction: Wood siding
- Exterior features: Lot approximately 0.36 acres
Interior
- Kitchen: Electric oven; Electric range
- Bedrooms: 4 bedrooms (all on the main level)
- Flooring: Laminate flooring; Vinyl flooring
- Bathrooms: 2 full bathrooms
- Heating & cooling: Central heating; Central air conditioning
- Interior features: Unfinished basement; Electric oven; Electric range
Neighborhood map
What this means for you Summary
Snapshot
- This is a 4-bed/1.0-bath single-family listed at $175k.
Deal economics
- At list price, monthly cash flow is $571 ($7k/yr) — positive.
- The deal already cash-flows at list — no discount required.
- Meets the 1% rule at list price ($2k rent vs $175k).
- Recommended offer: $154k (12.0% below list) — sets the bar for market timing.
- Cap rate 10.2% vs local median 3.5% in Clarksville — top-decile yield for the area; either an underpriced asset or a hidden risk that comps aren't pricing in. Stress-test before assuming the spread holds.
Location & tenants
- Location reads 84/100 on livability (#1 in TN, #798 nationally) — a professional / high-income tenant draw. Strengths: amenities A+, commute A+, cost of living A+; Watch: employment C-, crime D+.
- Montgomery County (urban): math 25% / reading 31% proficiency, ranked #65 of 139 in TN (top 47%) — low school quality limits family demand, transient renter base, plan for 1-2y turnover.
- Zoned schools: Cumberland Heights Elementary (math 45% / reading 34%, grade F, #231 of 952 statewide, top 26%, 592 students, 0% FRL); Montgomery Central High (math 6% / reading 40%, grade F, #149 of 332 statewide, top 46%, 1,056 students, 0% FRL) — zoned schools average 0% FRL vs 40% district-wide (40 pts lower); this property's tenant base skews higher-income than the district average.
- Market conditions: Rents rising (+1.3%/yr); 604 active listings in the ZIP; 2 comparable units currently listed for rent nearby; 2,583 units permitted in Montgomery County in 2024 (617 in 5+ unit buildings).
Forward outlook
- Local home prices are declining (-3.0%/yr); year-one equity from $1k of loan paydown is wiped out by about $5k of value loss. Plan a longer hold.
- Montgomery County population projected at +49% by 2050 — long-run rental-demand tailwind backs the buy-and-hold thesis.
- At projected returns (-3.0% appreciation + 1.3% rent growth), your $49k cash investment doubles in ~10 years — after that, you're playing with house money.
Negotiation context
- It's been on market 159 days — a 12% lower offer ($154k) is reasonable based on typical stale-listing flexibility.
- 2 sale attempts since 2y ago with the ask held roughly flat each time — persistent listings suggest the price (not the market) is what's stuck; bring a comps-based counter.
- Current owner paid $150k; 17% above their basis — modest negotiation headroom, anchor on the comps not their cost.
Risks & watch-outs
- Watch-outs: built in 1947 — expect roof / HVAC / electrical / plumbing capex.
- Climate carrying-cost: extreme-heat days projected 7→20/yr by 2055 (HVAC capex compounding) — expect insurance premiums to compound above CPI over the hold.
Questions for the listing agent
- It's been on market 159 days. Have you received any prior offers? Is the seller open to a 12% concession, seller financing, or rate buy-down credit?
- Built in 1947 — when were the roof, HVAC, electrical panel, plumbing, and water heater last replaced?
- Why hasn't it sold? Are there any deal-killer items the seller is aware of (foundation, flood, title, zoning, code violations)?
- Is there a deadline driving the sale (1031 exchange, divorce, estate, relocation)? That informs how much negotiation room exists.
- Crime grade is D in this area — have there been break-ins, vandalism, or insurance claims at this property in the last 3 years? What carrier currently insures it and at what premium?
- What's the average days-on-market for RENTAL listings here right now (not sales)? A rising rental-DOM trend means longer vacancies and softer asking-rent achievability than the comps imply.
- What's the recent tenant-quality profile in this submarket — average credit score on applications, eviction rate, late-payment / NSF rate, and stable-employment percentage? A property-management company in the area should have these aggregated.
- How much new for-sale + rental construction is in the pipeline within 1–3 miles? Heavy new supply typically softens prices + rents 12–24 months out; constrained supply supports both.
Investment metrics
- 1% rule
- 1.17% ✓
- Cap rate
- 10.21%
- Cash-on-cash
- 13.99%
- DSCR
- 1.62
- GRM
- 7.1
CMA / ARV
- ARV (on-the-fly)
- $253,708
- Comps found
- 11
Show comp detail 11 sales within ~0.75 mi
| Address | Dist | Beds/Ba | Sqft | Sold | Price | $/sf | Match |
|---|---|---|---|---|---|---|---|
| 1916 River Rd | 0.38mi | 3/2.0 (-1) | 1,156 (+1%) | 6mo | $310,000 | $268 | 67 |
| 575 Palmyra Rd | 0.11mi | 3/1.0 (-1) | 1,056 (-8%) | 22mo | $214,900 | $204 | 58 |
| 2016 River Rd | 0.35mi | 3/2.0 (-1) | 1,260 (+10%) | 5mo | $257,000 | $204 | 54 |
| 2092 Hilltop View Rd | 0.25mi | 3/1.0 (-1) | 1,285 (+12%) | 20mo | $211,000 | $164 | 47 |
| 229 Wayne Hall Rd | 0.47mi | 3/2.0 (-1) | 1,214 (+6%) | 16mo | $279,000 | $230 | 46 |
| 213 Wayne Hall Rd | 0.46mi | 3/2.0 (-1) | 1,214 (+6%) | 18mo | $282,000 | $232 | 45 |
| 237 Wayne Hall Rd | 0.48mi | 3/2.0 (-1) | 1,214 (+6%) | 20mo | $295,000 | $243 | 42 |
| 2032 Dinsmore Rd | 0.68mi | 3/2.0 (-1) | 1,092 (-5%) | 18mo | $260,000 | $238 | 37 |
| 1756 Cumberland Heights Rd | 0.74mi | 3/2.0 (-1) | 1,040 (-9%) | 5mo | $220,000 | $212 | 36 |
| 230 Wayne Hall Rd | 0.44mi | 3/2.0 (-1) | 1,319 (+15%) | 16mo | $292,000 | $221 | 32 |
| 218 Wayne Hall Rd | 0.43mi | 3/2.0 (-1) | 1,319 (+15%) | 23mo | $280,000 | $212 | 27 |
Match score weights: distance 35% · size 25% · config 20% · recency 20%. Top-matched comps best support the ARV.
Projected returns pro-forma
-3.0% appreciation · 1.32% rent growth · sell at horizon
- IRR
- 2.5%
- Equity multiple
- 1.09×
- Total profit
- $4,539
- Equity at exit
- $26,093
- IRR
- 10.5%
- Equity multiple
- 1.75×
- Total profit
- $36,977
- Equity at exit
- $15,131
Cash invested: $49,000 (down + closing). Projections, not guarantees.
Landlord ↔ Tenant lean methodology
- Overall (STATE)
- 87 Strongly Landlord-Friendly
- State Tennessee
- 87 Strongly Landlord-Friendly · R+13
- County
- — inherits STATE
- City
- — inherits STATE
ZIP-level market 37040
- Home prices YoY
- -22.0%
- Rents YoY
- 1.3%
- Active inventory
- 604
- Price-to-rent
- 7.1×
Monthly cashflow live
- Estimated rent
- $2,055 medium interval (Pro) →
- Mortgage (P&I)
- −$918
- Tax from tax record
- −$61 /mo · $736/yr
- Insurance
- −$73
- HOA
- −$0
- Vacancy / Maint / Mgmt
- −$431
- Net cashflow
- $571
Break-even live
UW: 25.0% down · 7.5% · 30yr · 1.5% tax · 5.0% vac · 8.0% maint · 8.0% mgmt
Financing live
Cash to close
- Down payment
- $43,750
- Closing costs
- $5,250
- Reserves months
- —
- Total cash needed
- —
Loan-product check · same deal, 3 products live
Conventional
25% down · 7.5% · 30yr
- Down + closing
- —
- Monthly P&I
- —
- Monthly cashflow
- —
- DSCR
- —
- Eligible?
- —
Personal DTI + credit; lowest rate.
DSCR
20% down · 8.5% · 30yr
- Down + closing
- —
- Monthly P&I
- —
- Monthly cashflow
- —
- DSCR
- —
- Eligible?
- —
No personal income docs; deal must DSCR.
Hard money
10% down · 12.0% · 12mo
- Down + closing
- —
- Monthly P&I
- —
- Monthly cashflow
- —
- DSCR
- —
- Eligible?
- —
Short-term bridge; refi at stabilization.
Rent comps 2 comps
| Address | Beds | Baths | Sqft | Rent | $/sqft | DOM | Units | Dist |
|---|---|---|---|---|---|---|---|---|
| 474 Indian Overlook Clarksville, TN | 3.0 | 2.5 | 1443 | $2,000 | $1.39 | 21d | 1 | 1.44mi |
| 133 Tomahawk Pt Clarksville, TN | 4.0 | 2.5 | 1370 | $2,095 | $1.53 | 21d | 1 | 1.50mi |
Listing history 24 events
-
2026-06-18days on market $175,000 Active 159 DOM
-
2026-06-17days on market $175,000 Active 158 DOM
-
2026-06-16days on market $175,000 Active 157 DOM
-
2026-06-15days on market $175,000 Active 156 DOM
-
2026-06-14days on market $175,000 Active 154 DOM
-
2026-06-13days on market $175,000 Active 153 DOM
-
2026-06-10days on market $175,000 Active 151 DOM
-
2026-06-09days on market $175,000 Active 150 DOM
-
2026-06-08days on market $175,000 Active 149 DOM
-
2026-06-07days on market $175,000 Active 148 DOM
-
2026-06-05days on market $175,000 Active 145 DOM
-
2026-06-03days on market $175,000 Active 144 DOM
-
2026-06-02days on market $175,000 Active 143 DOM
-
2026-05-31days on market $175,000 Active 141 DOM
-
2026-05-30days on market $175,000 Active 140 DOM
-
2026-01-10$175,000 Active
-
2026-01-08historical $175,000
-
2024-06-24soldstatus $150,000
-
2024-06-21soldstatus $150,000 Closed 696-char remark
Show marketing remark (696 chars)
This property was being used as a rental and has been cleared out and is ready for the next homeowner or investor to take over! House is a little bigger than 1148 sq ft. There was an addition built by the previous seller on main level of 250-300 sq ft. The unfinished basement can be finished out which would bring this property to a 5/3 and about 1932+ sq ft (not including the addition). All information is deemed accurate to our knowledge, buyer/buyer's agent responsible to verify any important information. Please send all offers to [email protected]. Offers Due by Sunday, June 16th, @ 5pm, Seller will respond by Sunday night. Seller has the right to take an offer beforehand.
-
2024-06-16status Pending 696-char remark
Show marketing remark (696 chars)
This property was being used as a rental and has been cleared out and is ready for the next homeowner or investor to take over! House is a little bigger than 1148 sq ft. There was an addition built by the previous seller on main level of 250-300 sq ft. The unfinished basement can be finished out which would bring this property to a 5/3 and about 1932+ sq ft (not including the addition). All information is deemed accurate to our knowledge, buyer/buyer's agent responsible to verify any important information. Please send all offers to [email protected]. Offers Due by Sunday, June 16th, @ 5pm, Seller will respond by Sunday night. Seller has the right to take an offer beforehand.
-
2024-06-12$150,000 Active 696-char remark
Show marketing remark (696 chars)
This property was being used as a rental and has been cleared out and is ready for the next homeowner or investor to take over! House is a little bigger than 1148 sq ft. There was an addition built by the previous seller on main level of 250-300 sq ft. The unfinished basement can be finished out which would bring this property to a 5/3 and about 1932+ sq ft (not including the addition). All information is deemed accurate to our knowledge, buyer/buyer's agent responsible to verify any important information. Please send all offers to [email protected]. Offers Due by Sunday, June 16th, @ 5pm, Seller will respond by Sunday night. Seller has the right to take an offer beforehand.
-
2024-06-11historical $150,000 696-char remark
Show marketing remark (696 chars)
This property was being used as a rental and has been cleared out and is ready for the next homeowner or investor to take over! House is a little bigger than 1148 sq ft. There was an addition built by the previous seller on main level of 250-300 sq ft. The unfinished basement can be finished out which would bring this property to a 5/3 and about 1932+ sq ft (not including the addition). All information is deemed accurate to our knowledge, buyer/buyer's agent responsible to verify any important information. Please send all offers to [email protected]. Offers Due by Sunday, June 16th, @ 5pm, Seller will respond by Sunday night. Seller has the right to take an offer beforehand.
-
2022-10-18soldstatus $50,000
-
2001-08-08soldstatus $20,000
ⓘ Source: listings_history table (triggers on properties + properties_extension) + one-shot
backfill from property_details.listing_events for pre-trigger history.
Tax reassessment forecast TN · Resets to sale price
- Current annual tax
- $736 · $61/mo
- Projected year-2 tax
- $1,242 · $104/mo
- Expected delta
- +$506/yr (+$42/mo · 68.8%)
ⓘ Screening estimate from a state-policy table — verify with the county assessor before closing.
Climate risk First Street
- Flood 1/10 Low FEMA zone X (unshaded) · 0% chance over 30 yrs
- Wildfire 4/10 Moderate
- Heat 5/10 Major 7 d/yr ≥108°F today · 20 d/yr by 30 yrs out
- Wind 4/10 Moderate 9% chance of damaging wind over 30 yrs
- Air quality 1/10 Low 0 unhealthy d/yr today · 0 by 30 yrs out
Nearby sold comps map
Loading sold comps map…
Walkable amenities ~0.75 mi
Loading nearby amenities…
Taxation est. · year 1
- Rental income
- $24,655
- − Mortgage interest
- −$9,803
- − Property taxes
- −$736
- − Insurance
- −$875
- − Repairs & maintenance
- −$1,972
- − Management
- −$1,972
- − Depreciation
- −$5,091
- Taxable income
- $4,206
- Est. tax owed @ 24.0%
- −$1,009
- After-tax cash flow
- $5,845/yr
For passive investors: Depreciation is non-cash, so a rental often shows a tax loss while cash-flowing — sheltering income. Rental losses are passive: they offset passive income freely, and up to $25,000/yr can offset ordinary (W-2) income if you actively participate and your MAGI is under $100k (phasing out to $0 by $150k); unused losses carry forward. On sale, claimed depreciation is recaptured at up to 25%, and gains may owe capital-gains tax (a 1031 exchange can defer both). Figures are a year-1 estimate at your 24.0% rate — not tax advice; consult a CPA.
Schools (NCES district)
- District
- Montgomery County
- NCES district ID
- 4703030
- Math proficiency
- 25% ▼ -20.00%
- Reading proficiency
- 31% ▼ -10.00%
- Median HH income
- $50,423
- Composite
- 24.56/100
- National rank
- #7641
- State rank
- #65 of 139 in TN
Livability — Clarksville
- Score
- 84/100
- State rank
- #1
- US rank
- #798
Category grades
Schools grade is shown separately in the Schools card above.
Census & demographics
- County
- Montgomery County · 211,371 people
- City population
- 211,371
- Metro
- Clarksville, TN-KY
- Population (ZIP)
- 64,977
- Household income
- $67,745
- Rent vs Own
- Severe rent burden
- 2670.0
Population outlook (Montgomery County) Hauer SSP2
- Today (2025)
- 236,633 people
- By 2030
- 258,978 · +9.4%
- By 2040
- 305,456 · +29.1%
- By 2050
- 353,147 · +49.2%
- By 2075
- 471,289 · +99.2%
- By 2100
- 564,122 · +138.4%
Race, ethnicity, and origin ACS 2023
- Neighborhood character
- Diverse neighborhood (Simpson 0.61)
- Race & ethnicity
- White 56% Black 25% Two or more races 11% Hispanic / Latino 10% Asian 2%
- Hispanic origin (detail)
- Mexican 6% Puerto Rican 2%
- Common ancestry
- Italian 4% Lithuanian 1% Slovak 1%
- Foreign-born
- 6% · Canada, South Korea
- Languages at home
- 90% English-only · Spanish 5% Other Asian/Pacific 1% Other Indo-European 1%
Political lean MEDSL · Montgomery
- 2024 margin
- R (+18.4) · D 40.0% · R 58.5% · Other 1.5%
- 2008→2024 swing
- -10.5pp toward R · 2008: -7.9pp · 2024: -18.4pp
- All cycles
- 2024: R+18.4 2020: R+12.7 2016: R+18.6 2012: R+10.5 2008: R+7.9
Not yet ingested
- Civics
- —
Market trends
- HPI YoY
- ▼ -75.79%
- Current HPI
- 269.0601
- Rent YoY
- ▲ 1.32%
- Metro
- Clarksville, TN-KY
- State GDP YoY
- ▲ 2.78%
- F500 in state
- 22
Industry mix (Fortune 500 HQ in TN)
| Industry | F500 HQs | Revenue |
|---|---|---|
| Healthcare | 3 | $91B |
|
||
| Retail | 3 | $72B |
|
||
| Transportation / Logistics | 1 | $88B |
|
||
| Paper / Packaging | 1 | $19B |
|
||
| Insurance | 1 | $13B |
|
||
| Energy | 1 | $12B |
|
||
Price history
+775.0% since first listed9 events — show timeline
- 2026-01-10 Listed $175,000 REALTRACS as Distributed by MLS Grid
- 2026-01-08 Coming Soon $175,000 REALTRACS as Distributed by MLS Grid
- 2024-06-24 Sold (Public Records) $150,000 Public Records
- 2024-06-21 Sold (MLS) $150,000 REALTRACS as Distributed by MLS Grid
- 2024-06-16 Pending — REALTRACS as Distributed by MLS Grid
- 2024-06-12 Listed $150,000 REALTRACS as Distributed by MLS Grid
- 2024-06-11 Coming Soon $150,000 REALTRACS as Distributed by MLS Grid
- 2022-10-18 Sold (Public Records) $50,000 Public Records
- 2001-08-08 Sold (Public Records) $20,000 Public Records
Property tax history
+3.7%/yrLatest (2025): $736 · +0.0% YoY. Source: county tax records.
Cash-flow waterfall
monthlySold comps — $/sqft
last 12 mo · ≤1 miLoading sold comps…