 🏗️ New Construction
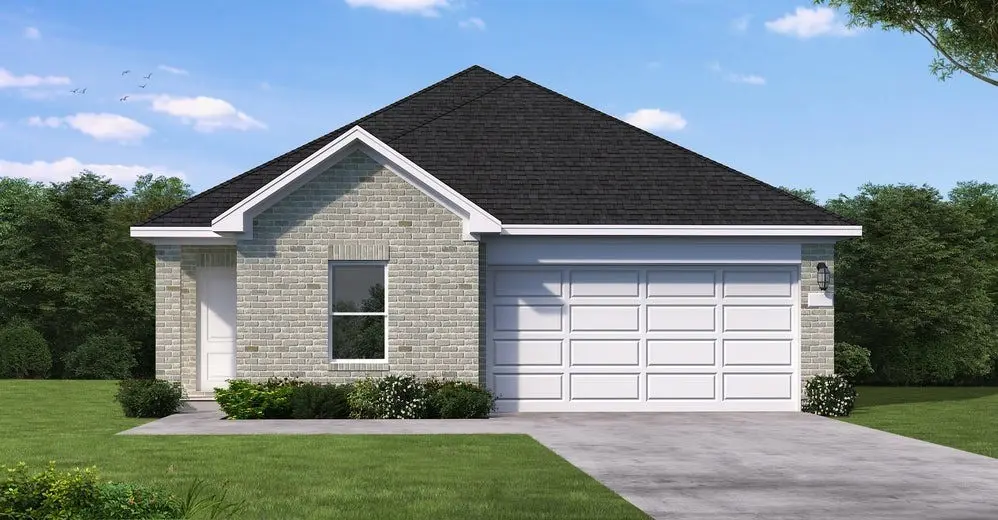
2123 Starlight St · Cove, TX
Flood risk 1/10 · Minimal
- FEMA flood zone
- X (unshaded)
- Chance of flooding over 30 yrs
- 0.0%
- Est. flood insurance / yr
- $507 – $1,088
Fire risk 4/10 · Minor
- Est. fire insurance / yr
- $1,222 – $2,270
Heat risk 10/10 · Severe
- Hot days now (above 112°F)
- 7 days/yr
- Hot days in 30 yrs
- 26 days/yr
Wind risk 10/10 · Severe
- Chance of severe wind over 30 yrs
- 99.0%
Air-quality risk 2/10 · Minimal
- Unhealthy air days now
- 1 days/yr
- Unhealthy air days in 30 yrs
- 1 days/yr
Risk factors via First Street. Map © Google.
Why this score? — see what drove the C- grade
The composite is a weighted blend of 9 inputs, each scored 0–100. Each bar is that input's sub-score; the figure is the points it added to the 100-point composite (weight × sub-score).
- Cash flow +16.4/30.0
- ARV discount +7.5/15.0
- Schools +6.2/10.0
- DSCR +5.1/10.0
- 1% rule +4.8/10.0
- Condition / age +4.0/5.0
- Rent growth +3.4/5.0
- Livability +3.2/5.0
- Appreciation +0.0/10.0
$304,267
🖨 Deal sheet 📄 Offer letter ✓ Due diligence
Listing remarks
Welcome to this beautifully finished Ellis home in Windrose Green, offering 4 bedrooms, 3 baths, and 1,915 square feet of thoughtfully designed living. The open-concept layout connects the kitchen, dining, and family room, creating a bright space filled with natural light—perfect for everyday living and entertaining. Enjoy quartz countertops, rich, painted cabinetry, a stainless steel undermount sink, and warm Caraway Chestnut RevWood flooring throughout the main areas. A versatile flex room is ideal for a home office or playroom, while the primary suite features a relaxing bath with separate tub and shower. Located near lakes, trails, and a splash pad with easy access to Hwy 288&mdas
Key facts
- Quartz countertops
- Primary suite
- Painted cabinetry
Tags
Property features AI
Finance
- HOA & community: Community managed by Inframark Community Management; Community amenities include playground, pickleball, pool, and trails; Association fee $900 annually
Exterior
- Parking: Attached garage; 2 garage spaces
- Security: Prewired for security; Security system owned; Smoke detectors
- Utilities: Public water; Public sewer
- Home design: Residential property; New construction (under construction); Faces south; Single-story entry (all main rooms on first floor)
- Construction: Built in 2026; Brick construction; Composition roof; Slab foundation; Built by Coventry Homes
- Exterior features: Deck; Patio; Private yard; Sprinkler/irrigation system; Subdivision lot
Interior
- Kitchen: Dishwasher; Electric oven; Gas cooktop; Microwave; Garbage disposal
- Bedrooms: Primary bedroom on the first floor (13 x 14); Bedroom on the first floor (10 x 13); Bedroom on the first floor (10 x 12); Bedroom on the first floor (10 x 10)
- Flooring: Carpet; Plank; Vinyl
- Bathrooms: 3 full bathrooms
- Heating & cooling: Central heating (gas); Central electric air conditioning
- Interior features: Breakfast bar; Kitchen island; Kitchen/family room combo; Pantry; Soaking tub; Separate shower; Tub/shower combo; Ceiling fans; Programmable thermostat; Low emissivity windows; Ventilation for improved indoor air quality; ENERGY STAR qualified appliances
- Laundry & utility: Washer hookup; Electric dryer hookup; Gas dryer hookup
Neighborhood map
What this means for you Summary
Snapshot
- This is a 4-bed/3.0-bath single-family listed at $304k. Condition is rated good.
Deal economics
- At list price, monthly cash flow is $175 ($2k/yr) — positive.
- The deal already cash-flows at list — no discount required.
- To meet the 1% rule (rent ≥ 1% of price), the offer needs to be $298k (2.1% below list).
- Recommended offer: $298k (2.1% below list) — sets the bar for 1% rule.
- Cap rate 7.0% vs local median 5.3% in Cove — top-decile yield for the area; either an underpriced asset or a hidden risk that comps aren't pricing in. Stress-test before assuming the spread holds.
Location & tenants
- Location reads 64/100 on livability (#766 in TX) — a middle-class / working-renter tenant base. Strengths: employment A+, housing A+, crime A; Watch: amenities F, commute F, health & safety F.
- Barbers Hill ISD (rural): math 72% / reading 65% proficiency, ranked #12 of 826 in TX (top 2%) — acceptable for families but not a draw, mixed tenant base, ~2y average lease.
- Zoned schools: Barbers Hill El South (math 68% / reading 62%, grade B+, #246 of 4,322 statewide, top 6%, 883 students, 37% FRL); Barbers Hill Middle South (math 77% / reading 63%, grade A, #58 of 1,662 statewide, top 4%, 636 students, 0% FRL); Barbers Hill H S (math 70% / reading 74%, grade B+, #95 of 1,632 statewide, top 7%, 1,972 students, 0% FRL) — zoned schools average 12% FRL vs 28% district-wide (16 pts lower); this property's tenant base skews higher-income than the district average.
- Market conditions: Rents rising (+3.4%/yr); 776 active listings in the ZIP; 2 comparable units currently listed for rent nearby; high-income renter base; 629 units permitted in Chambers County in 2024 (0 in 5+ unit buildings).
Forward outlook
- Local home prices are declining (-3.0%/yr); year-one equity from $2k of loan paydown is wiped out by about $9k of value loss. Plan a longer hold.
- Chambers County population projected at +46% by 2050 — long-run rental-demand tailwind backs the buy-and-hold thesis.
Negotiation context
- It's been on market 24 days — a 2% lower offer ($300k) is reasonable based on typical stale-listing flexibility.
Risks & watch-outs
- Climate carrying-cost: severe wind risk, 99% chance of damaging wind over 30y; extreme-heat days projected 7→26/yr by 2055 (HVAC capex compounding) — expect insurance premiums to compound above CPI over the hold.
Questions for the listing agent
- What does the HOA fee cover, when was the last increase, and are there any pending special assessments or reserve-fund shortfalls?
- Is there a deadline driving the sale (1031 exchange, divorce, estate, relocation)? That informs how much negotiation room exists.
- Schools are D-rated, which usually means shorter tenancies and higher turnover. Who's the typical renter profile here, and what's been the actual vacancy rate?
- What's the average days-on-market for RENTAL listings here right now (not sales)? A rising rental-DOM trend means longer vacancies and softer asking-rent achievability than the comps imply.
- What's the recent tenant-quality profile in this submarket — average credit score on applications, eviction rate, late-payment / NSF rate, and stable-employment percentage? A property-management company in the area should have these aggregated.
- How much new for-sale + rental construction is in the pipeline within 1–3 miles? Heavy new supply typically softens prices + rents 12–24 months out; constrained supply supports both.
Investment metrics
- 1% rule
- 0.98% ✗
- Cap rate
- 6.98%
- Cash-on-cash
- 2.47%
- DSCR
- 1.11
- GRM
- 8.5
CMA / ARV
No comps found within radius.
Projected returns pro-forma
-3.0% appreciation · 3.42% rent growth · sell at horizon
- IRR
- -11.9%
- Equity multiple
- 0.57×
- Total profit
- $-36,778
- Equity at exit
- $45,367
- IRR
- -2.0%
- Equity multiple
- 0.86×
- Total profit
- $-12,039
- Equity at exit
- $26,307
Cash invested: $85,195 (down + closing). Projections, not guarantees.
Landlord ↔ Tenant lean methodology
- Overall (STATE)
- 87 Strongly Landlord-Friendly
- State Texas
- 87 Strongly Landlord-Friendly · R+5
- County
- — inherits STATE
- City
- — inherits STATE
ZIP-level market 77523
- Home prices YoY
- -31.5%
- Rents YoY
- 3.4%
- Active inventory
- 776
- Price-to-rent
- 8.5×
Monthly cashflow live
- Estimated rent
- $2,979 medium interval (Pro) →
- Mortgage (P&I)
- −$1,596
- Tax est. 1.5%
- −$380 /mo · $4,564/yr
- Insurance
- −$127
- HOA
- −$75
- Vacancy / Maint / Mgmt
- −$626
- Net cashflow
- $175
Break-even live
UW: 25.0% down · 7.5% · 30yr · 1.5% tax · 5.0% vac · 8.0% maint · 8.0% mgmt
Financing live
Cash to close
- Down payment
- $76,067
- Closing costs
- $9,128
- Reserves months
- —
- Total cash needed
- —
Loan-product check · same deal, 3 products live
Conventional
25% down · 7.5% · 30yr
- Down + closing
- —
- Monthly P&I
- —
- Monthly cashflow
- —
- DSCR
- —
- Eligible?
- —
Personal DTI + credit; lowest rate.
DSCR
20% down · 8.5% · 30yr
- Down + closing
- —
- Monthly P&I
- —
- Monthly cashflow
- —
- DSCR
- —
- Eligible?
- —
No personal income docs; deal must DSCR.
Hard money
10% down · 12.0% · 12mo
- Down + closing
- —
- Monthly P&I
- —
- Monthly cashflow
- —
- DSCR
- —
- Eligible?
- —
Short-term bridge; refi at stabilization.
Rent comps 2 comps
| Address | Beds | Baths | Sqft | Rent | $/sqft | DOM | Units | Dist |
|---|---|---|---|---|---|---|---|---|
| 14930 Spring Forest Ln Baytown, TX | 4.0 | 2.0 | 1829 | $2,750 | $1.50 | 43d | 1 | 1.09mi |
| 14739 Sweet Water Dr Baytown, TX | 4.0 | 2.0 | 1821 | $2,395 | $1.32 | 1d | 1 | 1.34mi |
HOA detail
- Monthly dues
- $75 · $900/yr
Listing history 14 events
-
2026-06-18days on market $304,267 Active 24 DOM
-
2026-06-17days on market $304,267 Active 23 DOM
-
2026-06-16days on market $304,267 Active 22 DOM
-
2026-06-15days on market $304,267 Active 21 DOM
-
2026-06-13days on market $304,267 Active 19 DOM
-
2026-06-09days on market $304,267 Active 15 DOM
-
2026-06-08days on market $304,267 Active 14 DOM
-
2026-06-07days on market $304,267 Active 13 DOM
-
2026-06-04days on market $304,267 Active 10 DOM
-
2026-06-03days on market $304,267 Active 9 DOM
-
2026-06-02days on market $304,267 Active 8 DOM
-
2026-06-01days on market $304,267 Active 7 DOM
-
2026-05-31days on market $304,267 Active 6 DOM
-
2026-05-25$304,267 Active
ⓘ Source: listings_history table (triggers on properties + properties_extension) + one-shot
backfill from property_details.listing_events for pre-trigger history.
Climate risk First Street
- Flood 1/10 Low FEMA zone X (unshaded) · 0% chance over 30 yrs
- Wildfire 4/10 Moderate
- Heat 10/10 Extreme 7 d/yr ≥112°F today · 26 d/yr by 30 yrs out
- Wind 10/10 Extreme 99% chance of damaging wind over 30 yrs
- Air quality 2/10 Low 1 unhealthy d/yr today · 1 by 30 yrs out
Nearby sold comps map
Loading sold comps map…
Walkable amenities ~0.75 mi
Loading nearby amenities…
Taxation est. · year 1
- Rental income
- $35,744
- − Mortgage interest
- −$17,044
- − Property taxes
- −$4,564
- − Insurance
- −$1,521
- − Repairs & maintenance
- −$2,859
- − Management
- −$2,859
- − HOA
- −$900
- − Depreciation
- −$8,851
- Taxable loss
- −$2,856
- Est. tax savings @ 24.0%
- +$685
- After-tax cash flow
- $2,790/yr
For passive investors: Depreciation is non-cash, so a rental often shows a tax loss while cash-flowing — sheltering income. Rental losses are passive: they offset passive income freely, and up to $25,000/yr can offset ordinary (W-2) income if you actively participate and your MAGI is under $100k (phasing out to $0 by $150k); unused losses carry forward. On sale, claimed depreciation is recaptured at up to 25%, and gains may owe capital-gains tax (a 1031 exchange can defer both). Figures are a year-1 estimate at your 24.0% rate — not tax advice; consult a CPA.
Condition & rehab AI · 7 photos
This single-family home in Windrose Green is in good condition with a good condition score of 80. It offers 4 bedrooms, 3 baths, and 1,915 square feet of living space. The home is move-in ready with no visible repairs or maintenance needed. The highest-ROI updates would be painting the exterior siding and landscaping improvements to enhance curb appeal and value, as well as updating the kitchen backsplash and bathroom vanity to improve aesthetics and functionality.
Value-add opportunities
- Both Painting exterior siding — Enhances curb appeal and value.
- Both Landscaping improvements — Enhances curb appeal and value.
- Resale Kitchen backsplash — Improves kitchen aesthetics and functionality.
- Resale Bathroom vanity — Improves bathroom aesthetics and functionality.
Renovation cost estimate screening
Value-add ROI direction
- Both Painting exterior siding — Enhances curb appeal and value. ↑
- Both Landscaping improvements — Enhances curb appeal and value. ↑
- Resale Kitchen backsplash — Improves kitchen aesthetics and functionality. ↑
- Resale Bathroom vanity — Improves bathroom aesthetics and functionality. ↑
ⓘ Cost ranges are severity-bucket heuristics (US national rule-of-thumb). Get contractor quotes + a written scope before underwriting a rehab budget.
Schools (NCES district)
- District
- Barbers Hill ISD
- NCES district ID
- 4809450
- Math proficiency
- 72% ▼ -5.00%
- Reading proficiency
- 65% ▼ -1.00%
- Median HH income
- $87,257
- Composite
- 61.73/100
- National rank
- #737
- State rank
- #12 of 826 in TX
Livability — Cove
- Score
- 64/100
- State rank
- #766
- US rank
- #13996
Category grades
Schools grade is shown separately in the Schools card above.
Census & demographics
- Census place
- Cove, TX
- County
- Chambers County · 30,186 people
- Metro
- Houston-The Woodlands-Sugar Land, TX
- Population (ZIP)
- 30,186
- Household income
- $124,188
- Rent vs Own
- Severe rent burden
- 549.0
Population outlook (Chambers County) Hauer SSP2
- Today (2025)
- 46,946 people
- By 2030
- 51,094 · +8.8%
- By 2040
- 59,578 · +26.9%
- By 2050
- 68,318 · +45.5%
- By 2075
- 90,485 · +92.7%
- By 2100
- 104,885 · +123.4%
Race, ethnicity, and origin ACS 2023
- Neighborhood character
- Majority White (62%)
- Race & ethnicity
- White 62% Hispanic / Latino 25% Two or more races 11% Black 8% Asian 2%
- Hispanic origin (detail)
- Mexican 22%
- Common ancestry
- Lithuanian 1% Slovak 1% Serbian 1%
- Foreign-born
- 9% · Canada
- Languages at home
- 82% English-only · Spanish 17%
Political lean MEDSL · Chambers
- 2024 margin
- Solid R (+65.6) · D 16.8% · R 82.4%
- 2008→2024 swing
- -14.4pp toward R · 2008: -51.2pp · 2024: -65.6pp
- All cycles
- 2024: R+65.6 2020: R+61.7 2016: R+62.1 2012: R+61.1 2008: R+51.2
Not yet ingested
- Civics
- —
Market trends
- HPI YoY
- ▼ -102.33%
- Current HPI
- 222.6999
- Rent YoY
- ▲ 3.42%
- Metro
- Houston-The Woodlands-Sugar Land, TX
- State GDP YoY
- ▲ 3.95%
- F500 in state
- 110
Industry mix (Fortune 500 HQ in TX)
| Industry | F500 HQs | Revenue |
|---|---|---|
| Energy | 16 | $1,198B |
|
||
| Technology | 5 | $198B |
|
||
| Engineering / Construction | 4 | $72B |
|
||
| Energy Services | 3 | $60B |
|
||
| Utilities | 3 | $41B |
|
||
| Healthcare | 2 | $330B |
|
||
Price history
1 event — show timeline
- 2026-05-25 Listed $304,267 HARMLS
Cash-flow waterfall
monthlySold comps — $/sqft
last 12 mo · ≤1 miLoading sold comps…