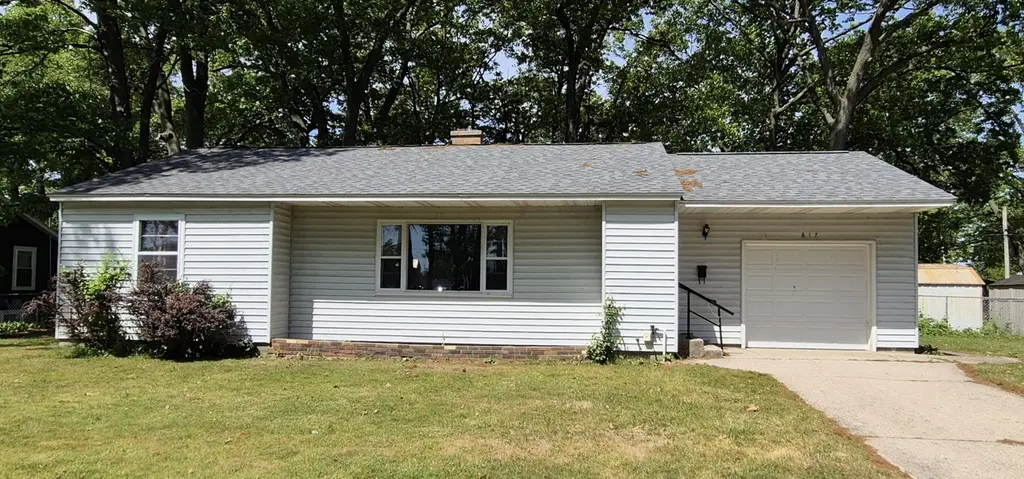
617 Oscar · North Muskegon, MI
Flood risk 1/10 · Minimal
- FEMA flood zone
- X (unshaded)
- Chance of flooding over 30 yrs
- 0.0%
- Est. flood insurance / yr
- $473 – $860
Fire risk 1/10 · Minimal
- Est. fire insurance / yr
- $784 – $1,456
Heat risk 1/10 · Minimal
- Hot days now (above 93°F)
- 7 days/yr
- Hot days in 30 yrs
- 15 days/yr
Wind risk 1/10 · Minimal
- Chance of severe wind over 30 yrs
- —
Air-quality risk 4/10 · Minor
- Unhealthy air days now
- 4 days/yr
- Unhealthy air days in 30 yrs
- 5 days/yr
Risk factors via First Street. Map © Google.
Why this score? — see what drove the D+ grade
The composite is a weighted blend of 9 inputs, each scored 0–100. Each bar is that input's sub-score; the figure is the points it added to the 100-point composite (weight × sub-score).
- Cash flow +12.3/30.0
- Appreciation +10.0/10.0
- Schools +5.2/10.0
- ARV discount +4.5/15.0
- Livability +3.9/5.0
- DSCR +3.6/10.0
- 1% rule +3.0/10.0
- Rent growth +2.5/5.0
- Condition / age +2.5/5.0
$225,000
🖨 Deal sheet (PDF) 📄 Offer letter ✓ Due diligence
Listing remarks MLS
Discover the charm of this classic 3 bedroom ranch home located in a North Muskegon. This home offers character and plenty of space to enjoy on the main level and in the basement. Situated on a large lot, the property provides room for gardening, outdoor entertaining, or simply relaxing in a peaceful setting. New furnace and AC plus roof is less than 10 years old. Immediate possession. It's a wonderful opportunity to enjoy the charm of an older home while making it your own. Conveniently located near Hardings, Brooklyn Bagels, Hometown Pharmacy and the Muskegon bike path.
Key facts
- New furnace
- Outdoor entertaining
- Classic ranch home
Tags
Property features AI
Exterior
- Parking: Attached garage (1 car)
- Utilities: Public water
- Home design: Ranch-style single family residence; Single-story
- Construction: Built in 1950; Vinyl siding; Composition roof; Full basement (finished status not specified)
- Exterior features: Paved road access; Public water
Interior
- Kitchen: Oven; Refrigerator
- Bathrooms: 1 full bathroom; 1 half bathroom
- Heating & cooling: Forced air heating; Has cooling
- Interior features: Garage door opener; 6 total rooms; Full basement
- Laundry & utility: Washer; Dryer
Neighborhood map
What this means for you Summary
Snapshot
- This is a 3-bed/1.5-bath single-family listed at $225k.
Deal economics
- At list price, monthly cash flow is $-41 ($-496/yr) — negative.
- To cash-flow at today's rent, offer at most $218k (3.2% below list).
- To meet the 1% rule (rent ≥ 1% of price), the offer needs to be $180k (20.0% below list).
- Recommended offer: $180k (20.0% below list) — sets the bar for 1% rule.
- Cap rate 6.1% vs local median 4.1% in North Muskegon — top-decile yield for the area; either an underpriced asset or a hidden risk that comps aren't pricing in. Stress-test before assuming the spread holds.
Location & tenants
- Location reads 77/100 on livability (#129 in MI, #3,195 nationally) — a middle-class / working-renter tenant base. Strengths: crime A+, employment A+, cost of living A+; Watch: amenities F, commute F, health & safety F.
- North Muskegon Public Schools (suburban): math 52% / reading 65% proficiency, ranked #84 of 760 in MI (top 11%) — acceptable for families but not a draw, mixed tenant base, ~2y average lease.
- Market conditions: 142 active listings in the ZIP; 1 comparable units currently listed for rent nearby; 438 units permitted in Muskegon County in 2024 (115 in 5+ unit buildings).
Forward outlook
- In year one you build about $24k of equity ($2k loan paydown + $22k appreciation (10.0% local appreciation)).
- Muskegon County population projected to shrink 8% by 2050 — rents likely to lag national; underwrite the cash flow, not the appreciation.
- At projected returns (10.0% appreciation + 3.0% rent growth), your $63k cash investment doubles in ~3 years — after that, you're playing with house money.
- By year 2, paydown + projected appreciation supports a ~$39k cash-out refi (75% LTV) — recoverable capital for the next deal without selling this one.
Negotiation context
- Only 3 days on market — expect competitive offers; lowballing is unlikely to land.
- 3 sale attempts with the ask held roughly flat each time — persistent listings suggest the price (not the market) is what's stuck; bring a comps-based counter.
Risks & watch-outs
- Watch-outs: built in 1950 — expect roof / HVAC / electrical / plumbing capex.
Questions for the listing agent
- What do current leases actually rent for vs. the listed asking? Can we see a recent rent roll and the last 12 months of T-12 income?
- Built in 1950 — when were the roof, HVAC, electrical panel, plumbing, and water heater last replaced?
- Is there a deadline driving the sale (1031 exchange, divorce, estate, relocation)? That informs how much negotiation room exists.
- Schools are A-rated — typically a magnet for longer-tenancy family renters. What's the average tenant stay here, and is there a school-zone premium baked into asking?
- The area grade is low — what's the realistic commute time and amenity access for the typical tenant pool here? Any planned neighborhood developments (good or bad) we should know about?
- What's the average days-on-market for RENTAL listings here right now (not sales)? A rising rental-DOM trend means longer vacancies and softer asking-rent achievability than the comps imply.
- What's the recent tenant-quality profile in this submarket — average credit score on applications, eviction rate, late-payment / NSF rate, and stable-employment percentage? A property-management company in the area should have these aggregated.
- How much new for-sale + rental construction is in the pipeline within 1–3 miles? Heavy new supply typically softens prices + rents 12–24 months out; constrained supply supports both.
Investment metrics
- 1% rule
- 0.80% ✗
- Cap rate
- 6.07%
- Cash-on-cash
- -0.79%
- DSCR
- 0.96
- GRM
- 10.4
CMA / ARV
- ARV (on-the-fly)
- $211,050
- Comps found
- 12
Show comp detail 12 sales within ~0.75 mi
| Address | Dist | Beds/Ba | Sqft | Sold | Price | $/sf | Match |
|---|---|---|---|---|---|---|---|
| 506 Straley St | 0.12mi | 3/1.0 | 955 (-9%) | 2mo | $242,500 | $254 | 75 |
| 2659 Celery Ln | 0.35mi | 3/2.0 | 1,090 (+4%) | 3mo | $226,000 | $207 | 73 |
| 613 Oscar St | 0.02mi | 3/1.0 | 1,140 (+9%) | 14mo | $279,900 | $246 | 71 |
| 418 Straley St | 0.14mi | 3/1.0 | 952 (-9%) | 13mo | $239,900 | $252 | 65 |
| 1846 Mills Ave | 0.62mi | 2/1.0 (-1) | 1,040 (-1%) | 2mo | $125,000 | $120 | 61 |
| 2202 Oak Ave | 0.31mi | 4/1.0 (+1) | 1,117 (+6%) | 22mo | $225,000 | $201 | 50 |
| 1929 Lake Ave | 0.51mi | 2/1.0 (-1) | 1,080 (+3%) | 20mo | $200,000 | $185 | 48 |
| 1838 Moulton Ave | 0.65mi | 2/1.5 (-1) | 1,116 (+6%) | 9mo | $200,000 | $179 | 47 |
| 1837 Mills Ave | 0.64mi | 3/1.0 | 1,024 (-2%) | 21mo | $173,000 | $169 | 46 |
| 1848 Oak Ave | 0.62mi | 2/1.0 (-1) | 930 (-11%) | 15mo | $179,900 | $193 | 33 |
| 2003 Moulton Ave | 0.46mi | 2/2.0 (-1) | 897 (-15%) | 24mo | $171,000 | $191 | 27 |
| 1833 Cedar Ave | 0.66mi | 2/1.0 (-1) | 907 (-14%) | 16mo | $191,000 | $211 | 26 |
Match score weights: distance 35% · size 25% · config 20% · recency 20%. Top-matched comps best support the ARV.
Projected returns pro-forma
10.0% appreciation · 3.0% rent growth · sell at horizon
- IRR
- 23.7%
- Equity multiple
- 2.90×
- Total profit
- $119,879
- Equity at exit
- $202,698
- IRR
- 21.1%
- Equity multiple
- 6.64×
- Total profit
- $355,037
- Equity at exit
- $437,126
Cash invested: $63,000 (down + closing). Projections, not guarantees.
Landlord ↔ Tenant lean methodology
- Overall (STATE)
- 62 Landlord-Friendly
- State Michigan
- 62 Landlord-Friendly · EVEN
- County
- — inherits STATE
- City
- — inherits STATE
ZIP-level market 49445
- Home prices YoY
- 7.2%
- Active inventory
- 142
- Price-to-rent
- 10.4×
Monthly cashflow live
- Estimated rent
- $1,800 medium interval (Pro) →
- Mortgage (P&I)
- −$1,180
- Tax from tax record
- −$190 /mo · $2,276/yr
- Insurance
- −$94
- HOA
- −$0
- Vacancy / Maint / Mgmt
- −$378
- Net cashflow
- $-41
Break-even live
Sensitivity live
| Price | -10% $86 | -5% $22 | +0% $-41 | +5% $-105 | +10% $-169 |
|---|---|---|---|---|---|
| Rent | -10% $-184 | -5% $-112 | +0% $-41 | +5% $30 | +10% $101 |
| Rate | -1.0pp $72 | -0.5pp $16 | base $-41 | +0.5pp $-100 | +1.0pp $-159 |
UW: 25.0% down · 7.5% · 30yr · 1.5% tax · 5.0% vac · 8.0% maint · 8.0% mgmt
Financing live
Cash to close
- Down payment
- $56,250
- Closing costs
- $6,750
- Reserves months
- —
- Total cash needed
- —
Loan-product check · same deal, 3 products live
Conventional
25% down · 7.5% · 30yr
- Down + closing
- —
- Monthly P&I
- —
- Monthly cashflow
- —
- DSCR
- —
- Eligible?
- —
Personal DTI + credit; lowest rate.
DSCR
20% down · 8.5% · 30yr
- Down + closing
- —
- Monthly P&I
- —
- Monthly cashflow
- —
- DSCR
- —
- Eligible?
- —
No personal income docs; deal must DSCR.
Hard money
10% down · 12.0% · 12mo
- Down + closing
- —
- Monthly P&I
- —
- Monthly cashflow
- —
- DSCR
- —
- Eligible?
- —
Short-term bridge; refi at stabilization.
Rent comps 1 comps
| Address | Beds | Baths | Sqft | Rent | $/sqft | DOM | Units | Dist |
|---|---|---|---|---|---|---|---|---|
| 614 E Sunset Dr Muskegon, MI | 2.0 | 2.0 | 1028 | $1,800 | $1.75 | 21d | 1 | 0.86mi |
Listing history 4 events
-
2026-06-05statusdays on market $225,000 Pending 3 DOM
-
2026-06-03days on market $225,000 Active 2 DOM
-
2026-06-02remarks 578-char remark
-
2026-06-02$225,000 Active 1 DOM
ⓘ Source: listings_history table (triggers on properties + properties_extension) + one-shot
backfill from property_details.listing_events for pre-trigger history.
Tax reassessment forecast MI · Partial reset (capped growth)
- Current annual tax
- $2,276 · $190/mo
- Projected year-2 tax
- $2,870 · $239/mo
- Expected delta
- +$595/yr (+$50/mo · 26.1%)
ⓘ Screening estimate from a state-policy table — verify with the county assessor before closing.
Climate risk First Street
- Flood 1/10 Low FEMA zone X (unshaded) · 0% chance over 30 yrs
- Wildfire 1/10 Low
- Heat 1/10 Low 7 d/yr ≥93°F today · 15 d/yr by 30 yrs out
- Wind 1/10 Low
- Air quality 4/10 Moderate 4 unhealthy d/yr today · 5 by 30 yrs out
Nearby sold comps map
Loading sold comps map…
Walkable amenities ~0.75 mi
Loading nearby amenities…
Taxation est. · year 1
- Rental income
- $21,600
- − Mortgage interest
- −$12,603
- − Property taxes
- −$2,276
- − Insurance
- −$1,125
- − Repairs & maintenance
- −$1,728
- − Management
- −$1,728
- − Depreciation
- −$6,545
- Taxable loss
- −$4,406
- Est. tax savings @ 24.0%
- +$1,057
- After-tax cash flow
- $561/yr
For passive investors: Depreciation is non-cash, so a rental often shows a tax loss while cash-flowing — sheltering income. Rental losses are passive: they offset passive income freely, and up to $25,000/yr can offset ordinary (W-2) income if you actively participate and your MAGI is under $100k (phasing out to $0 by $150k); unused losses carry forward. On sale, claimed depreciation is recaptured at up to 25%, and gains may owe capital-gains tax (a 1031 exchange can defer both). Figures are a year-1 estimate at your 24.0% rate — not tax advice; consult a CPA.
Schools (NCES district)
- District
- North Muskegon Public Schools
- NCES district ID
- 2625800
- Math proficiency
- 52% ▲ 8.00%
- Reading proficiency
- 65% ▲ 13.00%
- Median HH income
- $57,539
- Composite
- 52.2/100
- National rank
- #3473
- State rank
- #84 of 760 in MI
Livability — North Muskegon
- Score
- 77/100
- State rank
- #129
- US rank
- #3195
Category grades
Schools grade is shown separately in the Schools card above.
Census & demographics
- Census place
- North Muskegon, MI
- Population (ZIP)
- 21,090
Population outlook (Muskegon County) Hauer SSP2
- Today (2025)
- 174,032 people
- By 2030
- 173,365 · -0.4%
- By 2040
- 168,877 · -3.0%
- By 2050
- 160,306 · -7.9%
- By 2075
- 134,426 · -22.8%
- By 2100
- 98,836 · -43.2%
Race, ethnicity, and origin ACS 2023
- Neighborhood character
- Predominantly White (86%)
- Race & ethnicity
- White 86% Two or more races 8% Hispanic / Latino 6% Black 2%
- Hispanic origin (detail)
- Mexican 5%
- Common ancestry
- Iranian 10% Romanian 4% Italian 3%
- Foreign-born
- 2% · Canada
- Languages at home
- 96% English-only · Spanish 4%
Political lean MEDSL · Muskegon
- 2024 margin
- Toss-up / Even · D 48.4% · R 50.2% · Other 1.5%
- 2008→2024 swing
- -31.1pp toward R · 2008: 29.3pp · 2024: -1.8pp
- All cycles
- 2024: R+1.8 2020: D+0.6 2016: D+0.9 2012: D+17.8 2008: D+29.3
Not yet ingested
- Civics
- —
Market trends
- HPI YoY
- ▲ 40.82%
- Current HPI
- 605.31
- Rent YoY
- —
- Metro
- —
- State GDP YoY
- ▲ 1.37%
- F500 in state
- 28
Industry mix (Fortune 500 HQ in MI)
| Industry | F500 HQs | Revenue |
|---|---|---|
| Automotive Parts | 3 | $48B |
|
||
| Automotive | 2 | $372B |
|
||
| Chemicals | 1 | $45B |
|
||
| Automotive Retail | 1 | $29B |
|
||
| Healthcare / Medical Devices | 1 | $23B |
|
||
| Automotive Technology | 1 | $20B |
|
||
Price history
+0.0% since first listed3 events — show timeline
- 2026-06-01 Listed $225,000 REALCOMP
- 2026-06-01 Listed $225,000 MiRealSource-MiMLS
- 2026-06-01 Listed $225,000 SW Michigan MLS
Property tax history
+3.2%/yrLatest (2025): $2,276 · +2.4% YoY. Source: county tax records.
Cash-flow waterfall
monthlySold comps — $/sqft
last 12 mo · ≤1 miLoading sold comps…