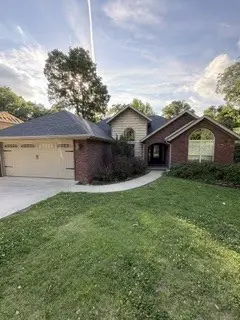
35 Bedford Ln · Bella Vista, AR
Flood risk 1/10 · Minimal
- FEMA flood zone
- X (unshaded)
- Chance of flooding over 30 yrs
- 0.0%
- Est. flood insurance / yr
- $507 – $1,088
Fire risk 3/10 · Minor
- Est. fire insurance / yr
- $1,499 – $2,785
Heat risk 4/10 · Minor
- Hot days now (above 104°F)
- 7 days/yr
- Hot days in 30 yrs
- 20 days/yr
Wind risk 2/10 · Minimal
- Chance of severe wind over 30 yrs
- 2.0%
Air-quality risk 2/10 · Minimal
- Unhealthy air days now
- 0 days/yr
- Unhealthy air days in 30 yrs
- 1 days/yr
Risk factors via First Street. Map © Google.
Why this score? — see what drove the D grade
The composite is a weighted blend of 9 inputs, each scored 0–100. Each bar is that input's sub-score; the figure is the points it added to the 100-point composite (weight × sub-score).
- Cash flow +10.0/30.0
- ARV discount +8.7/15.0
- Appreciation +5.7/10.0
- Schools +5.2/10.0
- Livability +3.4/5.0
- DSCR +2.8/10.0
- Rent growth +2.5/5.0
- Condition / age +2.5/5.0
- 1% rule +2.0/10.0
$335,000
🖨 Deal sheet (PDF) 📄 Offer letter ✓ Due diligence
Listing remarks MLS
STEP INTO POTTERY BARN! ADORABLE & CHARMING NEWER HOME W/ BEAUTIFUL UPGRADES AND DECOR! GRANITE KITCHEN, DECORATOR VANITIES IN BATHS, 3BR, 2BA, SPLIT PLAN & FORMAL DINING. LARGE FENCED YARD, HUGE DECK IN QUIET BV AREA. ONE-OWNER HOME LOVINGLY CARED FOR!, REFRIGERATOR TO CONVEY.
Key facts
- Large back deck
- Laminate flooring
- Tile flooring
Tags
Property features AI
Finance
- HOA & community: Monthly association fee; Community has biking and trails/paths
Exterior
- Parking: Attached garage with garage door opener; 2 covered spaces
- Utilities: Electricity available; Propane
- Home design: Single-story; Aluminum siding and brick exterior; Asphalt shingle roof; Entry on main level; Facing direction not specified
- Construction: Built with aluminum siding and brick; Asphalt shingle roof; Crawlspace and slab foundation
- Exterior features: Concrete driveway; Deck; Privacy wood fencing; City lot; Landscaped yard; Sloped lot; Wooded
Interior
- Kitchen: Disposal; Microwave
- Flooring: Laminate; Simulated wood; Tile
- Bathrooms: 2 full bathrooms
- Heating & cooling: Electric heating; Central air conditioning
- Interior features: Attic; Ceiling fan(s); Split bedroom layout; Storage; Walk-in closet(s)
- Laundry & utility: Electric water heater
Neighborhood map
What this means for you Summary
Snapshot
- This is a 3-bed/2.0-bath single-family listed at $335k.
Deal economics
- At list price, monthly cash flow is $-203 ($-2k/yr) — negative.
- To cash-flow at today's rent, offer at most $299k (10.7% below list).
- To meet the 1% rule (rent ≥ 1% of price), the offer needs to be $233k (30.5% below list).
- Recommended offer: $233k (30.5% below list) — sets the bar for 1% rule.
- Cap rate 5.6% vs local median 3.6% in Bella Vista — top-decile yield for the area; either an underpriced asset or a hidden risk that comps aren't pricing in. Stress-test before assuming the spread holds.
Location & tenants
- Location reads 67/100 on livability (#111 in AR) — a middle-class / working-renter tenant base. Strengths: cost of living A+, housing A+, schools A; Watch: amenities F, commute F, health & safety F.
- Bentonville School District (urban): math 59% / reading 59% proficiency, ranked #3 of 238 in AR (top 1%) — acceptable for families but not a draw, mixed tenant base, ~2y average lease.
- Market conditions: 484 active listings in the ZIP; 6 comparable units currently listed for rent nearby; rentals at typical pace (median 16d on market — plan ~3-4 weeks tenant-placement turnaround); solid renter incomes; 4,359 units permitted in Benton County in 2024 (402 in 5+ unit buildings).
Forward outlook
- In year one you build about $7k of equity ($2k loan paydown + $5k appreciation (1.4% local appreciation)).
- Benton County population projected at +56% by 2050 — long-run rental-demand tailwind backs the buy-and-hold thesis.
- By year 5, paydown + projected appreciation supports a ~$31k cash-out refi (75% LTV) — recoverable capital for the next deal without selling this one.
Negotiation context
- It's been on market 18 days — a 2% lower offer ($330k) is reasonable based on typical stale-listing flexibility.
- 2 sale attempts since 14y ago with the ask held roughly flat each time — persistent listings suggest the price (not the market) is what's stuck; bring a comps-based counter.
- Current owner paid $132k; list at $335k implies a 154% gain — meaningful room to come down on a strong offer.
Questions for the listing agent
- What do current leases actually rent for vs. the listed asking? Can we see a recent rent roll and the last 12 months of T-12 income?
- Is there a deadline driving the sale (1031 exchange, divorce, estate, relocation)? That informs how much negotiation room exists.
- Schools are A-rated — typically a magnet for longer-tenancy family renters. What's the average tenant stay here, and is there a school-zone premium baked into asking?
- The area grade is low — what's the realistic commute time and amenity access for the typical tenant pool here? Any planned neighborhood developments (good or bad) we should know about?
- What's the average days-on-market for RENTAL listings here right now (not sales)? A rising rental-DOM trend means longer vacancies and softer asking-rent achievability than the comps imply.
- What's the recent tenant-quality profile in this submarket — average credit score on applications, eviction rate, late-payment / NSF rate, and stable-employment percentage? A property-management company in the area should have these aggregated.
- How much new for-sale + rental construction is in the pipeline within 1–3 miles? Heavy new supply typically softens prices + rents 12–24 months out; constrained supply supports both.
Investment metrics
- 1% rule
- 0.70% ✗
- Cap rate
- 5.56%
- Cash-on-cash
- -2.60%
- DSCR
- 0.88
- GRM
- 12.0
CMA / ARV
- ARV (on-the-fly)
- $343,860
- Comps found
- 12
Show comp detail 12 sales within ~0.75 mi
| Address | Dist | Beds/Ba | Sqft | Sold | Price | $/sf | Match |
|---|---|---|---|---|---|---|---|
| 89 Cranfield Dr | 0.21mi | 3/2.0 | 1,524 (-2%) | 4mo | $339,325 | $223 | 82 |
| 22 Dunstable Dr | 0.26mi | 3/2.0 | 1,634 (+4%) | 5mo | $253,000 | $155 | 76 |
| 17 S Kirby | 0.09mi | 3/2.0 | 1,750 (+12%) | 3mo | $369,900 | $211 | 73 |
| 9 Richmond Ln | 0.10mi | 3/2.0 | 1,361 (-13%) | 4mo | $335,000 | $246 | 70 |
| 12 Bobwith Ln | 0.37mi | 3/2.0 | 1,675 (+7%) | 6mo | $384,900 | $230 | 66 |
| 11 Thornaby Dr | 0.61mi | 3/2.0 | 1,615 (+3%) | 0mo | $370,900 | $230 | 66 |
| 5 Cranfield Dr | 0.64mi | 3/2.0 | 1,587 (+2%) | 6mo | $342,500 | $216 | 63 |
| 64 Cranfield Dr | 0.21mi | 2/2.0 (-1) | 1,359 (-13%) | 7mo | $200,000 | $147 | 58 |
| 42 Cawood Dr | 0.75mi | 3/2.0 | 1,612 (+3%) | 3mo | $339,950 | $211 | 57 |
| 9 Blythe Cir | 0.46mi | 2/2.0 (-1) | 1,703 (+9%) | 7mo | $392,500 | $230 | 53 |
| 25 Thornaby Dr | 0.72mi | 3/2.0 | 1,726 (+10%) | 2mo | $379,900 | $220 | 47 |
| 4 Ipswich Dr | 0.68mi | 3/2.0 | 1,352 (-14%) | 7mo | $212,000 | $157 | 40 |
Match score weights: distance 35% · size 25% · config 20% · recency 20%. Top-matched comps best support the ARV.
Projected returns pro-forma
1.38% appreciation · 3.0% rent growth · sell at horizon
- IRR
- -0.1%
- Equity multiple
- 0.99×
- Total profit
- $-472
- Equity at exit
- $121,122
- IRR
- 4.5%
- Equity multiple
- 1.57×
- Total profit
- $53,228
- Equity at exit
- $166,322
Cash invested: $93,800 (down + closing). Projections, not guarantees.
Landlord ↔ Tenant lean methodology
- Overall (STATE)
- 92 Strongly Landlord-Friendly
- State Arkansas
- 92 Strongly Landlord-Friendly · R+14
- County
- — inherits STATE
- City
- — inherits STATE
ZIP-level market 72714
- Home prices YoY
- 0.5%
- Active inventory
- 484
- Price-to-rent
- 12.0×
Monthly cashflow live
- Estimated rent
- $2,329 high interval (Pro) →
- Mortgage (P&I)
- −$1,757
- Tax from tax record
- −$147 /mo · $1,767/yr
- Insurance
- −$140
- HOA
- −$0
- Vacancy / Maint / Mgmt
- −$489
- Net cashflow
- $-203
Break-even live
Sensitivity live
| Price | -10% $-14 | -5% $-109 | +0% $-203 | +5% $-298 | +10% $-393 |
|---|---|---|---|---|---|
| Rent | -10% $-387 | -5% $-295 | +0% $-203 | +5% $-111 | +10% $-19 |
| Rate | -1.0pp $-35 | -0.5pp $-118 | base $-203 | +0.5pp $-290 | +1.0pp $-379 |
UW: 25.0% down · 7.5% · 30yr · 1.5% tax · 5.0% vac · 8.0% maint · 8.0% mgmt
Financing live
Cash to close
- Down payment
- $83,750
- Closing costs
- $10,050
- Reserves months
- —
- Total cash needed
- —
Loan-product check · same deal, 3 products live
Conventional
25% down · 7.5% · 30yr
- Down + closing
- —
- Monthly P&I
- —
- Monthly cashflow
- —
- DSCR
- —
- Eligible?
- —
Personal DTI + credit; lowest rate.
DSCR
20% down · 8.5% · 30yr
- Down + closing
- —
- Monthly P&I
- —
- Monthly cashflow
- —
- DSCR
- —
- Eligible?
- —
No personal income docs; deal must DSCR.
Hard money
10% down · 12.0% · 12mo
- Down + closing
- —
- Monthly P&I
- —
- Monthly cashflow
- —
- DSCR
- —
- Eligible?
- —
Short-term bridge; refi at stabilization.
Rent comps 6 comps
| Address | Beds | Baths | Sqft | Rent | $/sqft | DOM | Units | Dist |
|---|---|---|---|---|---|---|---|---|
| 1 Sandy Ln Bella Vista, AR | 3.0 | 2.0 | 1640 | $1,950 | $1.19 | 15d | 1 | 0.33mi |
| 16 Stretford Dr Bella Vista, AR | 4.0 | 3.0 | 2182 | $3,500 | $1.60 | 15d | 1 | 0.57mi |
| 7 Ulverston Dr Bella Vista, AR | 3.0 | 2.0 | 2000 | $1,900 | $0.95 | 15d | 1 | 0.68mi |
| 53 Skipton Dr Bella Vista, AR | 4.0 | 2.0 | 1607 | $2,600 | $1.62 | 16d | 1 | 0.70mi |
| 12 Celtic Dr Bella Vista, AR | 3.0 | 2.0 | 1716 | $1,895 | $1.10 | 45d | 1 | 0.81mi |
| 9 Bewdley Cir Bella Vista, AR | 3.0 | 2.0 | 1104 | $1,650 | $1.49 | 15d | 1 | 1.04mi |
Listing history 13 events
-
2026-06-22days on market $335,000 Active 18 DOM
-
2026-06-18days on market $335,000 Active 15 DOM
-
2026-06-17days on market $335,000 Active 14 DOM
-
2026-06-16days on market $335,000 Active 13 DOM
-
2026-06-15days on market $335,000 Active 12 DOM
-
2026-06-14days on market $335,000 Active 10 DOM
-
2026-06-10remarks 681-char remark
-
2026-06-10days on market $335,000 Active 7 DOM
-
2026-06-09days on market $335,000 Active 6 DOM
-
2026-06-08days on market $335,000 Active 5 DOM
-
2026-06-07days on market $335,000 Active 4 DOM
-
2026-06-03remarks 214-char remark
-
2026-06-03$335,000 Active 1 DOM
ⓘ Source: listings_history table (triggers on properties + properties_extension) + one-shot
backfill from property_details.listing_events for pre-trigger history.
Tax reassessment forecast AR · Resets to sale price
- Current annual tax
- $1,767 · $147/mo
- Projected year-2 tax
- $2,144 · $179/mo
- Expected delta
- +$377/yr (+$31/mo · 21.3%)
ⓘ Screening estimate from a state-policy table — verify with the county assessor before closing.
Climate risk First Street
- Flood 1/10 Low FEMA zone X (unshaded) · 0% chance over 30 yrs
- Wildfire 3/10 Moderate
- Heat 4/10 Moderate 7 d/yr ≥104°F today · 20 d/yr by 30 yrs out
- Wind 2/10 Low 2% chance of damaging wind over 30 yrs
- Air quality 2/10 Low 0 unhealthy d/yr today · 1 by 30 yrs out
Nearby sold comps map
Loading sold comps map…
Walkable amenities ~0.75 mi
Loading nearby amenities…
Taxation est. · year 1
- Rental income
- $27,952
- − Mortgage interest
- −$18,765
- − Property taxes
- −$1,767
- − Insurance
- −$1,675
- − Repairs & maintenance
- −$2,236
- − Management
- −$2,236
- − Depreciation
- −$9,745
- Taxable loss
- −$8,473
- Est. tax savings @ 24.0%
- +$2,034
- After-tax cash flow
- $-408/yr
For passive investors: Depreciation is non-cash, so a rental often shows a tax loss while cash-flowing — sheltering income. Rental losses are passive: they offset passive income freely, and up to $25,000/yr can offset ordinary (W-2) income if you actively participate and your MAGI is under $100k (phasing out to $0 by $150k); unused losses carry forward. On sale, claimed depreciation is recaptured at up to 25%, and gains may owe capital-gains tax (a 1031 exchange can defer both). Figures are a year-1 estimate at your 24.0% rate — not tax advice; consult a CPA.
Schools (NCES district)
- District
- Bentonville School District
- NCES district ID
- 0503060
- Math proficiency
- 59% ▼ -8.00%
- Reading proficiency
- 59% ▼ -6.00%
- Median HH income
- $66,721
- Composite
- 51.85/100
- National rank
- #1661
- State rank
- #3 of 238 in AR
Livability — Bella Vista
- Score
- 67/100
- State rank
- #111
- US rank
- #11129
Category grades
Schools grade is shown separately in the Schools card above.
Census & demographics
- Census place
- Bella Vista, AR
- County
- Benton County · 259,241 people
- City population
- 31,638
- Metro
- Fayetteville-Springdale-Rogers, AR
- Population (ZIP)
- 14,350
- Household income
- $103,125
- Rent vs Own
- Severe rent burden
- 61.0
Population outlook (Benton County) Hauer SSP2
- Today (2025)
- 318,683 people
- By 2030
- 353,481 · +10.9%
- By 2040
- 425,280 · +33.4%
- By 2050
- 497,239 · +56.0%
- By 2075
- 662,114 · +107.8%
- By 2100
- 776,431 · +143.6%
Race, ethnicity, and origin ACS 2023
- Neighborhood character
- Predominantly White (83%)
- Race & ethnicity
- White 83% Two or more races 11% Hispanic / Latino 6%
- Hispanic origin (detail)
- Mexican 2% Dominican 2%
- Common ancestry
- Slovak 4% Lithuanian 3% Italian 3%
- Foreign-born
- 3% · Canada
- Languages at home
- 98% English-only · Spanish 2%
Political lean MEDSL · Benton
- 2024 margin
- Strong R (+27.0) · D 35.2% · R 62.1% · Other 2.7%
- 2008→2024 swing
- +9.6pp toward D · 2008: -36.5pp · 2024: -27.0pp
- All cycles
- 2024: R+27.0 2020: R+26.4 2016: R+34.9 2012: R+40.4 2008: R+36.5
Not yet ingested
- Civics
- —
Market trends
- HPI YoY
- ▲ 1.38%
- Current HPI
- 307.5796
- Rent YoY
- —
- Metro
- Fayetteville-Springdale-Rogers, AR
- State GDP YoY
- ▲ 3.80%
- F500 in state
- 10
Industry mix (Fortune 500 HQ in AR)
| Industry | F500 HQs | Revenue |
|---|---|---|
| Retail | 1 | $681B |
|
||
| Food / Agriculture | 1 | $53B |
|
||
| Retail / Energy | 1 | $22B |
|
||
| Transportation / Logistics | 1 | $12B |
|
||
| Energy | 1 | $4B |
|
||
Price history
+142.8% since first listed4 events — show timeline
- 2026-06-02 Listed $335,000 NWARMLS
- 2012-10-03 Sold (Public Records) $132,000 Public Records
- 2012-10-02 Sold (MLS) $131,500 NWARMLS
- 2012-08-10 Listed $138,000 NWARMLS
Property tax history
+2.6%/yrLatest (2025): $1,767 · +1.2% YoY. Source: county tax records.
Cash-flow waterfall
monthlySold comps — $/sqft
last 12 mo · ≤1 miLoading sold comps…