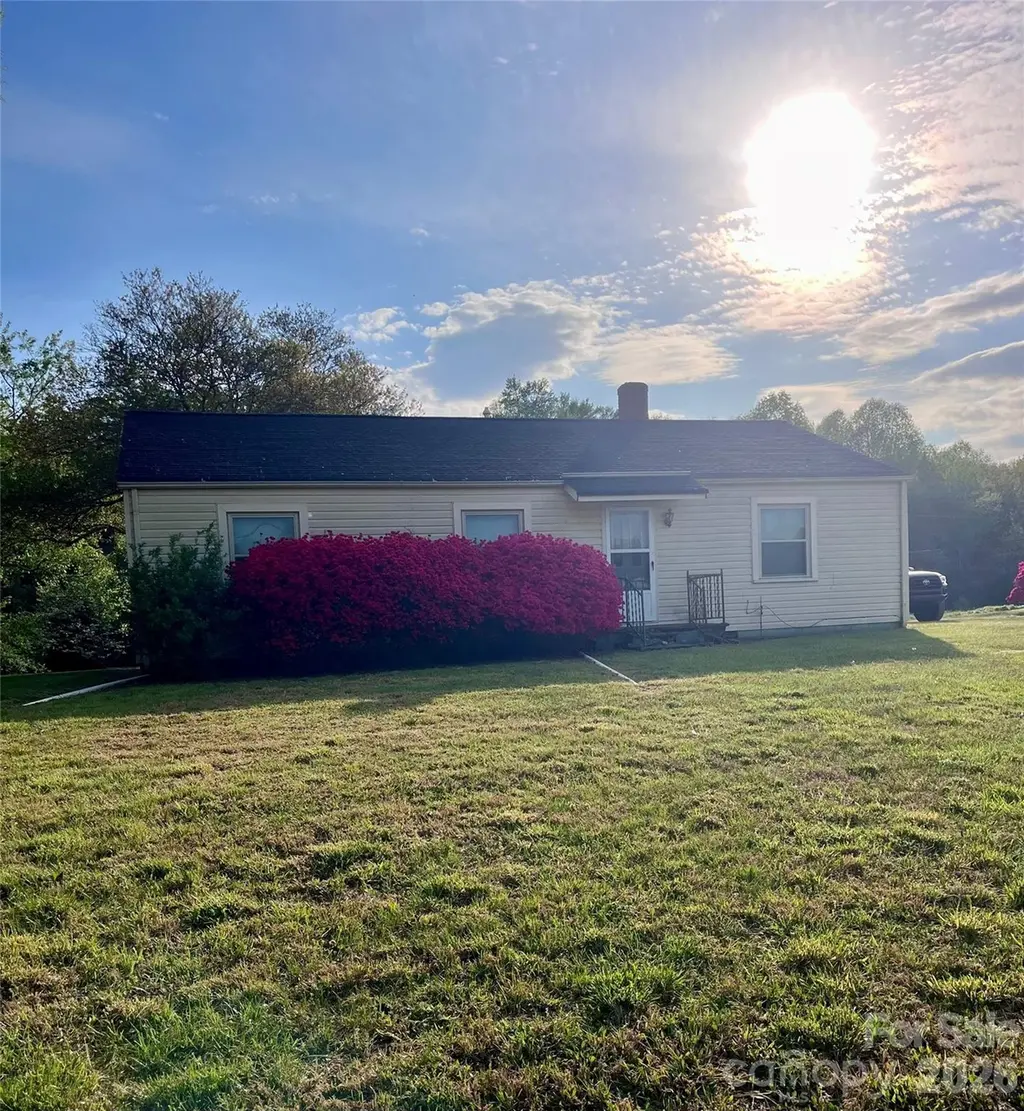
1033 NC 16 Hwy N · Taylorsville, NC
Flood risk 1/10 · Minimal
- FEMA flood zone
- X (unshaded)
- Chance of flooding over 30 yrs
- 0.0%
- Est. flood insurance / yr
- $507 – $1,088
Fire risk 4/10 · Minor
- Est. fire insurance / yr
- $906 – $1,684
Heat risk 5/10 · Moderate
- Hot days now (above 102°F)
- 7 days/yr
- Hot days in 30 yrs
- 19 days/yr
Wind risk 2/10 · Minimal
- Chance of severe wind over 30 yrs
- 1.0%
Air-quality risk 2/10 · Minimal
- Unhealthy air days now
- 1 days/yr
- Unhealthy air days in 30 yrs
- 2 days/yr
Risk factors via First Street. Map © Google.
Why this score? — see what drove the B+ grade
The composite is a weighted blend of 9 inputs, each scored 0–100. Each bar is that input's sub-score; the figure is the points it added to the 100-point composite (weight × sub-score).
- Cash flow +30.0/30.0
- ARV discount +15.0/15.0
- DSCR +10.0/10.0
- 1% rule +9.5/10.0
- Schools +4.5/10.0
- Livability +3.5/5.0
- Rent growth +2.5/5.0
- Condition / age +2.5/5.0
- Appreciation +0.0/10.0
$115,000
🖨 Deal sheet 📄 Offer letter ✓ Due diligence
Listing remarks
This charming 3-bedroom, 1-bathroom fixer upper offers incredible potential for the savvy buyer or investor looking to add sweat equity. While the home is dated and the original finishes need some work, it remains fully livable and structurally sound, providing a solid foundation for your personal vision. This rustic beauty features 3 reasonably sized bedrooms, a spacious kitchen and a cozy living area perfect for everyday living. Situated on a generously sized lot butting up to a creek, this home offers lots of room for outdoor enjoyment. This property offers an excellent opportunity to create your dream home through cosmetic and functional updates. Don't miss your chance to transform this
Key facts
- Generously sized lot
- Spacious kitchen
- Cozy living area
Tags
Neighborhood map
What this means for you Summary
Snapshot
- This is a 3-bed/1.0-bath single-family listed at $115k.
Deal economics
- At list price, monthly cash flow is $613 ($7k/yr) — positive.
- The deal already cash-flows at list — no discount required.
- Meets the 1% rule at list price ($2k rent vs $115k).
- Cap rate 12.7% vs local median 4.0% in Taylorsville — top-decile yield for the area; either an underpriced asset or a hidden risk that comps aren't pricing in. Stress-test before assuming the spread holds.
Location & tenants
- Location reads 69/100 on livability (#159 in NC) — a middle-class / working-renter tenant base. Strengths: crime A+, cost of living A+, housing A-; Watch: schools C-, amenities F, commute F.
- Alexander County Schools (rural): math 52% / reading 55% proficiency, ranked #52 of 178 in NC (top 29%) — acceptable for families but not a draw, mixed tenant base, ~2y average lease.
- Market conditions: 135 active listings in the ZIP; 113 units permitted in Alexander County in 2024 (0 in 5+ unit buildings).
Forward outlook
- Local home prices are declining (-3.0%/yr); year-one equity from $795 of loan paydown is wiped out by about $3k of value loss. Plan a longer hold.
- Alexander County population projected at -18% by 2050 — secular population decline; favor cash flow + early exit over multi-decade hold.
- At projected returns (-3.0% appreciation + 3.0% rent growth), your $32k cash investment doubles in ~6 years — after that, you're playing with house money.
Negotiation context
- Only 5 days on market — expect competitive offers; lowballing is unlikely to land.
Risks & watch-outs
- Watch-outs: built in 1955 — expect roof / HVAC / electrical / plumbing capex.
- Climate carrying-cost: extreme-heat days projected 7→19/yr by 2055 (HVAC capex compounding) — expect insurance premiums to compound above CPI over the hold.
Questions for the listing agent
- Built in 1955 — when were the roof, HVAC, electrical panel, plumbing, and water heater last replaced?
- Is there a deadline driving the sale (1031 exchange, divorce, estate, relocation)? That informs how much negotiation room exists.
- What's the average days-on-market for RENTAL listings here right now (not sales)? A rising rental-DOM trend means longer vacancies and softer asking-rent achievability than the comps imply.
- What's the recent tenant-quality profile in this submarket — average credit score on applications, eviction rate, late-payment / NSF rate, and stable-employment percentage? A property-management company in the area should have these aggregated.
- How much new for-sale + rental construction is in the pipeline within 1–3 miles? Heavy new supply typically softens prices + rents 12–24 months out; constrained supply supports both.
Investment metrics
- 1% rule
- 1.45% ✓
- Cap rate
- 12.69%
- Cash-on-cash
- 22.83%
- DSCR
- 2.02
- GRM
- 5.8
CMA / ARV
- ARV (on-the-fly)
- $196,084
- Comps found
- 5
Show comp detail 5 sales within ~0.75 mi
| Address | Dist | Beds/Ba | Sqft | Sold | Price | $/sf | Match |
|---|---|---|---|---|---|---|---|
| 1033 NC 16 Hwy N | 0.00mi | 3/1.0 | 1,316 (0%) | 1mo | $107,000 | $81 | 100 |
| 80 Sunset Dr | 0.34mi | 3/2.0 | 1,512 (+15%) | 15mo | $225,000 | $149 | 43 |
| 35 Wilson Ln | 0.53mi | 2/2.0 (-1) | 1,217 (-8%) | 24mo | $239,900 | $197 | 34 |
| 355 Gravel Hill Ct | 0.53mi | 2/1.0 (-1) | 1,140 (-13%) | 18mo | $47,000 | $41 | 32 |
| 796 Old Wilkesboro Rd | 0.64mi | 3/2.0 | 1,120 (-15%) | 13mo | $226,100 | $202 | 30 |
Match score weights: distance 35% · size 25% · config 20% · recency 20%. Top-matched comps best support the ARV.
Projected returns pro-forma
-3.0% appreciation · 3.0% rent growth · sell at horizon
- IRR
- 15.7%
- Equity multiple
- 1.63×
- Total profit
- $20,350
- Equity at exit
- $17,147
- IRR
- 24.4%
- Equity multiple
- 3.11×
- Total profit
- $67,830
- Equity at exit
- $9,943
Cash invested: $32,200 (down + closing). Projections, not guarantees.
Landlord ↔ Tenant lean methodology
- Overall (STATE)
- 85 Strongly Landlord-Friendly
- State North Carolina
- 85 Strongly Landlord-Friendly · R+3
- County
- — inherits STATE
- City
- — inherits STATE
ZIP-level market 28681
- Home prices YoY
- -11.9%
- Active inventory
- 135
- Price-to-rent
- 5.8×
Monthly cashflow live
- Estimated rent
- $1,663 medium interval (Pro) →
- Mortgage (P&I)
- −$603
- Tax from tax record
- −$50 /mo · $601/yr
- Insurance
- −$48
- HOA
- −$0
- Vacancy / Maint / Mgmt
- −$349
- Net cashflow
- $613
Break-even live
UW: 25.0% down · 7.5% · 30yr · 1.5% tax · 5.0% vac · 8.0% maint · 8.0% mgmt
Financing live
Cash to close
- Down payment
- $28,750
- Closing costs
- $3,450
- Reserves months
- —
- Total cash needed
- —
Loan-product check · same deal, 3 products live
Conventional
25% down · 7.5% · 30yr
- Down + closing
- —
- Monthly P&I
- —
- Monthly cashflow
- —
- DSCR
- —
- Eligible?
- —
Personal DTI + credit; lowest rate.
DSCR
20% down · 8.5% · 30yr
- Down + closing
- —
- Monthly P&I
- —
- Monthly cashflow
- —
- DSCR
- —
- Eligible?
- —
No personal income docs; deal must DSCR.
Hard money
10% down · 12.0% · 12mo
- Down + closing
- —
- Monthly P&I
- —
- Monthly cashflow
- —
- DSCR
- —
- Eligible?
- —
Short-term bridge; refi at stabilization.
Listing history 2 events
-
2026-04-20status Pending
-
2026-04-14$115,000 Active
ⓘ Source: listings_history table (triggers on properties + properties_extension) + one-shot
backfill from property_details.listing_events for pre-trigger history.
Tax reassessment forecast NC · Resets to sale price
- Current annual tax
- $601 · $50/mo
- Projected year-2 tax
- $943 · $79/mo
- Expected delta
- +$342/yr (+$28/mo · 56.9%)
ⓘ Screening estimate from a state-policy table — verify with the county assessor before closing.
Climate risk First Street
- Flood 1/10 Low FEMA zone X (unshaded) · 0% chance over 30 yrs
- Wildfire 4/10 Moderate
- Heat 5/10 Major 7 d/yr ≥102°F today · 19 d/yr by 30 yrs out
- Wind 2/10 Low 100% chance of damaging wind over 30 yrs
- Air quality 2/10 Low 1 unhealthy d/yr today · 2 by 30 yrs out
Nearby sold comps map
Loading sold comps map…
Walkable amenities ~0.75 mi
Loading nearby amenities…
Taxation est. · year 1
- Rental income
- $19,955
- − Mortgage interest
- −$6,442
- − Property taxes
- −$601
- − Insurance
- −$575
- − Repairs & maintenance
- −$1,596
- − Management
- −$1,596
- − Depreciation
- −$3,345
- Taxable income
- $5,799
- Est. tax owed @ 24.0%
- −$1,392
- After-tax cash flow
- $5,960/yr
For passive investors: Depreciation is non-cash, so a rental often shows a tax loss while cash-flowing — sheltering income. Rental losses are passive: they offset passive income freely, and up to $25,000/yr can offset ordinary (W-2) income if you actively participate and your MAGI is under $100k (phasing out to $0 by $150k); unused losses carry forward. On sale, claimed depreciation is recaptured at up to 25%, and gains may owe capital-gains tax (a 1031 exchange can defer both). Figures are a year-1 estimate at your 24.0% rate — not tax advice; consult a CPA.
Schools (NCES district)
- District
- Alexander County Schools
- NCES district ID
- 3700090
- Math proficiency
- 52% ▲ 5.00%
- Reading proficiency
- 55% ▲ 7.00%
- Median HH income
- $41,189
- Composite
- 44.84/100
- National rank
- #2732
- State rank
- #52 of 178 in NC
Livability — Taylorsville
- Score
- 69/100
- State rank
- #159
- US rank
- #8794
Category grades
Schools grade is shown separately in the Schools card above.
Census & demographics
- Population (ZIP)
- 26,117
Population outlook (Alexander County) Hauer SSP2
- Today (2025)
- 36,916 people
- By 2030
- 36,085 · -2.3%
- By 2040
- 33,528 · -9.2%
- By 2050
- 30,229 · -18.1%
- By 2075
- 23,159 · -37.3%
- By 2100
- 15,981 · -56.7%
Race, ethnicity, and origin ACS 2023
- Neighborhood character
- Predominantly White (88%)
- Race & ethnicity
- White 88% Black 5% Hispanic / Latino 5% Two or more races 3% Native American 1%
- Common ancestry
- Slovak 2% Romanian 1% Serbian 1%
- Foreign-born
- 2% · Canada, China
- Languages at home
- 94% English-only · Spanish 4% German/W. Germanic 1%
Political lean MEDSL · Alexander
- 2024 margin
- Solid R (+59.9) · D 19.7% · R 79.5%
- 2008→2024 swing
- -21.5pp toward R · 2008: -38.4pp · 2024: -59.9pp
- All cycles
- 2024: R+59.9 2020: R+58.0 2016: R+55.9 2012: R+44.6 2008: R+38.4
Not yet ingested
- Civics
- —
Market trends
- HPI YoY
- ▼ -30.79%
- Current HPI
- 227.497
- Rent YoY
- —
- Metro
- —
- State GDP YoY
- ▲ 3.28%
- F500 in state
- 26
Industry mix (Fortune 500 HQ in NC)
| Industry | F500 HQs | Revenue |
|---|---|---|
| Financial Services | 2 | $213B |
|
||
| Retail | 2 | $95B |
|
||
| Industrial Conglomerate | 1 | $38B |
|
||
| Metals / Steel | 1 | $35B |
|
||
| Utilities | 1 | $30B |
|
||
| Industrial Machinery | 1 | $19B |
|
||
Price history
2 events — show timeline
- 2026-04-20 Pending — CANOPYMLS as Distributed by MLS Grid
- 2026-04-14 Listed $115,000 CANOPYMLS as Distributed by MLS Grid
Property tax history
+2.9%/yrLatest (2025): $601 · +4.3% YoY. Source: county tax records.
Cash-flow waterfall
monthlySold comps — $/sqft
last 12 mo · ≤1 miLoading sold comps…