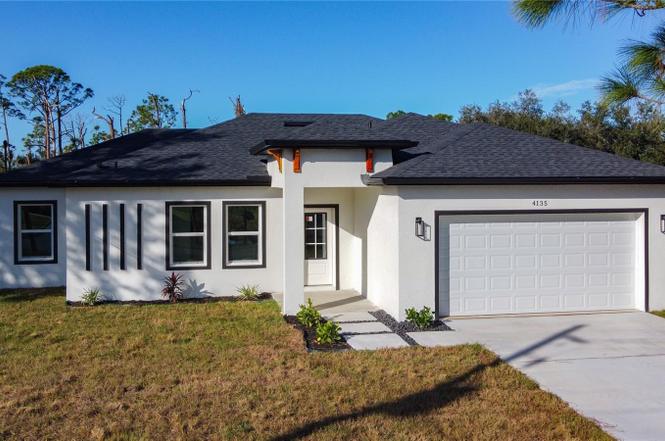
4135 Geoffrey St · North Port, FL
Flood risk 1/10 · Minimal
- FEMA flood zone
- X (unshaded)
- Chance of flooding over 30 yrs
- 0.0%
- Est. flood insurance / yr
- $507 – $1,088
Fire risk 3/10 · Minor
- Est. fire insurance / yr
- $947 – $1,759
Heat risk 10/10 · Severe
- Hot days now (above 108°F)
- 6 days/yr
- Hot days in 30 yrs
- 24 days/yr
Wind risk 10/10 · Severe
- Chance of severe wind over 30 yrs
- 99.0%
Air-quality risk 2/10 · Minimal
- Unhealthy air days now
- 1 days/yr
- Unhealthy air days in 30 yrs
- 1 days/yr
Risk factors via First Street. Map © Google.
Why this score? — see what drove the D- grade
The composite is a weighted blend of 9 inputs, each scored 0–100. Each bar is that input's sub-score; the figure is the points it added to the 100-point composite (weight × sub-score).
- Cash flow +11.4/30.0
- ARV discount +7.5/15.0
- Schools +5.4/10.0
- Livability +3.8/5.0
- DSCR +3.3/10.0
- Rent growth +2.5/5.0
- Condition / age +2.5/5.0
- 1% rule +1.9/10.0
- Appreciation +0.0/10.0
$339,990
🖨 Deal sheet 📄 Offer letter ✓ Due diligence
Listing remarks
Under contract-accepting backup offers. Discover this brand-new home, thoughtfully designed for those seeking style, comfort, and peace of mind — with no HOA restrictions. From the moment you step inside, high ceilings and an open layout create a bright, Tile throughout the house, spacious atmosphere that truly feels like home. The kitchen stands out as the heart of the home, featuring stainless steel appliances, tall, modern cabinetry, and high-quality finishes that reflect excellent craftsmanship and attention to detail throughout. Enjoy added security and efficiency with hurricane-impact windows, sliding glass doors, and garage door, along with gutters already installed, offering c
Key facts
- Sliding glass doors
- Gutters installed
- Open layout
Tags
Property features AI
Finance
- Other: Property type: Residential — Single Family Residence; Lot size approximately 0.23 acres (0 to less than 1/4 acre); Living area listed as 1,773 (builder source); total building area 2,296 (builder source)
- HOA & community: Pets allowed
Exterior
- Parking: Attached garage; 2-car garage
- Utilities: Well water; Septic tank sewer; Electricity connected; Other utilities
- Home design: Single-family residence; One story; Residential property, completed; Faces east
- Construction: Block construction; Shingle roof; Block and slab foundation; New construction
- Exterior features: Exterior lighting; Sliding doors; Private mailbox; Other exterior features; Drainage canal on the lot; Asphalt and other road surfaces
Interior
- Kitchen: Dishwasher; Microwave; Range; Refrigerator
- Bedrooms: 4 bedrooms
- Flooring: Ceramic tile
- Bathrooms: 2 full bathrooms
- Heating & cooling: Central heating; Central air
- Interior features: Ceiling fans; Coffered ceilings; High ceilings; Kitchen/family room combo; Living room/dining room combo; Open floorplan; Thermostat; Tray ceilings; Walk-in closets
- Laundry & utility: Dedicated laundry room
Neighborhood map
What this means for you Summary
Snapshot
- This is a 4-bed/2.0-bath single-family listed at $340k.
Deal economics
- At list price, monthly cash flow is $-116 ($-1k/yr) — negative.
- To cash-flow at today's rent, offer at most $319k (6.0% below list).
- To meet the 1% rule (rent ≥ 1% of price), the offer needs to be $236k (30.5% below list).
- Recommended offer: $236k (30.5% below list) — sets the bar for 1% rule.
- Cap rate 5.9% vs local median 3.6% in North Port — top-decile yield for the area; either an underpriced asset or a hidden risk that comps aren't pricing in. Stress-test before assuming the spread holds.
Location & tenants
- Location reads 75/100 on livability (#252 in FL, #3,975 nationally) — a middle-class / working-renter tenant base. Strengths: crime A+, housing A+, health & safety A+; Watch: amenities F, commute F.
- Sarasota (urban): math 63% / reading 63% proficiency, ranked #7 of 73 in FL (top 10%) — acceptable for families but not a draw, mixed tenant base, ~2y average lease.
- Market conditions: 536 active listings in the ZIP; solid renter incomes; 7,466 units permitted in Sarasota County in 2024 (2,138 in 5+ unit buildings).
- This rent runs 30% of the median local income ($93k/yr) — at the standard rent-burdened threshold; future hikes will face affordability resistance.
Forward outlook
- Local home prices are declining (-3.0%/yr); year-one equity from $2k of loan paydown is wiped out by about $10k of value loss. Plan a longer hold.
- Sarasota County population projected at +20% by 2050 — long-run rental-demand tailwind backs the buy-and-hold thesis.
Negotiation context
- It's been on market 126 days — a 12% lower offer ($299k) is reasonable based on typical stale-listing flexibility.
- 5 sale attempts since 11y ago with the ask held roughly flat each time — persistent listings suggest the price (not the market) is what's stuck; bring a comps-based counter.
- Current owner paid $15k; list at $340k implies a 2167% gain — meaningful room to come down on a strong offer.
Risks & watch-outs
- Climate carrying-cost: severe wind risk, 99% chance of damaging wind over 30y; extreme-heat days projected 6→24/yr by 2055 (HVAC capex compounding) — expect insurance premiums to compound above CPI over the hold.
Questions for the listing agent
- What do current leases actually rent for vs. the listed asking? Can we see a recent rent roll and the last 12 months of T-12 income?
- It's been on market 126 days. Have you received any prior offers? Is the seller open to a 31% concession, seller financing, or rate buy-down credit?
- Why hasn't it sold? Are there any deal-killer items the seller is aware of (foundation, flood, title, zoning, code violations)?
- Is there a deadline driving the sale (1031 exchange, divorce, estate, relocation)? That informs how much negotiation room exists.
- Schools are B-rated — typically a magnet for longer-tenancy family renters. What's the average tenant stay here, and is there a school-zone premium baked into asking?
- The area grade is low — what's the realistic commute time and amenity access for the typical tenant pool here? Any planned neighborhood developments (good or bad) we should know about?
- What's the average days-on-market for RENTAL listings here right now (not sales)? A rising rental-DOM trend means longer vacancies and softer asking-rent achievability than the comps imply.
- What's the recent tenant-quality profile in this submarket — average credit score on applications, eviction rate, late-payment / NSF rate, and stable-employment percentage? A property-management company in the area should have these aggregated.
- How much new for-sale + rental construction is in the pipeline within 1–3 miles? Heavy new supply typically softens prices + rents 12–24 months out; constrained supply supports both.
Investment metrics
- 1% rule
- 0.69% ✗
- Cap rate
- 5.88%
- Cash-on-cash
- -1.46%
- DSCR
- 0.93
- GRM
- 12.0
CMA / ARV
No comps found within radius.
Projected returns pro-forma
-3.0% appreciation · 3.0% rent growth · sell at horizon
- IRR
- -18.8%
- Equity multiple
- 0.34×
- Total profit
- $-62,674
- Equity at exit
- $50,694
- IRR
- -11.4%
- Equity multiple
- 0.32×
- Total profit
- $-64,865
- Equity at exit
- $29,396
Cash invested: $95,197 (down + closing). Projections, not guarantees.
Landlord ↔ Tenant lean methodology
- Overall (STATE)
- 87 Strongly Landlord-Friendly
- State Florida
- 87 Strongly Landlord-Friendly · R+3
- County
- — inherits STATE
- City
- — inherits STATE
ZIP-level market 34291
- Home prices YoY
- -9.1%
- Active inventory
- 536
- Price-to-rent
- 12.0×
Monthly cashflow live
- Estimated rent
- $2,363 medium interval (Pro) →
- Mortgage (P&I)
- −$1,783
- Tax from tax record
- −$58 /mo · $694/yr
- Insurance
- −$142
- HOA
- −$0
- Vacancy / Maint / Mgmt
- −$496
- Net cashflow
- $-116
Break-even live
UW: 25.0% down · 7.5% · 30yr · 1.5% tax · 5.0% vac · 8.0% maint · 8.0% mgmt
Financing live
Cash to close
- Down payment
- $84,998
- Closing costs
- $10,200
- Reserves months
- —
- Total cash needed
- —
Loan-product check · same deal, 3 products live
Conventional
25% down · 7.5% · 30yr
- Down + closing
- —
- Monthly P&I
- —
- Monthly cashflow
- —
- DSCR
- —
- Eligible?
- —
Personal DTI + credit; lowest rate.
DSCR
20% down · 8.5% · 30yr
- Down + closing
- —
- Monthly P&I
- —
- Monthly cashflow
- —
- DSCR
- —
- Eligible?
- —
No personal income docs; deal must DSCR.
Hard money
10% down · 12.0% · 12mo
- Down + closing
- —
- Monthly P&I
- —
- Monthly cashflow
- —
- DSCR
- —
- Eligible?
- —
Short-term bridge; refi at stabilization.
Listing history 12 events
-
2026-05-12status Pending
-
2026-04-16status Active
-
2026-04-16price $339,990
-
2026-04-16historical
-
2026-04-15$339,990 Active
-
2026-03-25historical
-
2026-01-21price $364,900
-
2025-12-15$369,900 Active
-
2024-07-31soldstatus $15,000
-
2022-07-28$21,000 Active
-
2015-12-16$4,900
-
2015-09-17soldstatus $8,900
ⓘ Source: listings_history table (triggers on properties + properties_extension) + one-shot
backfill from property_details.listing_events for pre-trigger history.
Tax reassessment forecast FL · Resets to sale price
- Current annual tax
- $694 · $58/mo
- Projected year-2 tax
- $2,822 · $235/mo
- Expected delta
- +$2,128/yr (+$177/mo · 306.4%)
ⓘ Screening estimate from a state-policy table — verify with the county assessor before closing.
Climate risk First Street
- Flood 1/10 Low FEMA zone X (unshaded) · 0% chance over 30 yrs
- Wildfire 3/10 Moderate
- Heat 10/10 Extreme 6 d/yr ≥108°F today · 24 d/yr by 30 yrs out
- Wind 10/10 Extreme 99% chance of damaging wind over 30 yrs
- Air quality 2/10 Low 1 unhealthy d/yr today · 1 by 30 yrs out
Nearby sold comps map
Loading sold comps map…
Walkable amenities ~0.75 mi
Loading nearby amenities…
Taxation est. · year 1
- Rental income
- $28,351
- − Mortgage interest
- −$19,045
- − Property taxes
- −$694
- − Insurance
- −$1,700
- − Repairs & maintenance
- −$2,268
- − Management
- −$2,268
- − Depreciation
- −$9,891
- Taxable loss
- −$7,515
- Est. tax savings @ 24.0%
- +$1,804
- After-tax cash flow
- $411/yr
For passive investors: Depreciation is non-cash, so a rental often shows a tax loss while cash-flowing — sheltering income. Rental losses are passive: they offset passive income freely, and up to $25,000/yr can offset ordinary (W-2) income if you actively participate and your MAGI is under $100k (phasing out to $0 by $150k); unused losses carry forward. On sale, claimed depreciation is recaptured at up to 25%, and gains may owe capital-gains tax (a 1031 exchange can defer both). Figures are a year-1 estimate at your 24.0% rate — not tax advice; consult a CPA.
Schools (NCES district)
- District
- Sarasota
- NCES district ID
- 1201680
- Math proficiency
- 63% ▼ -8.00%
- Reading proficiency
- 63% ▼ -3.00%
- Median HH income
- $51,167
- Composite
- 53.68/100
- National rank
- #1428
- State rank
- #7 of 73 in FL
Livability — North Port
- Score
- 75/100
- State rank
- #252
- US rank
- #3975
Category grades
Schools grade is shown separately in the Schools card above.
Census & demographics
- Census place
- North Port, FL
- County
- Sarasota County · 448,376 people
- City population
- 75,324
- Metro
- North Port-Sarasota-Bradenton, FL
- Population (ZIP)
- 8,630
- Household income
- $93,425
- Rent vs Own
- Severe rent burden
- 19.0
Population outlook (Sarasota County) Hauer SSP2
- Today (2025)
- 452,380 people
- By 2030
- 474,175 · +4.8%
- By 2040
- 511,577 · +13.1%
- By 2050
- 541,467 · +19.7%
- By 2075
- 604,947 · +33.7%
- By 2100
- 621,965 · +37.5%
Race, ethnicity, and origin ACS 2023
- Neighborhood character
- Predominantly White (76%)
- Race & ethnicity
- White 76% Hispanic / Latino 14% Two or more races 7% Black 7%
- Hispanic origin (detail)
- Mexican 1% Puerto Rican 6%
- Common ancestry
- Subsaharan African 6% French 4% Romanian 3%
- Foreign-born
- 16% · Canada
- Languages at home
- 72% English-only · Spanish 13% Russian/Polish/Slavic 10% French/Haitian/Cajun 4%
Political lean MEDSL · Sarasota
- 2024 margin
- R (+18.2) · D 40.5% · R 58.7%
- 2008→2024 swing
- -18.1pp toward R · 2008: -0.1pp · 2024: -18.2pp
- All cycles
- 2024: R+18.2 2020: R+10.4 2016: R+11.6 2012: R+7.4 2008: R+0.1
Not yet ingested
- Civics
- —
Market trends
- HPI YoY
- ▼ -30.53%
- Current HPI
- 306.4167
- Rent YoY
- —
- Metro
- North Port-Sarasota-Bradenton, FL
- State GDP YoY
- ▲ 3.28%
- F500 in state
- 36
Industry mix (Fortune 500 HQ in FL)
| Industry | F500 HQs | Revenue |
|---|---|---|
| Industrial Technology | 2 | $29B |
|
||
| Insurance | 2 | $17B |
|
||
| Retail | 1 | $60B |
|
||
| Technology Distribution | 1 | $58B |
|
||
| Homebuilding | 1 | $35B |
|
||
| Technology Manufacturing | 1 | $35B |
|
||
Price history
+3720.1% since first listed12 events — show timeline
- 2026-05-12 Pending — Stellar MLS as Distributed by MLS Grid
- 2026-04-16 Relisted — Stellar MLS as Distributed by MLS Grid
- 2026-04-16 Price Changed $339,990 Stellar MLS as Distributed by MLS Grid
- 2026-04-16 Listing Removed — Stellar MLS as Distributed by MLS Grid
- 2026-04-15 Listed $339,990 Stellar MLS as Distributed by MLS Grid
- 2026-03-25 Listing Removed — Stellar MLS as Distributed by MLS Grid
- 2026-01-21 Price Changed $364,900 Stellar MLS as Distributed by MLS Grid
- 2025-12-15 Listed $369,900 Stellar MLS as Distributed by MLS Grid
- 2024-07-31 Sold (Public Records) $15,000 Public Records
- 2022-07-28 Listed $21,000 Stellar MLS as Distributed by MLS Grid
- 2015-12-16 Listed $4,900 Stellar MLS as Distributed by MLS Grid
- 2015-09-17 Sold (Public Records) $8,900 Public Records
Property tax history
+8.8%/yrLatest (2025): $694 · +10.0% YoY. Source: county tax records.
Cash-flow waterfall
monthlySold comps — $/sqft
last 12 mo · ≤1 miLoading sold comps…