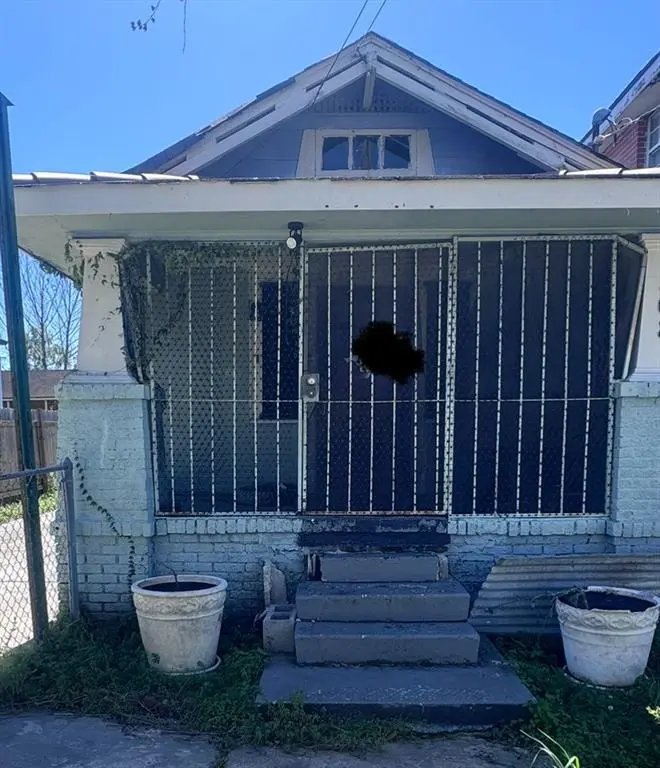
1868 N Galvez St · New Orleans, LA
Flood risk 8/10 · Major
- FEMA flood zone
- X (shaded)
- Chance of flooding over 30 yrs
- 0.6%
- Est. flood insurance / yr
- $507 – $1,088
Fire risk 1/10 · Minimal
- Est. fire insurance / yr
- $1,269 – $2,357
Heat risk 10/10 · Severe
- Hot days now (above 108°F)
- 7 days/yr
- Hot days in 30 yrs
- 21 days/yr
Wind risk 10/10 · Severe
- Chance of severe wind over 30 yrs
- 99.0%
Air-quality risk 4/10 · Minor
- Unhealthy air days now
- 4 days/yr
- Unhealthy air days in 30 yrs
- 4 days/yr
Risk factors via First Street. Map © Google.
Why this score? — see what drove the B+ grade
The composite is a weighted blend of 9 inputs, each scored 0–100. Each bar is that input's sub-score; the figure is the points it added to the 100-point composite (weight × sub-score).
- Cash flow +30.0/30.0
- ARV discount +15.0/15.0
- 1% rule +10.0/10.0
- DSCR +10.0/10.0
- Livability +4.0/5.0
- Rent growth +3.1/5.0
- Condition / age +2.5/5.0
- Schools +1.6/10.0
- Appreciation +0.0/10.0
$89,900
🖨 Deal sheet 📄 Offer letter ✓ Due diligence
Listing remarks MLS
Calling all investors ! this home in the Heart of the 7th wd is the perfect home to start your portfolio or add too! It needs some TLC But not a total renovation . Situated on a 168 ft deep lot It also has a detached structure that approx 600sqft , that can be a build out for another unit or a work shop ! With Soooo much to offer This Will Not Last Long! Bring All offers !
Key facts
- Detached structure
- 168 ft deep lot
- Work shop
Tags
Property features AI
Exterior
- Parking: Three or more parking spaces
- Utilities: Public water; Public sewer
- Home design: Single-story; Raised foundation; Average condition
- Construction: Brick construction; Shingle roof
- Exterior features: City lot; Oversized lot
Interior
- Bedrooms: Total of 5 rooms (bedroom count not specified)
- Bathrooms: 1 full bathroom; 1 half bathroom
- Heating & cooling: Heating present; Cooling present
- Interior features: Gas fireplace
Neighborhood map
What this means for you Summary
Snapshot
- This is a 3-bed/2.0-bath single-family listed at $90k.
Deal economics
- At list price, monthly cash flow is $597 ($7k/yr) — positive.
- The deal already cash-flows at list — no discount required.
- Meets the 1% rule at list price ($2k rent vs $90k).
- Recommended offer: $87k (3.0% below list) — sets the bar for market timing.
- Cap rate 15.2% vs local median 4.4% in New Orleans — top-decile yield for the area; either an underpriced asset or a hidden risk that comps aren't pricing in. Stress-test before assuming the spread holds.
Location & tenants
- Location reads 81/100 on livability (#3 in LA, #1,383 nationally) — a professional / high-income tenant draw. Strengths: amenities A+, commute A+, health & safety A+; Watch: crime C-, employment D.
- Orleans Parish (urban): math 11% / reading 27% proficiency, ranked #69 of 98 in LA (top 70%) — low school quality limits family demand, transient renter base, plan for 1-2y turnover; 68% free/reduced lunch — lower-income household profile, screen leases tightly.
- Market conditions: Rents rising (+2.5%/yr); 581 active listings in the ZIP; 40 comparable units currently listed for rent nearby; rentals at typical pace (median 20d on market — plan ~3-4 weeks tenant-placement turnaround); 710 units permitted in Orleans Parish in 2024 (244 in 5+ unit buildings).
- This rent runs 45% of the median local income ($46k/yr) — at the standard rent-burdened threshold; future hikes will face affordability resistance.
Forward outlook
- Local home prices are declining (-3.0%/yr); year-one equity from $622 of loan paydown is wiped out by about $3k of value loss. Plan a longer hold.
- Orleans County population projected at +61% by 2050 — long-run rental-demand tailwind backs the buy-and-hold thesis.
- At projected returns (-3.0% appreciation + 2.5% rent growth), your $25k cash investment doubles in ~5 years — after that, you're playing with house money.
Negotiation context
- It's been on market 47 days — a 3% lower offer ($87k) is reasonable based on typical stale-listing flexibility.
- 2 sale attempts with the ask held roughly flat each time — persistent listings suggest the price (not the market) is what's stuck; bring a comps-based counter.
- Current owner paid $28k; list at $90k implies a 221% gain — meaningful room to come down on a strong offer.
Risks & watch-outs
- Watch-outs: flood insurance adds $66/mo; built in 1940 — expect roof / HVAC / electrical / plumbing capex.
- Climate carrying-cost: severe flood risk; severe wind risk, 99% chance of damaging wind over 30y; extreme-heat days projected 7→21/yr by 2055 (HVAC capex compounding) — expect insurance premiums to compound above CPI over the hold.
Questions for the listing agent
- It's been on market 47 days. Have you received any prior offers? Is the seller open to a 3% concession, seller financing, or rate buy-down credit?
- Built in 1940 — when were the roof, HVAC, electrical panel, plumbing, and water heater last replaced?
- What's the actual annual flood-insurance premium (NFIP or private), and is the property in a SFHA with mandatory coverage?
- Is there a deadline driving the sale (1031 exchange, divorce, estate, relocation)? That informs how much negotiation room exists.
- What's the average days-on-market for RENTAL listings here right now (not sales)? A rising rental-DOM trend means longer vacancies and softer asking-rent achievability than the comps imply.
- What's the recent tenant-quality profile in this submarket — average credit score on applications, eviction rate, late-payment / NSF rate, and stable-employment percentage? A property-management company in the area should have these aggregated.
- How much new for-sale + rental construction is in the pipeline within 1–3 miles? Heavy new supply typically softens prices + rents 12–24 months out; constrained supply supports both.
Investment metrics
- 1% rule
- 1.90% ✓
- Cap rate
- 15.16%
- Cash-on-cash
- 31.65%
- DSCR
- 2.41
- GRM
- 4.4
CMA / ARV
- ARV (median comp)
- $166,714
- List price
- $89,900
- Delta
- -46.08%
- Verdict
- UNDERPRICED
- Comps
- 20 within 1.0 mi
Show comp detail 12 sales within ~0.75 mi
| Address | Dist | Beds/Ba | Sqft | Sold | Price | $/sf | Match |
|---|---|---|---|---|---|---|---|
| 1625 Frenchmen St | 0.43mi | 3/2.0 | 1,252 (-1%) | 5mo | $170,000 | $136 | 75 |
| 2531 Aubry St | 0.57mi | 3/2.0 | 1,231 (-2%) | 0mo | $270,000 | $219 | 70 |
| 1520 N Dorgenois St | 0.65mi | 3/1.0 | 1,258 (-0%) | 1mo | $179,000 | $142 | 64 |
| 1230 Annette St | 0.64mi | 3/2.0 | 1,309 (+4%) | 2mo | $280,000 | $214 | 62 |
| 1311 Frenchmen St | 0.61mi | 3/2.0 | 1,300 (+3%) | 7mo | $225,000 | $173 | 60 |
| 1735 Touro St | 0.32mi | 4/2.5 (+1) | 1,368 (+9%) | 6mo | $186,000 | $136 | 58 |
| 1609 Marais St | 0.60mi | 3/2.0 | 1,345 (+7%) | 4mo | $245,000 | $182 | 57 |
| 1561 N Broad St | 0.72mi | 2/2.0 (-1) | 1,302 (+3%) | 2mo | $348,000 | $267 | 54 |
| 1744 Duels St | 0.56mi | 3/1.0 | 1,141 (-9%) | 1mo | $138,000 | $121 | 54 |
| 2227 D'abadie St | 0.36mi | 3/2.0 | 1,080 (-14%) | 7mo | $215,000 | $199 | 54 |
| 1539 N Broad St | 0.75mi | 2/1.0 (-1) | 1,222 (-3%) | 3mo | $177,500 | $145 | 49 |
| 1601 Mandeville St | 0.63mi | 3/1.0 | 1,118 (-11%) | 2mo | $155,000 | $139 | 46 |
Match score weights: distance 35% · size 25% · config 20% · recency 20%. Top-matched comps best support the ARV.
Projected returns pro-forma
-3.0% appreciation · 2.49% rent growth · sell at horizon
- IRR
- 22.2%
- Equity multiple
- 1.90×
- Total profit
- $22,720
- Equity at exit
- $13,404
- IRR
- 29.9%
- Equity multiple
- 3.61×
- Total profit
- $65,673
- Equity at exit
- $7,773
Cash invested: $25,172 (down + closing). Projections, not guarantees.
Landlord ↔ Tenant lean methodology
- Overall (STATE)
- 90 Strongly Landlord-Friendly
- State Louisiana
- 90 Strongly Landlord-Friendly · R+12
- County
- — inherits STATE
- City
- — inherits STATE
ZIP-level market 70117
- Rents YoY
- 2.5%
- Active inventory
- 581
- Price-to-rent
- 4.4×
Monthly cashflow live
- Estimated rent
- $1,707 high interval (Pro) →
- Mortgage (P&I)
- −$471
- Tax from tax record
- −$176 /mo · $2,111/yr
- Insurance
- −$37
- Flood insurance flood zone
- −$66 /mo · $798/yr
- HOA
- −$0
- Vacancy / Maint / Mgmt
- −$359
- Net cashflow
- $597
Break-even live
UW: 25.0% down · 7.5% · 30yr · 1.5% tax · 5.0% vac · 8.0% maint · 8.0% mgmt
Financing live
Cash to close
- Down payment
- $22,475
- Closing costs
- $2,697
- Reserves months
- —
- Total cash needed
- —
Loan-product check · same deal, 3 products live
Conventional
25% down · 7.5% · 30yr
- Down + closing
- —
- Monthly P&I
- —
- Monthly cashflow
- —
- DSCR
- —
- Eligible?
- —
Personal DTI + credit; lowest rate.
DSCR
20% down · 8.5% · 30yr
- Down + closing
- —
- Monthly P&I
- —
- Monthly cashflow
- —
- DSCR
- —
- Eligible?
- —
No personal income docs; deal must DSCR.
Hard money
10% down · 12.0% · 12mo
- Down + closing
- —
- Monthly P&I
- —
- Monthly cashflow
- —
- DSCR
- —
- Eligible?
- —
Short-term bridge; refi at stabilization.
Rent comps 40 comps
| Address | Beds | Baths | Sqft | Rent | $/sqft | DOM | Units | Dist |
|---|---|---|---|---|---|---|---|---|
| 1938 N Johnson St Unit 38 New Orleans, LA | 3.0 | 2.0 | 1844 | $2,400 | $1.30 | 23d | 1 | 0.11mi |
| 1936 N Johnson St Unit 36 New Orleans, LA | 3.0 | 2.0 | 1844 | $2,400 | $1.30 | 23d | 1 | 0.11mi |
| 2109 A P Tureaud Ave New Orleans, LA | 2.0 | 1.0 | 936 | $1,450 | $1.55 | 14d | 1 | 0.17mi |
| 2239 Saint Anthony St New Orleans, LA | 2.0 | 1.0 | 900 | $1,100 | $1.22 | 23d | 1 | 0.19mi |
| 1811 New Orleans St New Orleans, LA | 2.0 | 2.0 | 900 | $1,700 | $1.89 | 3d | 1 | 0.19mi |
| 2311 Saint Anthony St Unit 1A New Orleans, LA | 2.0 | 1.0 | 1100 | $1,450 | $1.32 | 23d | 1 | 0.22mi |
| 1730 Allen St New Orleans, LA | 2.0 | 1.0 | 920 | $1,650 | $1.79 | 23d | 1 | 0.22mi |
| 2338 Annette St Unit 1 New Orleans, LA | 3.0 | 1.0 | 1150 | $1,400 | $1.22 | 19d | 1 | 0.22mi |
| 3110 Pauger St New Orleans, LA | 2.0 | 2.0 | 992 | $1,300 | $1.31 | 23d | 1 | 0.29mi |
| 1910 Elysian Fields Ave New Orleans, LA | 3.0 | 1.0 | 1000 | $1,450 | $1.45 | 23d | 1 | 0.37mi |
| 1735 N Tonti St New Orleans, LA | 3.0 | 1.0 | 1197 | $1,650 | $1.38 | 23d | 1 | 0.37mi |
| 2115 Elysian Fields Ave Unit 2115 New Orleans, LA | 3.0 | 1.0 | 1100 | $1,450 | $1.32 | 23d | 1 | 0.41mi |
| 2107 Elysian Fields Ave New Orleans, LA | 4.0 | 2.0 | 1794 | $1,650 | $0.92 | 3d | 1 | 0.41mi |
| 1434 Annette St New Orleans, LA | 2.0 | 1.0 | 1536 | $1,700 | $1.11 | 3d | 1 | 0.41mi |
| 1434 Annette St New Orleans, LA | 2.0 | 1.0 | 1536 | $1,700 | $1.11 | 3d | 1 | 0.41mi |
| 1996 Hope St New Orleans, LA | 3.0 | 1.0 | 910 | $1,550 | $1.70 | 3d | 1 | 0.43mi |
| 1923 N Robertson St New Orleans, LA | 3.0 | 2.0 | 1051 | $1,950 | $1.86 | 3d | 1 | 0.44mi |
| 2220 N Prieur St New Orleans, LA | 3.0 | 2.0 | 1334 | $2,000 | $1.50 | 23d | 1 | 0.45mi |
| 1634 N Rocheblave St New Orleans, LA | 2.0 | 1.0 | 900 | $1,400 | $1.56 | 23d | 1 | 0.48mi |
| 2512 Elysian Fields Ave Unit 1 New Orleans, LA | 2.0 | 1.0 | 879 | $1,400 | $1.59 | 17d | 1 | 0.49mi |
| 1710 Marigny St New Orleans, LA | 3.0 | 2.0 | 1120 | $1,750 | $1.56 | 23d | 1 | 0.51mi |
| 2310 George Nick Connor Dr New Orleans, LA | 3.0 | 2.0 | 1050 | $1,600 | $1.52 | 23d | 1 | 0.51mi |
| 2024 Mandeville St New Orleans, LA | 2.0 | 2.0 | 1072 | $1,950 | $1.82 | 23d | 1 | 0.52mi |
| 1472 N Claiborne Ave New Orleans, LA | 3.0 | 1.0 | 1312 | $1,900 | $1.45 | 16d | 1 | 0.54mi |
| 2115 Mandeville St New Orleans, LA | 3.0 | 2.0 | 1400 | $1,650 | $1.18 | 23d | 1 | 0.55mi |
| 2329 Laharpe St New Orleans, LA | 3.0 | 1.0 | 1250 | $1,000 | $0.80 | 19d | 1 | 0.55mi |
| 2817 Annette St New Orleans, LA | 3.0 | 1.0 | 1100 | $1,350 | $1.23 | 23d | 1 | 0.55mi |
| 1726 Mandeville St New Orleans, LA | 2.0 | 1.0 | 920 | $1,300 | $1.41 | 23d | 1 | 0.56mi |
| 1922 Industry St Unit B New Orleans, LA | 2.0 | 2.0 | 963 | $1,325 | $1.38 | 2d | 1 | 0.57mi |
| 2269 N Derbigny St New Orleans, LA | 2.0 | 2.0 | 1000 | $1,665 | $1.67 | 17d | 1 | 0.57mi |
| 2269 N Derbigny St New Orleans, LA | 2.0 | 2.0 | 1000 | $1,675 | $1.68 | 19d | 1 | 0.57mi |
| 2525 D'Abadie St New Orleans, LA | 2.0 | 1.0 | 960 | $1,400 | $1.46 | 19d | 1 | 0.57mi |
| 2525 D'Abadie St Unit 2525 New Orleans, LA | 2.0 | 1.0 | 1000 | $1,500 | $1.50 | 19d | 1 | 0.57mi |
| 2271 N Derbigny St New Orleans, LA | 2.0 | 2.0 | 1000 | $1,585 | $1.58 | 17d | 1 | 0.57mi |
| 1820 Kerlerec St New Orleans, LA | 2.0 | 1.0 | 950 | $1,600 | $1.68 | 17d | 1 | 0.57mi |
| 1435 N Derbigny St New Orleans, LA | 2.0 | 2.0 | 1040 | $1,600 | $1.54 | 23d | 1 | 0.57mi |
| 1601 Marigny St Unit 1603 New Orleans, LA | 3.0 | 2.0 | 988 | $1,099 | $1.11 | 3d | 1 | 0.58mi |
| 1603 Marigny St New Orleans, LA | 3.0 | 2.0 | 988 | $1,099 | $1.11 | 3d | 1 | 0.58mi |
| 2048 Florida Ave New Orleans, LA | 2.0 | 1.0 | 1200 | $2,000 | $1.67 | 17d | 1 | 0.58mi |
| 1327 Frenchmen St Unit B New Orleans, LA | 2.0 | 2.5 | 1175 | $1,900 | $1.62 | 23d | 1 | 0.59mi |
Listing history 17 events
-
2026-06-18days on market $89,900 Active 47 DOM
-
2026-06-17days on market $89,900 Active 46 DOM
-
2026-06-16days on market $89,900 Active 45 DOM
-
2026-06-15days on market $89,900 Active 44 DOM
-
2026-06-13days on market $89,900 Active 42 DOM
-
2026-06-10days on market $89,900 Active 39 DOM
-
2026-06-09days on market $89,900 Active 38 DOM
-
2026-06-08days on market $89,900 Active 37 DOM
-
2026-06-07days on market $89,900 Active 36 DOM
-
2026-06-05days on market $89,900 Active 33 DOM
-
2026-06-03days on market $89,900 Active 32 DOM
-
2026-06-02days on market $89,900 Active 31 DOM
-
2026-06-01days on market $89,900 Active 30 DOM
-
2026-05-31days on market $89,900 Active 29 DOM
-
2026-05-02$89,900 Active 385-char remark
Show marketing remark (375 chars)
Calling all investors ! this home in the Heart of the 7th wd is the perfect home to start your portfolio or add too! It needs some TLC But not a total renovation . Situated on a 168 ft deep lot It also has a detached structure that approx 600sqft , that can be a build out for another unit or a work shop ! With Soooo much to offer This Will Not Last Long! Bring All offers !
-
2026-05-02$89,900 Active 375-char remark
Show marketing remark (375 chars)
Calling all investors ! this home in the Heart of the 7th wd is the perfect home to start your portfolio or add too! It needs some TLC But not a total renovation . Situated on a 168 ft deep lot It also has a detached structure that approx 600sqft , that can be a build out for another unit or a work shop ! With Soooo much to offer This Will Not Last Long! Bring All offers !
-
1985-09-25soldstatus $28,000
ⓘ Source: listings_history table (triggers on properties + properties_extension) + one-shot
backfill from property_details.listing_events for pre-trigger history.
Tax reassessment forecast LA · Resets to sale price
- Current annual tax
- $2,111 · $176/mo
- Projected year-2 tax
- $2,111 · $176/mo
- Expected delta
- $0/yr ($0/mo · 0.0%)
ⓘ Screening estimate from a state-policy table — verify with the county assessor before closing.
Climate risk First Street
- Flood 8/10 Severe FEMA zone X (shaded) · 60% chance over 30 yrs
- Wildfire 1/10 Low
- Heat 10/10 Extreme 7 d/yr ≥108°F today · 21 d/yr by 30 yrs out
- Wind 10/10 Extreme 99% chance of damaging wind over 30 yrs
- Air quality 4/10 Moderate 4 unhealthy d/yr today · 4 by 30 yrs out
Nearby sold comps map
Loading sold comps map…
Walkable amenities ~0.75 mi
Loading nearby amenities…
Taxation est. · year 1
- Rental income
- $20,488
- − Mortgage interest
- −$5,036
- − Property taxes
- −$2,111
- − Insurance
- −$1,247
- − Repairs & maintenance
- −$1,639
- − Management
- −$1,639
- − Depreciation
- −$2,615
- Taxable income
- $6,200
- Est. tax owed @ 24.0%
- −$1,488
- After-tax cash flow
- $5,682/yr
For passive investors: Depreciation is non-cash, so a rental often shows a tax loss while cash-flowing — sheltering income. Rental losses are passive: they offset passive income freely, and up to $25,000/yr can offset ordinary (W-2) income if you actively participate and your MAGI is under $100k (phasing out to $0 by $150k); unused losses carry forward. On sale, claimed depreciation is recaptured at up to 25%, and gains may owe capital-gains tax (a 1031 exchange can defer both). Figures are a year-1 estimate at your 24.0% rate — not tax advice; consult a CPA.
Schools (NCES district)
- District
- Orleans Parish
- NCES district ID
- 2201170
- Math proficiency
- 11% ▼ -52.00%
- Reading proficiency
- 27% ▼ -46.00%
- Median HH income
- $37,011
- Composite
- 15.78/100
- National rank
- #9271
- State rank
- #69 of 98 in LA
Livability — New Orleans
- Score
- 81/100
- State rank
- #3
- US rank
- #1383
Category grades
Schools grade is shown separately in the Schools card above.
Census & demographics
- Census place
- New Orleans, LA
- County
- Orleans Parish · 338,817 people
- City population
- 338,817
- Metro
- New Orleans-Metairie, LA
- Population (ZIP)
- 25,652
- Household income
- $45,764
- Rent vs Own
- Severe rent burden
- 1988.0
Population outlook (Orleans County) Hauer SSP2
- Today (2025)
- 513,025 people
- By 2030
- 575,781 · +12.2%
- By 2040
- 700,174 · +36.5%
- By 2050
- 826,541 · +61.1%
- By 2075
- 1,123,374 · +119.0%
- By 2100
- 1,355,609 · +164.2%
Race, ethnicity, and origin ACS 2023
- Neighborhood character
- Majority Black (60%)
- Race & ethnicity
- Black 60% White 30% Two or more races 6% Hispanic / Latino 5%
- Common ancestry
- Lithuanian 5% Italian 1% Romanian 1%
- Foreign-born
- 5% · Canada, South Korea
- Languages at home
- 93% English-only · Spanish 3% Other Indo-European 1% French/Haitian/Cajun 1%
Political lean MEDSL · Orleans
- 2024 margin
- Solid D (+67.0) · D 82.2% · R 15.2% · Other 2.7%
- 2008→2024 swing
- +6.7pp toward D · 2008: 60.3pp · 2024: 67.0pp
- All cycles
- 2024: D+67.0 2020: D+68.2 2016: D+66.2 2012: D+62.5 2008: D+60.3
Not yet ingested
- Civics
- —
Market trends
- HPI YoY
- ▼ -177.22%
- Current HPI
- 184.6061
- Rent YoY
- ▲ 2.49%
- Metro
- New Orleans-Metairie, LA
- State GDP YoY
- ▲ 3.29%
- F500 in state
- 10
Industry mix (Fortune 500 HQ in LA)
| Industry | F500 HQs | Revenue |
|---|---|---|
| Telecommunications | 2 | $23B |
|
||
| Utilities | 1 | $12B |
|
||
| Wholesale / Distribution | 1 | $5B |
|
||
| Advertising | 1 | $2B |
|
||
Price history
+221.1% since first listed3 events — show timeline
- 2026-05-02 Listed $89,900 AcadianaMLS
- 2026-05-02 Listed $89,900 GSREIN
- 1985-09-25 Sold (Public Records) $28,000 Public Records
Property tax history
+6.7%/yrLatest (2026): $2,111 · +1.0% YoY. Source: county tax records.
Cash-flow waterfall
monthlySold comps — $/sqft
last 12 mo · ≤1 miLoading sold comps…