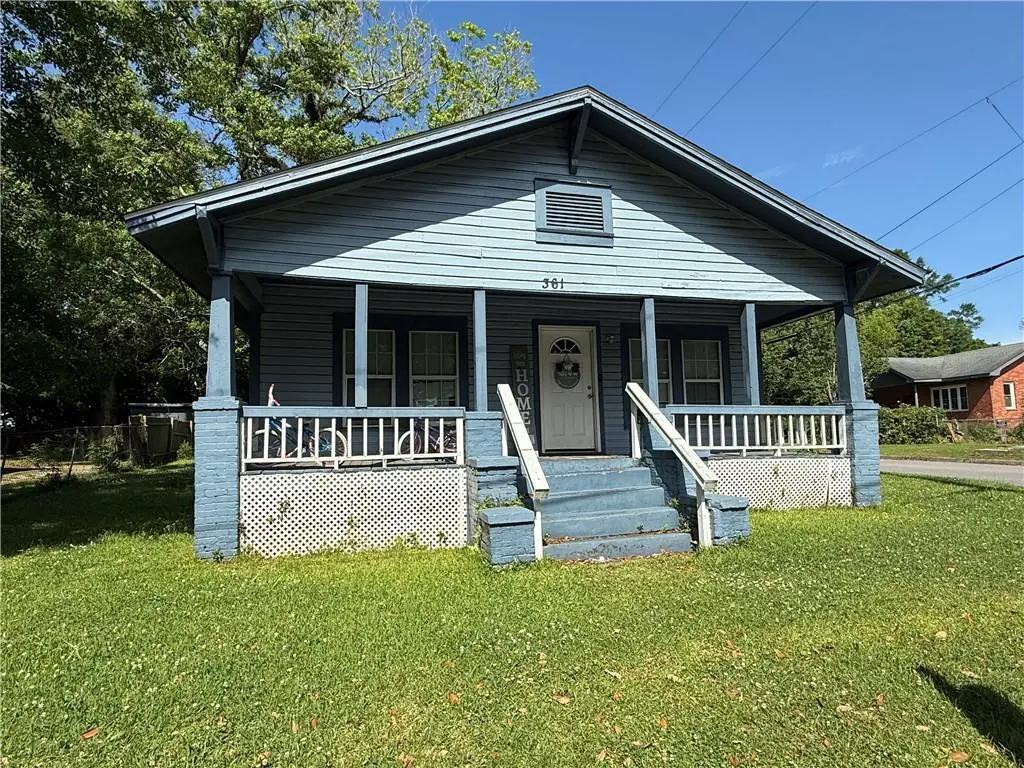
361 Fredonia St · Mobile, AL
Flood risk 1/10 · Minimal
- FEMA flood zone
- X (unshaded)
- Chance of flooding over 30 yrs
- 0.0%
- Est. flood insurance / yr
- $507 – $1,088
Fire risk 2/10 · Minimal
- Est. fire insurance / yr
- $916 – $1,700
Heat risk 9/10 · Severe
- Hot days now (above 104°F)
- 7 days/yr
- Hot days in 30 yrs
- 21 days/yr
Wind risk 9/10 · Severe
- Chance of severe wind over 30 yrs
- 99.0%
Air-quality risk 2/10 · Minimal
- Unhealthy air days now
- 1 days/yr
- Unhealthy air days in 30 yrs
- 1 days/yr
Risk factors via First Street. Map © Google.
Why this score? — see what drove the B+ grade
The composite is a weighted blend of 9 inputs, each scored 0–100. Each bar is that input's sub-score; the figure is the points it added to the 100-point composite (weight × sub-score).
- Cash flow +30.0/30.0
- ARV discount +15.0/15.0
- 1% rule +10.0/10.0
- DSCR +10.0/10.0
- Livability +3.8/5.0
- Rent growth +2.5/5.0
- Condition / age +2.5/5.0
- Schools +2.3/10.0
- Appreciation +0.0/10.0
$79,900
🖨 Deal sheet (PDF) 📄 Offer letter ✓ Due diligence
Listing remarks MLS
Great investment opportunity! This 3/1 home is situated on a corner lot and conveniently located near shopping, parks, and interstate 65. Currently leased for $1100 a month! This home has hardwood floors throughout most of the home with vinyl plank flooring in kitchen and bathroom. The kitchen comes with appliances, ample cabinet and countertop space, and features granite counter tops. You have a nice size covered front porch as well as rear entrance and parking off Elsmore St. Property sold "as is, where is" with no warranties expressed or implied.
Key facts
- Covered front porch
- Rear entrance
- Granite counter tops
Tags
Neighborhood map
What this means for you Summary
Snapshot
- This is a ?-bed/1.0-bath single-family listed at $80k.
Deal economics
- At list price, monthly cash flow is $501 ($6k/yr) — positive.
- The deal already cash-flows at list — no discount required.
- Meets the 1% rule at list price ($1k rent vs $80k).
- Recommended offer: $70k (12.0% below list) — sets the bar for market timing.
- Cap rate 13.8% vs local median 4.9% in Mobile — top-decile yield for the area; either an underpriced asset or a hidden risk that comps aren't pricing in. Stress-test before assuming the spread holds.
Location & tenants
- Location reads 75/100 on livability (#20 in AL, #4,262 nationally) — a middle-class / working-renter tenant base. Strengths: commute A+, cost of living A+, housing A+; Watch: crime F, employment D-.
- Mobile County (urban): math 15% / reading 39% proficiency, ranked #81 of 129 in AL (top 63%) — low school quality limits family demand, transient renter base, plan for 1-2y turnover; 67% free/reduced lunch — lower-income household profile, screen leases tightly.
- Zoned schools: Holloway Elementary (math 5% / reading 19%, grade F, #554 of 627 statewide, top 88%, 498 students, 98% FRL); Cl Scarborough Model Middle School (math 4% / reading 21%, grade F, #216 of 257 statewide, top 86%, 651 students, 94% FRL); John L Leflore Magnet School (math 2% / reading 2%, grade F, #291 of 305 statewide, top 100%, 618 students, 84% FRL) — zoned schools average 92% FRL vs 67% district-wide (24 pts higher); higher-poverty schools than district average — tighter screening recommended.
- Zoned-school proficiency averages 9% at this address vs 27% district-wide (-18 pts) — the specific schools serving this property underperform the Mobile County average; the district grade overstates school quality for this exact location.
- Market conditions: 45 active listings in the ZIP; 28 comparable units currently listed for rent nearby; rentals at typical pace (median 23d on market — plan ~3-4 weeks tenant-placement turnaround); 1,678 units permitted in Mobile County in 2024 (264 in 5+ unit buildings).
Forward outlook
- Local home prices are declining (-3.0%/yr); year-one equity from $552 of loan paydown is wiped out by about $2k of value loss. Plan a longer hold.
- Mobile County population projected to shrink 8% by 2050 — rents likely to lag national; underwrite the cash flow, not the appreciation.
- At projected returns (-3.0% appreciation + 3.0% rent growth), your $22k cash investment doubles in ~5 years — after that, you're playing with house money.
Negotiation context
- It's been on market 208 days — a 12% lower offer ($70k) is reasonable based on typical stale-listing flexibility.
- Current owner paid $69k; 16% above their basis — modest negotiation headroom, anchor on the comps not their cost.
Risks & watch-outs
- Climate carrying-cost: severe wind risk, 99% chance of damaging wind over 30y; extreme-heat days projected 7→21/yr by 2055 (HVAC capex compounding) — expect insurance premiums to compound above CPI over the hold.
Questions for the listing agent
- It's been on market 208 days. Have you received any prior offers? Is the seller open to a 12% concession, seller financing, or rate buy-down credit?
- Built in 1976 — when were the roof, HVAC, electrical panel, plumbing, and water heater last replaced?
- Why hasn't it sold? Are there any deal-killer items the seller is aware of (foundation, flood, title, zoning, code violations)?
- Is there a deadline driving the sale (1031 exchange, divorce, estate, relocation)? That informs how much negotiation room exists.
- Schools are D-rated, which usually means shorter tenancies and higher turnover. Who's the typical renter profile here, and what's been the actual vacancy rate?
- Crime grade is F in this area — have there been break-ins, vandalism, or insurance claims at this property in the last 3 years? What carrier currently insures it and at what premium?
- What's the average days-on-market for RENTAL listings here right now (not sales)? A rising rental-DOM trend means longer vacancies and softer asking-rent achievability than the comps imply.
- What's the recent tenant-quality profile in this submarket — average credit score on applications, eviction rate, late-payment / NSF rate, and stable-employment percentage? A property-management company in the area should have these aggregated.
- How much new for-sale + rental construction is in the pipeline within 1–3 miles? Heavy new supply typically softens prices + rents 12–24 months out; constrained supply supports both.
Investment metrics
- 1% rule
- 1.54% ✓
- Cap rate
- 13.82%
- Cash-on-cash
- 26.90%
- DSCR
- 2.20
- GRM
- 5.4
CMA / ARV
- ARV (median comp)
- $104,335
- List price
- $79,900
- Delta
- -23.42%
- Verdict
- UNDERPRICED
- Comps
- 20 within 1.0 mi
Show comp detail 12 sales within ~0.75 mi
| Address | Dist | Beds/Ba | Sqft | Sold | Price | $/sf | Match |
|---|---|---|---|---|---|---|---|
| 2810 Pages Ln | 0.24mi | 3/2.0 | 1,212 (-3%) | 11mo | $168,500 | $139 | 71 |
| 413 Bay Shore Ave | 0.19mi | 4/2.0 | 1,300 (+4%) | 12mo | $183,000 | $141 | 70 |
| 134 Hyland Ave | 0.47mi | 2/2.0 | 1,272 (+2%) | 2mo | $227,500 | $179 | 69 |
| 415 Bay Shore Ave | 0.20mi | 3/2.0 | 1,300 (+4%) | 13mo | $184,900 | $142 | 68 |
| 2710 Betbeze St | 0.18mi | 3/2.0 | 1,100 (-12%) | 3mo | $110,000 | $100 | 66 |
| 2647 Weems Dr | 0.19mi | 3/2.0 | 1,124 (-10%) | 7mo | $175,000 | $156 | 65 |
| 2959 Nall St | 0.51mi | 3/2.0 | 1,294 (+4%) | 1mo | $190,000 | $147 | 65 |
| 2507 Myrtle St | 0.55mi | 2/1.0 | 1,150 (-8%) | 4mo | $169,500 | $147 | 58 |
| 2666 Betbeze St | 0.22mi | 4/2.0 | 1,429 (+15%) | 5mo | $19,900 | $14 | 57 |
| 292 Siena Vis | 0.26mi | 3/2.0 | 1,416 (+14%) | 10mo | $169,000 | $119 | 52 |
| 81 Lefevre St | 0.72mi | 4/1.0 | 1,207 (-3%) | 12mo | $85,000 | $70 | 52 |
| 2304 Rushing Dr | 0.69mi | 3/1.0 | 1,092 (-12%) | 4mo | $65,000 | $60 | 44 |
Match score weights: distance 35% · size 25% · config 20% · recency 20%. Top-matched comps best support the ARV.
Projected returns pro-forma
-3.0% appreciation · 3.0% rent growth · sell at horizon
- IRR
- 20.8%
- Equity multiple
- 1.85×
- Total profit
- $18,959
- Equity at exit
- $11,913
- IRR
- 28.9%
- Equity multiple
- 3.57×
- Total profit
- $57,512
- Equity at exit
- $6,908
Cash invested: $22,372 (down + closing). Projections, not guarantees.
Landlord ↔ Tenant lean methodology
- Overall (STATE)
- 90 Strongly Landlord-Friendly
- State Alabama
- 90 Strongly Landlord-Friendly · R+15
- County
- — inherits STATE
- City
- — inherits STATE
ZIP-level market 36607
- Active inventory
- 45
- Price-to-rent
- 5.4×
Monthly cashflow live
- Estimated rent
- $1,234 high interval (Pro) →
- Mortgage (P&I)
- −$419
- Tax from tax record
- −$21 /mo · $254/yr
- Insurance
- −$33
- HOA
- −$0
- Vacancy / Maint / Mgmt
- −$259
- Net cashflow
- $501
Break-even live
Sensitivity live
| Price | -10% $547 | -5% $524 | +0% $501 | +5% $479 | +10% $456 |
|---|---|---|---|---|---|
| Rent | -10% $404 | -5% $453 | +0% $501 | +5% $550 | +10% $599 |
| Rate | -1.0pp $542 | -0.5pp $522 | base $501 | +0.5pp $481 | +1.0pp $460 |
UW: 25.0% down · 7.5% · 30yr · 1.5% tax · 5.0% vac · 8.0% maint · 8.0% mgmt
Financing live
Cash to close
- Down payment
- $19,975
- Closing costs
- $2,397
- Reserves months
- —
- Total cash needed
- —
Loan-product check · same deal, 3 products live
Conventional
25% down · 7.5% · 30yr
- Down + closing
- —
- Monthly P&I
- —
- Monthly cashflow
- —
- DSCR
- —
- Eligible?
- —
Personal DTI + credit; lowest rate.
DSCR
20% down · 8.5% · 30yr
- Down + closing
- —
- Monthly P&I
- —
- Monthly cashflow
- —
- DSCR
- —
- Eligible?
- —
No personal income docs; deal must DSCR.
Hard money
10% down · 12.0% · 12mo
- Down + closing
- —
- Monthly P&I
- —
- Monthly cashflow
- —
- DSCR
- —
- Eligible?
- —
Short-term bridge; refi at stabilization.
Rent comps 28 comps
| Address | Beds | Baths | Sqft | Rent | $/sqft | DOM | Units | Dist |
|---|---|---|---|---|---|---|---|---|
| 2850 Edgewood St Mobile, AL | 2.0 | 1.0 | 816 | $1,000 | $1.23 | 23d | 1 | 0.31mi |
| 2853 Josephine St Mobile, AL | 2.0 | 1.0 | 780 | $975 | $1.25 | 23d | 1 | 0.38mi |
| 113 Randolph St Unit 1 Mobile, AL | 1.0 | 1.0 | 800 | $958 | $1.20 | 23d | 1 | 0.46mi |
| 156 Hemley Ave Mobile, AL | 3.0 | 1.0 | 936 | $1,195 | $1.28 | 46d | 1 | 0.52mi |
| 423 Devon Dr Mobile, AL | 3.0 | 1.0 | 1220 | $950 | $0.78 | 46d | 1 | 0.72mi |
| 55 Macks St Mobile, AL | 2.0 | 1.0 | 848 | $945 | $1.11 | 23d | 1 | 0.77mi |
| 672 Burden St Mobile, AL | 3.0 | 1.5 | 1421 | $1,300 | $0.91 | 23d | 1 | 0.79mi |
| 107 Grand Blvd Mobile, AL | 2.0 | 2.0 | 1200 | $1,295 | $1.08 | 23d | 1 | 0.86mi |
| 2604 Dauphin St #210 Mobile, AL | 2.0 | 1.0 | 950 | $1,150 | $1.21 | 23d | 1 | 0.88mi |
| 2604 Dauphin St Mobile, AL | 2.0 | 1.0 | 950 | $1,072 | $1.13 | 46d | 2 | 0.88mi |
| 708 Bond St Mobile, AL | 3.0 | 1.0 | 1100 | $1,350 | $1.23 | 23d | 1 | 0.89mi |
| 2500 Dauphinwood Dr Mobile, AL | 2.0–3.0 | 1.0–2.0 | 1250 | $980 | $0.78 | 15d | 19 | 0.90mi |
| 186 Stanton Rd Mobile, AL | 1.0–3.0 | 1.0–2.5 | 1263 | $2,062 | $1.63 | 46d | 1 | 1.07mi |
| 2966 Northwest Dr Mobile, AL | 3.0 | 1.0 | 792 | $895 | $1.13 | 23d | 1 | 1.10mi |
| 510 Schwartz St Mobile, AL | 3.0 | 2.0 | 1288 | $1,400 | $1.09 | 15d | 1 | 1.14mi |
| 150 Dunn Ave Mobile, AL | 3.0 | 2.0 | 1455 | $1,250 | $0.86 | 23d | 1 | 1.30mi |
| 305 Indian Creek Dr E Unit 1043809P Mobile, AL | 3.0 | 2.5 | 1496 | $3,985 | $2.66 | 15d | 1 | 1.31mi |
| 104 Ellinor St Mobile, AL | 2.0 | 1.0 | 896 | $1,275 | $1.42 | 23d | 1 | 1.32mi |
| 3655 Old Shell Rd Unit 3655 Mobile, AL | 2.0 | 2.0 | 1200 | $1,850 | $1.54 | 15d | 1 | 1.37mi |
| 168 W Collins St Mobile, AL | 3.0 | 1.0 | 968 | $725 | $0.75 | 23d | 1 | 1.37mi |
| 2500 Taylor Ave Mobile, AL | 2.0 | 1.0 | 840 | $1,195 | $1.42 | 46d | 1 | 1.38mi |
| 2507 Taylor Ave Mobile, AL | 3.0 | 1.0 | 1230 | $1,495 | $1.22 | 15d | 1 | 1.39mi |
| 200 S Florida St Unit 101 Mobile, AL | 2.0 | 2.0 | 1150 | $1,375 | $1.20 | 23d | 1 | 1.42mi |
| 3060 Emogene St Mobile, AL | 3.0 | 1.0 | 1200 | $1,400 | $1.17 | 15d | 1 | 1.44mi |
| 2503 Richard Ave Mobile, AL | 2.0 | 1.0 | 928 | $805 | $0.87 | 15d | 1 | 1.45mi |
| 2855 Potter Dr Mobile, AL | 2.0 | 1.0 | 1127 | $1,050 | $0.93 | 46d | 1 | 1.46mi |
| 151 Du Rhu Dr Mobile, AL | 1.0–3.0 | 1.0–2.0 | 1052 | $2,270 | $2.16 | 15d | 12 | 1.46mi |
| 2861 Potter Dr Unit 1043844P Mobile, AL | 3.0 | 2.0 | 1496 | $2,492 | $1.67 | 23d | 1 | 1.46mi |
Listing history 9 events
-
2026-05-31days on market $79,900 Active 208 DOM
-
2026-05-30days on market $79,900 Active 207 DOM
-
2025-11-04$79,900 Active 565-char remark
Show marketing remark (565 chars)
Great investment opportunity! This 3/1 home is situated on a corner lot and conveniently located near shopping, parks, and interstate 65. Currently leased for $1100 a month! This home has hardwood floors throughout most of the home with vinyl plank flooring in kitchen and bathroom. The kitchen comes with appliances, ample cabinet and countertop space, and features granite counter tops. You have a nice size covered front porch as well as rear entrance and parking off Elsmore St. Property sold "as is, where is" with no warranties expressed or implied.
-
2025-10-06price $79,900
-
2025-08-20price $84,900
-
2025-06-27price $89,900
-
2025-05-29price $94,900
-
2022-09-07soldstatus $69,000
-
2022-08-29soldstatus $69,000
ⓘ Source: listings_history table (triggers on properties + properties_extension) + one-shot
backfill from property_details.listing_events for pre-trigger history.
Tax reassessment forecast AL · Resets to sale price
- Current annual tax
- $254 · $21/mo
- Projected year-2 tax
- $328 · $27/mo
- Expected delta
- +$74/yr (+$6/mo · 29.0%)
ⓘ Screening estimate from a state-policy table — verify with the county assessor before closing.
Climate risk First Street
- Flood 1/10 Low FEMA zone X (unshaded) · 0% chance over 30 yrs
- Wildfire 2/10 Low
- Heat 9/10 Extreme 7 d/yr ≥104°F today · 21 d/yr by 30 yrs out
- Wind 9/10 Extreme 99% chance of damaging wind over 30 yrs
- Air quality 2/10 Low 1 unhealthy d/yr today · 1 by 30 yrs out
Nearby sold comps map
Loading sold comps map…
Walkable amenities ~0.75 mi
Loading nearby amenities…
Taxation est. · year 1
- Rental income
- $14,808
- − Mortgage interest
- −$4,476
- − Property taxes
- −$254
- − Insurance
- −$400
- − Repairs & maintenance
- −$1,185
- − Management
- −$1,185
- − Depreciation
- −$2,324
- Taxable income
- $4,986
- Est. tax owed @ 24.0%
- −$1,197
- After-tax cash flow
- $4,821/yr
For passive investors: Depreciation is non-cash, so a rental often shows a tax loss while cash-flowing — sheltering income. Rental losses are passive: they offset passive income freely, and up to $25,000/yr can offset ordinary (W-2) income if you actively participate and your MAGI is under $100k (phasing out to $0 by $150k); unused losses carry forward. On sale, claimed depreciation is recaptured at up to 25%, and gains may owe capital-gains tax (a 1031 exchange can defer both). Figures are a year-1 estimate at your 24.0% rate — not tax advice; consult a CPA.
Schools (NCES district)
- District
- Mobile County
- NCES district ID
- 0102370
- Math proficiency
- 15% ▼ -28.00%
- Reading proficiency
- 39% ▬ 0.00%
- Median HH income
- $42,455
- Composite
- 22.9/100
- National rank
- #8002
- State rank
- #81 of 129 in AL
Livability — Mobile
- Score
- 75/100
- State rank
- #20
- US rank
- #4262
Category grades
Schools grade is shown separately in the Schools card above.
Census & demographics
- Census place
- Mobile, AL
- City population
- 205,729
- Population (ZIP)
- 5,529
Population outlook (Mobile County) Hauer SSP2
- Today (2025)
- 415,303 people
- By 2030
- 411,755 · -0.9%
- By 2040
- 399,670 · -3.8%
- By 2050
- 382,616 · -7.9%
- By 2075
- 337,353 · -18.8%
- By 2100
- 283,391 · -31.8%
Race, ethnicity, and origin ACS 2023
- Neighborhood character
- Majority Black (56%)
- Race & ethnicity
- Black 56% White 40% Two or more races 3%
- Common ancestry
- Slovak 4% Lithuanian 2% Scotch-Irish 1%
- Foreign-born
- 1%
Political lean MEDSL · Mobile
- 2024 margin
- R (+16.4) · D 41.3% · R 57.7%
- 2008→2024 swing
- -7.7pp toward R · 2008: -8.7pp · 2024: -16.4pp
- All cycles
- 2024: R+16.4 2020: R+11.9 2016: R+13.9 2012: R+9.3 2008: R+8.7
Not yet ingested
- Civics
- —
Market trends
- HPI YoY
- ▼ -155.04%
- Current HPI
- 127.0483
- Rent YoY
- —
- Metro
- —
- State GDP YoY
- ▲ 2.94%
- F500 in state
- 4
Industry mix (Fortune 500 HQ in AL)
| Industry | F500 HQs | Revenue |
|---|---|---|
| Financial Services | 1 | $8B |
|
||
| Healthcare | 1 | $5B |
|
||
Price history
+15.8% since first listed7 events — show timeline
- 2025-11-04 Listed $79,900 GCMLS AL
- 2025-10-06 Price Changed $79,900 GCMLS AL
- 2025-08-20 Price Changed $84,900 GCMLS AL
- 2025-06-27 Price Changed $89,900 GCMLS AL
- 2025-05-29 Price Changed $94,900 GCMLS AL
- 2022-09-07 Sold (Public Records) $69,000 Public Records
- 2022-08-29 Sold (MLS) $69,000 GCMLS AL
Property tax history
+1.7%/yrLatest (2025): $254 · -2.0% YoY. Source: county tax records.
Cash-flow waterfall
monthlySold comps — $/sqft
last 12 mo · ≤1 miLoading sold comps…