212D Ewing Dr · Nashville-Davidson metropolitan government (balance), TN
Flood risk 1/10 · Minimal
- FEMA flood zone
- X (unshaded)
- Chance of flooding over 30 yrs
- 0.0%
- Est. flood insurance / yr
- $507 – $1,088
Fire risk 1/10 · Minimal
- Est. fire insurance / yr
- $949 – $1,763
Heat risk 6/10 · Moderate
- Hot days now (above 106°F)
- 7 days/yr
- Hot days in 30 yrs
- 21 days/yr
Wind risk 4/10 · Minor
- Chance of severe wind over 30 yrs
- 9.0%
Air-quality risk 2/10 · Minimal
- Unhealthy air days now
- 1 days/yr
- Unhealthy air days in 30 yrs
- 2 days/yr
Risk factors via First Street. Map © Google.
Why this score? — see what drove the D- grade
The composite is a weighted blend of 9 inputs, each scored 0–100. Each bar is that input's sub-score; the figure is the points it added to the 100-point composite (weight × sub-score).
- Cash flow +13.7/30.0
- ARV discount +7.5/15.0
- DSCR +4.1/10.0
- 1% rule +3.8/10.0
- Rent growth +2.8/5.0
- Condition / age +2.8/5.0
- Livability +2.5/5.0
- Schools +1.4/10.0
- Appreciation +0.0/10.0
$175,000
🖨 Deal sheet 📄 Offer letter ✓ Due diligence
Listing remarks
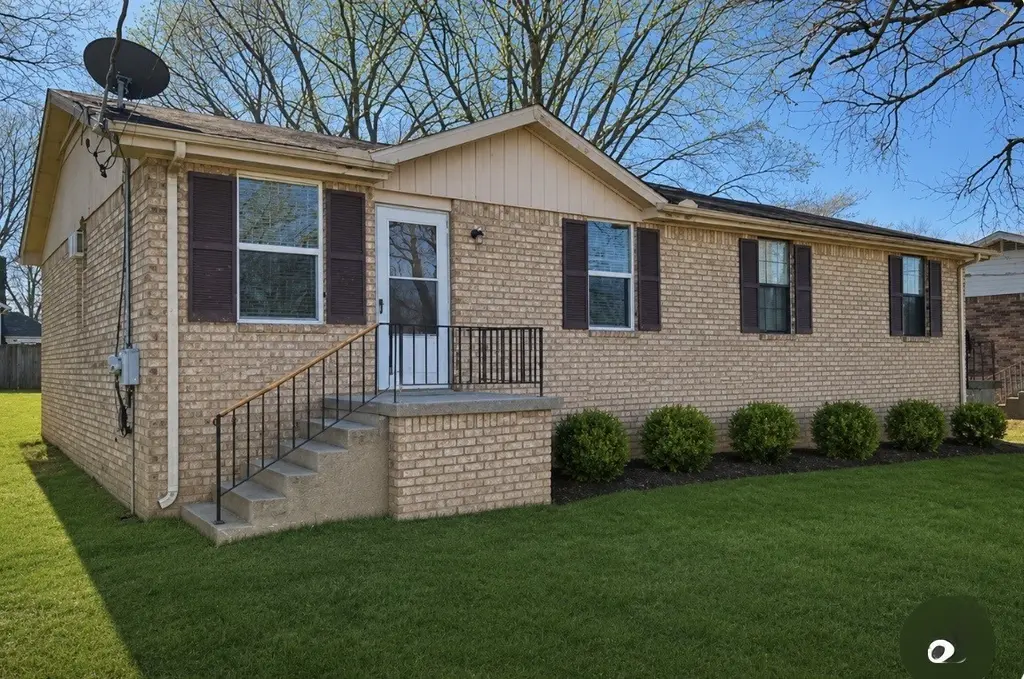
Welcome to this cozy 2 bedroom, 1 bath home featuring a practical floor plan and endless potential. Whether you’re searching for a starter home, investment property, or low-maintenance living, this home offers a great opportunity in a convenient location close to everyday amenities and commuter routes. Property is currently rented month -month for $1200. please DON'T DISTRIBUTE TENANT. showing is passed on accepted offers.
Key facts
- 7,405 sq ft lot
- Built 1984
- Listed 22 days
Property features AI
Finance
- Other: Living area reported as 783 square feet; Year built listed as existing
- Financial info: Tax information not included per instructions
- HOA & community: No HOA information provided
Exterior
- Parking: No covered parking reported; No total parking spaces reported
- Security: No security features reported
- Utilities: Public water; Public sewer
- Home design: Residential zero lot line property; One story
- Construction: Brick construction
- Exterior features: Lot approximately 0.17 acres (41 x 191); Water available
Interior
- Kitchen: Equipped with oven, range, dishwasher, and refrigerator
- Bedrooms: 2 bedrooms (both on the main level)
- Flooring: Carpet, Laminate, Tile, Vinyl
- Bathrooms: 1 full bathroom
- Heating & cooling: Central heating; Central air conditioning
- Interior features: Oven, Range, Dishwasher, Refrigerator
- Laundry & utility: Laundry details not provided
Neighborhood map
What this means for you Summary
Snapshot
- This is a 2-bed/1.0-bath single-family listed at $175k. Condition is rated average.
Deal economics
- At list price, monthly cash flow is $13 ($157/yr) — positive.
- The deal already cash-flows at list — no discount required.
- To meet the 1% rule (rent ≥ 1% of price), the offer needs to be $155k (11.6% below list).
- Recommended offer: $155k (11.6% below list) — sets the bar for 1% rule.
- Cap rate 6.4% vs local median 2.9% in Nashville-Davidson metropolitan government (balance) — top-decile yield for the area; either an underpriced asset or a hidden risk that comps aren't pricing in. Stress-test before assuming the spread holds.
Location & tenants
- Location reads: area grade D — affects rentability + tenant quality, not the cash-flow math above.
- Davidson County (urban): math 12% / reading 19% proficiency, ranked #126 of 139 in TN (top 91%) — low school quality limits family demand, transient renter base, plan for 1-2y turnover; 66% free/reduced lunch — lower-income household profile, screen leases tightly.
- Zoned schools: Chadwell Elementary (math 2% / reading 8%, grade F, #896 of 952 statewide, top 96%, 401 students, 0% FRL); Maplewood High (math 2% / reading 12%, grade F, #294 of 332 statewide, top 91%, 691 students, 0% FRL) — zoned schools average 0% FRL vs 66% district-wide (66 pts lower); this property's tenant base skews higher-income than the district average.
- Market conditions: Rents rising (+1.3%/yr); 535 active listings in the ZIP; 19 comparable units currently listed for rent nearby; rentals at typical pace (median 17d on market — plan ~3-4 weeks tenant-placement turnaround); 6,873 units permitted in Davidson County in 2024 (4,138 in 5+ unit buildings).
- This rent runs 30% of the median local income ($62k/yr) — at the standard rent-burdened threshold; future hikes will face affordability resistance.
Forward outlook
- Local home prices are declining (-3.0%/yr); year-one equity from $1k of loan paydown is wiped out by about $5k of value loss. Plan a longer hold.
- Davidson County population projected at +42% by 2050 — long-run rental-demand tailwind backs the buy-and-hold thesis.
Negotiation context
- It's been on market 23 days — a 2% lower offer ($172k) is reasonable based on typical stale-listing flexibility.
Risks & watch-outs
- Climate carrying-cost: extreme-heat days projected 7→21/yr by 2055 (HVAC capex compounding) — expect insurance premiums to compound above CPI over the hold.
Questions for the listing agent
- Is there a deadline driving the sale (1031 exchange, divorce, estate, relocation)? That informs how much negotiation room exists.
- The area grade is low — what's the realistic commute time and amenity access for the typical tenant pool here? Any planned neighborhood developments (good or bad) we should know about?
- What's the average days-on-market for RENTAL listings here right now (not sales)? A rising rental-DOM trend means longer vacancies and softer asking-rent achievability than the comps imply.
- What's the recent tenant-quality profile in this submarket — average credit score on applications, eviction rate, late-payment / NSF rate, and stable-employment percentage? A property-management company in the area should have these aggregated.
- How much new for-sale + rental construction is in the pipeline within 1–3 miles? Heavy new supply typically softens prices + rents 12–24 months out; constrained supply supports both.
Investment metrics
- 1% rule
- 0.88% ✗
- Cap rate
- 6.38%
- Cash-on-cash
- 0.32%
- DSCR
- 1.01
- GRM
- 9.4
CMA / ARV
No comps found within radius.
Projected returns pro-forma
-3.0% appreciation · 1.33% rent growth · sell at horizon
- IRR
- -17.7%
- Equity multiple
- 0.39×
- Total profit
- $-30,056
- Equity at exit
- $26,093
- IRR
- -13.3%
- Equity multiple
- 0.28×
- Total profit
- $-35,150
- Equity at exit
- $15,131
Cash invested: $49,000 (down + closing). Projections, not guarantees.
Landlord ↔ Tenant lean methodology
- Overall (STATE)
- 87 Strongly Landlord-Friendly
- State Tennessee
- 87 Strongly Landlord-Friendly · R+13
- County
- — inherits STATE
- City
- — inherits STATE
ZIP-level market 37207
- Home prices YoY
- -27.8%
- Rents YoY
- 1.3%
- Active inventory
- 535
- Price-to-rent
- 9.4×
Monthly cashflow live
- Estimated rent
- $1,547 high interval (Pro) →
- Mortgage (P&I)
- −$918
- Tax est. 1.5%
- −$219 /mo · $2,625/yr
- Insurance
- −$73
- HOA
- −$0
- Vacancy / Maint / Mgmt
- −$325
- Net cashflow
- $13
Break-even live
UW: 25.0% down · 7.5% · 30yr · 1.5% tax · 5.0% vac · 8.0% maint · 8.0% mgmt
Financing live
Cash to close
- Down payment
- $43,750
- Closing costs
- $5,250
- Reserves months
- —
- Total cash needed
- —
Loan-product check · same deal, 3 products live
Conventional
25% down · 7.5% · 30yr
- Down + closing
- —
- Monthly P&I
- —
- Monthly cashflow
- —
- DSCR
- —
- Eligible?
- —
Personal DTI + credit; lowest rate.
DSCR
20% down · 8.5% · 30yr
- Down + closing
- —
- Monthly P&I
- —
- Monthly cashflow
- —
- DSCR
- —
- Eligible?
- —
No personal income docs; deal must DSCR.
Hard money
10% down · 12.0% · 12mo
- Down + closing
- —
- Monthly P&I
- —
- Monthly cashflow
- —
- DSCR
- —
- Eligible?
- —
Short-term bridge; refi at stabilization.
Rent comps 19 comps
| Address | Beds | Baths | Sqft | Rent | $/sqft | DOM | Units | Dist |
|---|---|---|---|---|---|---|---|---|
| 3120 Creekwood Dr Nashville, TN | 2.0 | 1.0 | 910 | $1,300 | $1.43 | 21d | 1 | 0.29mi |
| 3104 Brickdale Ln Unit B Nashville, TN | 2.0 | 1.0 | 916 | $1,400 | $1.53 | 21d | 1 | 0.30mi |
| 1100 Sunset Cir Nashville, TN | 1.0–3.0 | 1.0–2.5 | 1070 | $1,574 | $1.47 | 2d | 7 | 0.40mi |
| 334 Ewing Dr Nashville, TN | 2.0–3.0 | 2.0–2.5 | 1185 | $1,093 | $0.92 | 1d | 1 | 0.50mi |
| 103 Hart Ln Nashville, TN | 1.0 | 1.0 | 550 | $1,099 | $2.00 | 7d | 2 | 0.66mi |
| 3123 Wilmoth Rd Nashville, TN | 2.0 | 1.0 | 1000 | $1,250 | $1.25 | 3d | 1 | 0.76mi |
| 2945 Brick Church Pike Nashville, TN | 1.0–3.0 | 1.0–2.0 | 1052 | $1,428 | $1.36 | 23d | 1 | 0.79mi |
| 3100 Conviser Dr Nashville, TN | 2.0 | 1.5 | 960 | $1,600 | $1.67 | 17d | 1 | 0.92mi |
| 301 Ben Allen Rd Nashville, TN | 1.0–3.0 | 1.0–2.0 | 1019 | $1,450 | $1.42 | 1d | 11 | 0.92mi |
| 410 Ewing Dr Nashville, TN | 2.0 | 1.0 | 780 | $1,300 | $1.67 | 17d | 1 | 0.98mi |
| 3137 Lauren Evelyn Way Nashville, TN | 3.0 | 2.0 | 1100 | $1,725 | $1.57 | 23d | 1 | 1.00mi |
| 3137 Lauren Evelyn Way Nashville, TN | 3.0 | 2.0 | 1100 | $1,725 | $1.57 | 16d | 1 | 1.00mi |
| 3321 Chesapeake Cir Nashville, TN | 2.0 | 1.0 | 974 | $1,395 | $1.43 | 13d | 1 | 1.18mi |
| 3311 Chesapeake Cir Unit 1 Nashville, TN | 2.0 | 1.0 | 881 | $1,500 | $1.70 | 23d | 1 | 1.18mi |
| 603 Lemont Dr Nashville, TN | 1.0 | 1.0 | 780 | $2,200 | $2.82 | 23d | 1 | 1.31mi |
| 438 Roger Williams Ave Nashville, TN | 2.0 | 1.5 | 960 | $1,450 | $1.51 | 21d | 1 | 1.32mi |
| 3136 Greggwood Dr Nashville, TN | 3.0 | 2.0 | 1050 | $2,000 | $1.90 | 11d | 1 | 1.35mi |
| 3120 Ewingdale Dr Nashville, TN | 2.0 | 1.0 | 975 | $1,700 | $1.74 | 23d | 1 | 1.38mi |
| 488 Lemont Dr Nashville, TN | 1.0–3.0 | 1.0–1.5 | 951 | $1,730 | $1.82 | 1d | 47 | 1.42mi |
Listing history 17 events
-
2026-06-18days on market $175,000 Active 23 DOM
-
2026-06-17days on market $175,000 Active 22 DOM
-
2026-06-16days on market $175,000 Active 21 DOM
-
2026-06-15days on market $175,000 Active 20 DOM
-
2026-06-13days on market $175,000 Active 18 DOM
-
2026-06-13days on market $175,000 Active 17 DOM
-
2026-06-09days on market $175,000 Active 14 DOM
-
2026-06-08days on market $175,000 Active 13 DOM
-
2026-06-07days on market $175,000 Active 12 DOM
-
2026-06-05days on market $175,000 Active 9 DOM
-
2026-06-03days on market $175,000 Active 8 DOM
-
2026-06-02days on market $175,000 Active 7 DOM
-
2026-06-01days on market $175,000 Active 6 DOM
-
2026-05-31days on market $175,000 Active 5 DOM
-
2026-05-22historical $175,000
-
2026-05-17historical
-
2026-05-16historical
ⓘ Source: listings_history table (triggers on properties + properties_extension) + one-shot
backfill from property_details.listing_events for pre-trigger history.
Climate risk First Street
- Flood 1/10 Low FEMA zone X (unshaded) · 0% chance over 30 yrs
- Wildfire 1/10 Low
- Heat 6/10 Major 7 d/yr ≥106°F today · 21 d/yr by 30 yrs out
- Wind 4/10 Moderate 9% chance of damaging wind over 30 yrs
- Air quality 2/10 Low 1 unhealthy d/yr today · 2 by 30 yrs out
Nearby sold comps map
Loading sold comps map…
Walkable amenities ~0.75 mi
Loading nearby amenities…
Taxation est. · year 1
- Rental income
- $18,570
- − Mortgage interest
- −$9,803
- − Property taxes
- −$2,625
- − Insurance
- −$875
- − Repairs & maintenance
- −$1,486
- − Management
- −$1,486
- − Depreciation
- −$5,091
- Taxable loss
- −$2,795
- Est. tax savings @ 24.0%
- +$671
- After-tax cash flow
- $828/yr
For passive investors: Depreciation is non-cash, so a rental often shows a tax loss while cash-flowing — sheltering income. Rental losses are passive: they offset passive income freely, and up to $25,000/yr can offset ordinary (W-2) income if you actively participate and your MAGI is under $100k (phasing out to $0 by $150k); unused losses carry forward. On sale, claimed depreciation is recaptured at up to 25%, and gains may owe capital-gains tax (a 1031 exchange can defer both). Figures are a year-1 estimate at your 24.0% rate — not tax advice; consult a CPA.
Condition & rehab AI · 1 photo
This 2-bedroom, 1-bath home offers a good condition with a good exterior and interior. It has potential for cosmetic updates to enhance its curb appeal and value.
Value-add opportunities
- Both Painting exterior and interior walls — Fresh paint can enhance curb appeal and interior aesthetics.
- Both Landscaping improvements — Enhanced landscaping can increase both resale and rental value.
- Rental HVAC maintenance — A well-maintained HVAC system ensures comfort and can attract tenants.
- Resale Kitchen and bathroom updates — Modernizing these areas can appeal to potential buyers looking for a home with updated amenities.
Renovation cost estimate screening
Value-add ROI direction
- Both Painting exterior and interior walls — Fresh paint can enhance curb appeal and interior aesthetics. ↑
- Both Landscaping improvements — Enhanced landscaping can increase both resale and rental value. ↑
- Rental HVAC maintenance — A well-maintained HVAC system ensures comfort and can attract tenants. ↑
- Resale Kitchen and bathroom updates — Modernizing these areas can appeal to potential buyers looking for a home with updated amenities. ↑
ⓘ Cost ranges are severity-bucket heuristics (US national rule-of-thumb). Get contractor quotes + a written scope before underwriting a rehab budget.
Schools (NCES district)
- District
- Davidson County
- NCES district ID
- 4703180
- Math proficiency
- 12% ▼ -17.00%
- Reading proficiency
- 19% ▼ -7.00%
- Median HH income
- $48,667
- Composite
- 14.03/100
- National rank
- #9472
- State rank
- #126 of 139 in TN
Livability — Nashville-Davidson metropolitan government (balance)
No livability data for this city. (Only ~50 U.S. cities are tracked.)
Census & demographics
- Census place
- Nashville-Davidson metropolitan government (balance), TN
- County
- Davidson County · 680,067 people
- City population
- 677,595
- Metro
- Nashville-Davidson--Murfreesboro--Franklin, TN
- Population (ZIP)
- 41,366
- Household income
- $61,744
- Rent vs Own
- Severe rent burden
- 1969.0
Population outlook (Davidson County) Hauer SSP2
- Today (2025)
- 808,568 people
- By 2030
- 874,489 · +8.2%
- By 2040
- 1,009,046 · +24.8%
- By 2050
- 1,147,294 · +41.9%
- By 2075
- 1,475,439 · +82.5%
- By 2100
- 1,714,101 · +112.0%
Race, ethnicity, and origin ACS 2023
- Neighborhood character
- Diverse neighborhood (Simpson 0.60)
- Race & ethnicity
- Black 57% White 24% Hispanic / Latino 13% Two or more races 8%
- Hispanic origin (detail)
- Mexican 6%
- Common ancestry
- Slovak 2% Serbian 1% Romanian 1%
- Foreign-born
- 10% · Canada, Jamaica
- Languages at home
- 88% English-only · Spanish 10%
Political lean MEDSL · Davidson
- 2024 margin
- Strong D (+27.4) · D 62.7% · R 35.3% · Other 2.0%
- 2008→2024 swing
- +6.5pp toward D · 2008: 21.0pp · 2024: 27.4pp
- All cycles
- 2024: D+27.4 2020: D+32.1 2016: D+26.0 2012: D+18.7 2008: D+21.0
Not yet ingested
- Civics
- —
Market trends
- HPI YoY
- ▼ -135.21%
- Current HPI
- 351.9628
- Rent YoY
- ▲ 1.33%
- Metro
- Nashville-Davidson--Murfreesboro--Franklin, TN
- State GDP YoY
- ▲ 2.78%
- F500 in state
- 22
Industry mix (Fortune 500 HQ in TN)
| Industry | F500 HQs | Revenue |
|---|---|---|
| Healthcare | 3 | $91B |
|
||
| Retail | 3 | $72B |
|
||
| Transportation / Logistics | 1 | $88B |
|
||
| Paper / Packaging | 1 | $19B |
|
||
| Insurance | 1 | $13B |
|
||
| Energy | 1 | $12B |
|
||
Price history
3 events — show timeline
- 2026-05-22 Coming Soon $175,000 REALTRACS as Distributed by MLS Grid
- 2026-05-17 Coming Soon — REALTRACS as Distributed by MLS Grid
- 2026-05-16 Listing Removed — REALTRACS as Distributed by MLS Grid
Cash-flow waterfall
monthlySold comps — $/sqft
last 12 mo · ≤1 miLoading sold comps…