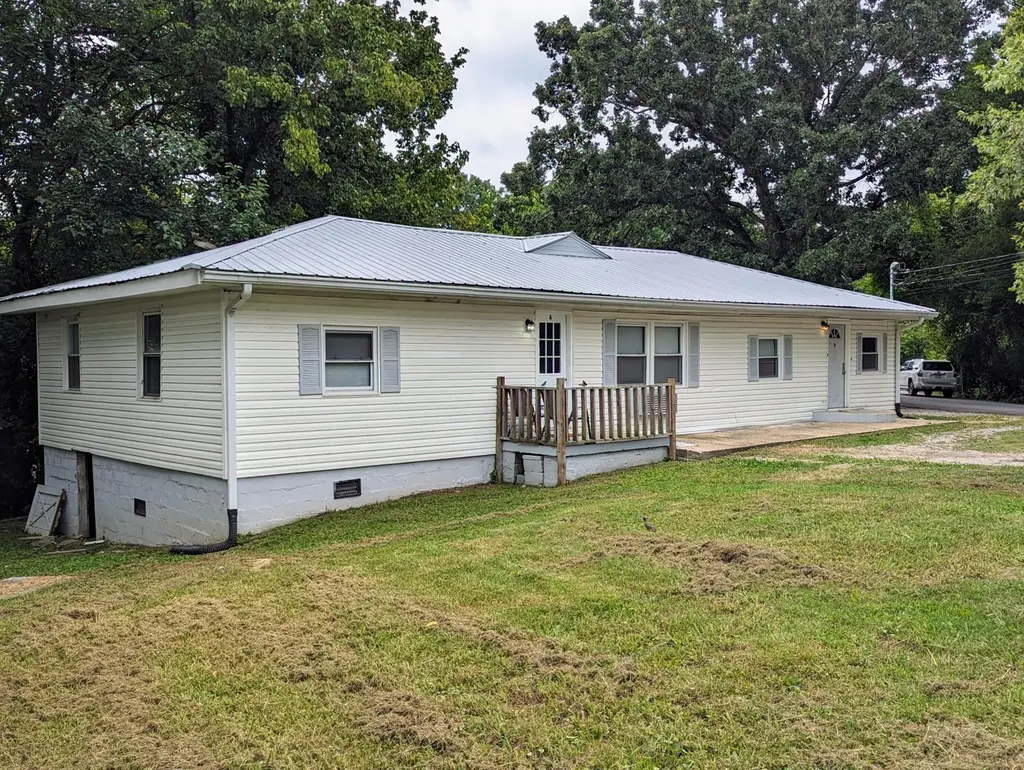
 Duplex
2 Bell Ave · Lakeview, GA
Flood risk 1/10 · Minimal
- FEMA flood zone
- X (unshaded)
- Chance of flooding over 30 yrs
- 0.0%
- Est. flood insurance / yr
- $507 – $1,088
Fire risk 1/10 · Minimal
- Est. fire insurance / yr
- $963 – $1,789
Heat risk 6/10 · Moderate
- Hot days now (above 105°F)
- 7 days/yr
- Hot days in 30 yrs
- 20 days/yr
Wind risk 4/10 · Minor
- Chance of severe wind over 30 yrs
- 12.0%
Air-quality risk 3/10 · Minor
- Unhealthy air days now
- 2 days/yr
- Unhealthy air days in 30 yrs
- 2 days/yr
Risk factors via First Street. Map © Google.
Why this score? — see what drove the B+ grade
The composite is a weighted blend of 9 inputs, each scored 0–100. Each bar is that input's sub-score; the figure is the points it added to the 100-point composite (weight × sub-score).
- Cash flow +30.0/30.0
- ARV discount +15.0/15.0
- DSCR +10.0/10.0
- 1% rule +9.2/10.0
- Rent growth +4.4/5.0
- Livability +3.5/5.0
- Schools +3.3/10.0
- Condition / age +2.5/5.0
- Appreciation +0.0/10.0
$194,000
🖨 Deal sheet 📄 Offer letter ✓ Due diligence
Multi-family units
County records classify this as Multi-Family (2-4 Unit). Listing-text estimate: 2 units. confirmed
Listing remarks MLS
Attention investors! Looking for the 1% return or better? This is investment opportunity in Rossville, Georgia just minutes away from the Tennessee state line within the Greater Chattanooga area! This duplex currently had a gross monthly rent of $2184. The leases include $1239.95 rents for Unit A and previously $994.95 monthly for Unit B which is now vacant. There is also property management is in place. Unit A pays $155/month towards utilities and Unit B was paying $85 per month. Units have access to a storage shed as well. There is potential to increase gross monthly rents to $2550+ since the 2025 HUD Small Area Fair Market Rents are $1,340 for a 2 bedroom and $1,210 for a 1 bedroom unit in 30741. This duplex includes one 2 bedroom and 1 bathroom in unit A and 1 bedroom 1 bathroom in unit B. The property was previously connected to septic and has recently been connected to sewer in 2025. The vacant 1 bedroom unit may be shown and the tenant occupied unit after an accepted offer.
Key facts
- Storage shed
- Connected to sewer
- 9,147 sq ft lot
Tags
Neighborhood map
What this means for you Summary
Snapshot
- This is a 2 × 3-bed/2.0-bath units multifamily listed at $194k.
Deal economics
- At list price, monthly cash flow is $972 ($12k/yr) — positive. Per door: $486/mo.
- The deal already cash-flows at list — no discount required.
- Meets the 1% rule at list price ($3k rent vs $194k).
- Recommended offer: $182k (6.0% below list) — sets the bar for market timing.
- Cap rate 12.3% vs local median 4.9% in Lakeview — top-decile yield for the area; either an underpriced asset or a hidden risk that comps aren't pricing in. Stress-test before assuming the spread holds.
Location & tenants
- Location reads 69/100 on livability (#106 in GA) — a middle-class / working-renter tenant base. Strengths: cost of living A+, housing A+, crime B; Watch: schools F, amenities F, commute F.
- Catoosa County (suburban): math 36% / reading 41% proficiency, ranked #49 of 174 in GA (top 28%) — families likely to look elsewhere, expect single-tenant / working-renter base with shorter leases.
- Market conditions: Rents rising fast (+7.4%/yr); 425 active listings in the ZIP; 848 units permitted in Catoosa County in 2024 (256 in 5+ unit buildings).
- At $2,753/mo this rent would consume 56% of the median local household income ($59k/yr) (locally 834% of renters already pay >50% of income on rent) — very limited rent-growth headroom before tenants either downsize or default.
Forward outlook
- Local home prices are declining (-3.0%/yr); year-one equity from $1k of loan paydown is wiped out by about $6k of value loss. Plan a longer hold.
- Catoosa County population projected at +5% by 2050 — modest demand growth; plan on rents tracking national, not racing it.
- At projected returns (-3.0% appreciation + 7.4% rent growth), your $54k cash investment doubles in ~5 years — after that, you're playing with house money.
Negotiation context
- It's been on market 66 days — a 6% lower offer ($182k) is reasonable based on typical stale-listing flexibility.
- 3 sale attempts since 4y ago with the ask held roughly flat each time — persistent listings suggest the price (not the market) is what's stuck; bring a comps-based counter.
- Current owner paid $130k; 49% above their basis — modest negotiation headroom, anchor on the comps not their cost.
Risks & watch-outs
- Watch-outs: built in 1940 — expect roof / HVAC / electrical / plumbing capex.
- Climate carrying-cost: extreme-heat days projected 7→20/yr by 2055 (HVAC capex compounding) — expect insurance premiums to compound above CPI over the hold.
Questions for the listing agent
- It's been on market 66 days. Have you received any prior offers? Is the seller open to a 6% concession, seller financing, or rate buy-down credit?
- Can we see the unit-by-unit rent roll, current vacancy, and any below-market leases? What's the average tenancy length?
- What capital expenditures (roof, boiler, parking lot, exteriors) have been made in the last 5 years, and what's planned in the next 2?
- Built in 1940 — when were the roof, HVAC, electrical panel, plumbing, and water heater last replaced?
- Why hasn't it sold? Are there any deal-killer items the seller is aware of (foundation, flood, title, zoning, code violations)?
- Is there a deadline driving the sale (1031 exchange, divorce, estate, relocation)? That informs how much negotiation room exists.
- Schools are F-rated, which usually means shorter tenancies and higher turnover. Who's the typical renter profile here, and what's been the actual vacancy rate?
- What's the average days-on-market for RENTAL listings here right now (not sales)? A rising rental-DOM trend means longer vacancies and softer asking-rent achievability than the comps imply.
- What's the recent tenant-quality profile in this submarket — average credit score on applications, eviction rate, late-payment / NSF rate, and stable-employment percentage? A property-management company in the area should have these aggregated.
- How much new apartment / multifamily construction is in the pipeline within 1–3 miles? Heavy new supply (>2% of stock underway) typically softens rents 12–24 months out; light construction supports rent growth.
Investment metrics
- 1% rule
- 1.42% ✓
- Cap rate
- 12.30%
- Cash-on-cash
- 21.47%
- DSCR
- 1.96
- GRM
- 5.9
CMA / ARV
- ARV (median comp)
- $234,470
- List price
- $194,000
- Delta
- -17.26%
- Verdict
- UNDERPRICED
- Comps
- 11 within 1.0 mi
Projected returns pro-forma
-3.0% appreciation · 7.44% rent growth · sell at horizon
- IRR
- 18.7%
- Equity multiple
- 1.80×
- Total profit
- $43,268
- Equity at exit
- $28,926
- IRR
- 29.8%
- Equity multiple
- 4.22×
- Total profit
- $174,999
- Equity at exit
- $16,774
Cash invested: $54,320 (down + closing). Projections, not guarantees.
Landlord ↔ Tenant lean methodology
- Overall (STATE)
- 90 Strongly Landlord-Friendly
- State Georgia
- 90 Strongly Landlord-Friendly · R+3
- County
- — inherits STATE
- City
- — inherits STATE
ZIP-level market 30741
- Home prices YoY
- -30.7%
- Rents YoY
- 7.4%
- Active inventory
- 425
- Price-to-rent
- 11.7×
Monthly cashflow live
- Estimated rent
- $2,753 high interval (Pro) →
- Mortgage (P&I)
- −$1,017
- Tax from tax record
- −$105 /mo · $1,258/yr
- Insurance
- −$81
- HOA
- −$0
- Vacancy / Maint / Mgmt
- −$578
- Net cashflow
- $972
Break-even live
2-unit breakdown (identical units grouped — click to expand)
| Units | Beds | Baths | Est. rent |
|---|---|---|---|
| 2× units | 3 | 2 | $2,752 |
| #1 | 3 | 2 | $1,376 |
| #2 | 3 | 2 | $1,376 |
| Total (2 units) | $2,753 | ||
UW: 25.0% down · 7.5% · 30yr · 1.5% tax · 5.0% vac · 8.0% maint · 8.0% mgmt
Financing live
Cash to close
- Down payment
- $48,500
- Closing costs
- $5,820
- Reserves months
- —
- Total cash needed
- —
Loan-product check · same deal, 3 products live
Conventional
25% down · 7.5% · 30yr
- Down + closing
- —
- Monthly P&I
- —
- Monthly cashflow
- —
- DSCR
- —
- Eligible?
- —
Personal DTI + credit; lowest rate.
DSCR
20% down · 8.5% · 30yr
- Down + closing
- —
- Monthly P&I
- —
- Monthly cashflow
- —
- DSCR
- —
- Eligible?
- —
No personal income docs; deal must DSCR.
Hard money
10% down · 12.0% · 12mo
- Down + closing
- —
- Monthly P&I
- —
- Monthly cashflow
- —
- DSCR
- —
- Eligible?
- —
Short-term bridge; refi at stabilization.
Listing history 32 events
-
2026-06-18days on market $194,000 Active 66 DOM
-
2026-06-17days on market $194,000 Active 65 DOM
-
2026-06-16days on market $194,000 Active 64 DOM
-
2026-06-15days on market $194,000 Active 63 DOM
-
2026-06-14days on market $194,000 Active 61 DOM
-
2026-06-10days on market $194,000 Active 58 DOM
-
2026-06-09days on market $194,000 Active 57 DOM
-
2026-06-08days on market $194,000 Active 56 DOM
-
2026-06-07days on market $194,000 Active 55 DOM
-
2026-06-03days on market $194,000 Active 51 DOM
-
2026-06-02days on market $194,000 Active 50 DOM
-
2026-06-01days on market $194,000 Active 49 DOM
-
2026-05-31days on market $194,000 Active 48 DOM
-
2026-05-30days on market $194,000 Active 47 DOM
-
2026-05-18price $194,000 1007-char remark
Show marketing remark (1007 chars)
Attention investors! Looking for the 1% return or better? This is investment opportunity in Rossville, Georgia just minutes away from the Tennessee state line within the Greater Chattanooga area! This duplex currently had a gross monthly rent of $2184. The leases include $1239.95 rents for Unit A and previously $994.95 monthly for Unit B which is now vacant. There is also property management is in place. Unit A pays $155/month towards utilities and Unit B was paying $85 per month. Units have access to a storage shed as well. There is potential to increase gross monthly rents to $2550+ since the 2025 HUD Small Area Fair Market Rents are $1,340 for a 2 bedroom and $1,210 for a 1 bedroom unit in 30741. This duplex includes one 2 bedroom and 1 bathroom in unit A and 1 bedroom 1 bathroom in unit B. The property was previously connected to septic and has recently been connected to sewer in 2025. The vacant 1 bedroom unit may be shown and the tenant occupied unit after an accepted offer.
-
2026-05-01price $199,000 1007-char remark
Show marketing remark (1007 chars)
Attention investors! Looking for the 1% return or better? This is investment opportunity in Rossville, Georgia just minutes away from the Tennessee state line within the Greater Chattanooga area! This duplex currently had a gross monthly rent of $2184. The leases include $1239.95 rents for Unit A and previously $994.95 monthly for Unit B which is now vacant. There is also property management is in place. Unit A pays $155/month towards utilities and Unit B was paying $85 per month. Units have access to a storage shed as well. There is potential to increase gross monthly rents to $2550+ since the 2025 HUD Small Area Fair Market Rents are $1,340 for a 2 bedroom and $1,210 for a 1 bedroom unit in 30741. This duplex includes one 2 bedroom and 1 bathroom in unit A and 1 bedroom 1 bathroom in unit B. The property was previously connected to septic and has recently been connected to sewer in 2025. The vacant 1 bedroom unit may be shown and the tenant occupied unit after an accepted offer.
-
2026-04-10$204,000 Active 1007-char remark
Show marketing remark (1007 chars)
Attention investors! Looking for the 1% return or better? This is investment opportunity in Rossville, Georgia just minutes away from the Tennessee state line within the Greater Chattanooga area! This duplex currently had a gross monthly rent of $2184. The leases include $1239.95 rents for Unit A and previously $994.95 monthly for Unit B which is now vacant. There is also property management is in place. Unit A pays $155/month towards utilities and Unit B was paying $85 per month. Units have access to a storage shed as well. There is potential to increase gross monthly rents to $2550+ since the 2025 HUD Small Area Fair Market Rents are $1,340 for a 2 bedroom and $1,210 for a 1 bedroom unit in 30741. This duplex includes one 2 bedroom and 1 bathroom in unit A and 1 bedroom 1 bathroom in unit B. The property was previously connected to septic and has recently been connected to sewer in 2025. The vacant 1 bedroom unit may be shown and the tenant occupied unit after an accepted offer.
-
2025-03-13price $189,000
-
2024-12-05price $196,500
-
2024-10-24price $197,500
-
2024-10-08price $199,500
-
2024-01-13historical $995
-
2023-12-01$995
-
2023-10-04price $217,500
-
2022-12-22soldstatus $130,000
-
2022-12-13soldstatus $130,000 Closed
-
2022-11-05historical Contingent
-
2022-10-24price $184,900
-
2022-09-09price $189,900
-
2022-05-25$225,000 Active
-
2015-10-20soldstatus $49,900
-
2003-06-06soldstatus $37,000
ⓘ Source: listings_history table (triggers on properties + properties_extension) + one-shot
backfill from property_details.listing_events for pre-trigger history.
Tax reassessment forecast GA · Resets to sale price
- Current annual tax
- $1,258 · $105/mo
- Projected year-2 tax
- $1,785 · $149/mo
- Expected delta
- +$527/yr (+$44/mo · 41.9%)
ⓘ Screening estimate from a state-policy table — verify with the county assessor before closing.
Climate risk First Street
- Flood 1/10 Low FEMA zone X (unshaded) · 0% chance over 30 yrs
- Wildfire 1/10 Low
- Heat 6/10 Major 7 d/yr ≥105°F today · 20 d/yr by 30 yrs out
- Wind 4/10 Moderate 12% chance of damaging wind over 30 yrs
- Air quality 3/10 Moderate 2 unhealthy d/yr today · 2 by 30 yrs out
Nearby sold comps map
Loading sold comps map…
Walkable amenities ~0.75 mi
Loading nearby amenities…
Taxation est. · year 1
- Rental income
- $33,036
- − Mortgage interest
- −$10,867
- − Property taxes
- −$1,258
- − Insurance
- −$970
- − Repairs & maintenance
- −$2,643
- − Management
- −$2,643
- − Depreciation
- −$5,644
- Taxable income
- $9,012
- Est. tax owed @ 24.0%
- −$2,163
- After-tax cash flow
- $9,500/yr
For passive investors: Depreciation is non-cash, so a rental often shows a tax loss while cash-flowing — sheltering income. Rental losses are passive: they offset passive income freely, and up to $25,000/yr can offset ordinary (W-2) income if you actively participate and your MAGI is under $100k (phasing out to $0 by $150k); unused losses carry forward. On sale, claimed depreciation is recaptured at up to 25%, and gains may owe capital-gains tax (a 1031 exchange can defer both). Figures are a year-1 estimate at your 24.0% rate — not tax advice; consult a CPA.
Schools (NCES district)
- District
- Catoosa County
- NCES district ID
- 1300930
- Math proficiency
- 36% ▼ -15.00%
- Reading proficiency
- 41% ▼ -8.00%
- Median HH income
- $48,913
- Composite
- 33.13/100
- National rank
- #5558
- State rank
- #49 of 174 in GA
Livability — Lakeview
- Score
- 69/100
- State rank
- #106
- US rank
- #8207
Category grades
Schools grade is shown separately in the Schools card above.
Census & demographics
- Census place
- Lakeview, GA
- County
- Walker County · 48,831 people
- Metro
- Chattanooga, TN-GA
- Population (ZIP)
- 30,041
- Household income
- $58,834
- Rent vs Own
- Severe rent burden
- 834.0
Population outlook (Catoosa County) Hauer SSP2
- Today (2025)
- 70,112 people
- By 2030
- 71,621 · +2.2%
- By 2040
- 73,595 · +5.0%
- By 2050
- 73,921 · +5.4%
- By 2075
- 72,135 · +2.9%
- By 2100
- 65,979 · -5.9%
Race, ethnicity, and origin ACS 2023
- Neighborhood character
- Predominantly White (86%)
- Race & ethnicity
- White 86% Black 5% Two or more races 5% Hispanic / Latino 5%
- Common ancestry
- Slovak 3% Iranian 2% Italian 1%
- Foreign-born
- 2% · Canada
- Languages at home
- 96% English-only · Spanish 3%
Political lean MEDSL · Catoosa
- 2024 margin
- Solid R (+55.5) · D 22.0% · R 77.5%
- 2008→2024 swing
- -5.7pp toward R · 2008: -49.8pp · 2024: -55.5pp
- All cycles
- 2024: R+55.5 2020: R+56.0 2016: R+60.7 2012: R+52.8 2008: R+49.8
Not yet ingested
- Civics
- —
Market trends
- HPI YoY
- ▼ -118.05%
- Current HPI
- 267.0047
- Rent YoY
- ▲ 7.44%
- Metro
- Chattanooga, TN-GA
- State GDP YoY
- ▲ 2.66%
- F500 in state
- 28
Industry mix (Fortune 500 HQ in GA)
| Industry | F500 HQs | Revenue |
|---|---|---|
| Paper / Packaging | 2 | $29B |
|
||
| Retail | 1 | $160B |
|
||
| Transportation / Logistics | 1 | $91B |
|
||
| Airlines | 1 | $62B |
|
||
| Consumer Goods | 1 | $47B |
|
||
| Utilities | 1 | $25B |
|
||
Price history
+424.3% since first listed18 events — show timeline
- 2026-05-18 Price Changed $194,000 GCAR
- 2026-05-01 Price Changed $199,000 GCAR
- 2026-04-10 Listed $204,000 GCAR
- 2025-03-13 Price Changed $189,000 GCAR
- 2024-12-05 Price Changed $196,500 GCAR
- 2024-10-24 Price Changed $197,500 GCAR
- 2024-10-08 Price Changed $199,500 GCAR
- 2024-01-13 Rental Removed $995 APPFOLIO
- 2023-12-01 Listed for Rent $995 APPFOLIO
- 2023-10-04 Price Changed $217,500 GCAR
- 2022-12-22 Sold (Public Records) $130,000 Public Records
- 2022-12-13 Sold (MLS) $130,000 GCAR
- 2022-11-05 Contingent — GCAR
- 2022-10-24 Price Changed $184,900 GCAR
- 2022-09-09 Price Changed $189,900 GCAR
- 2022-05-25 Listed $225,000 GCAR
- 2015-10-20 Sold (Public Records) $49,900 Public Records
- 2003-06-06 Sold (Public Records) $37,000 Public Records
Property tax history
+12.0%/yrLatest (2025): $1,258 · -4.2% YoY. Source: county tax records.
Cash-flow waterfall
monthlySold comps — $/sqft
last 12 mo · ≤1 miLoading sold comps…