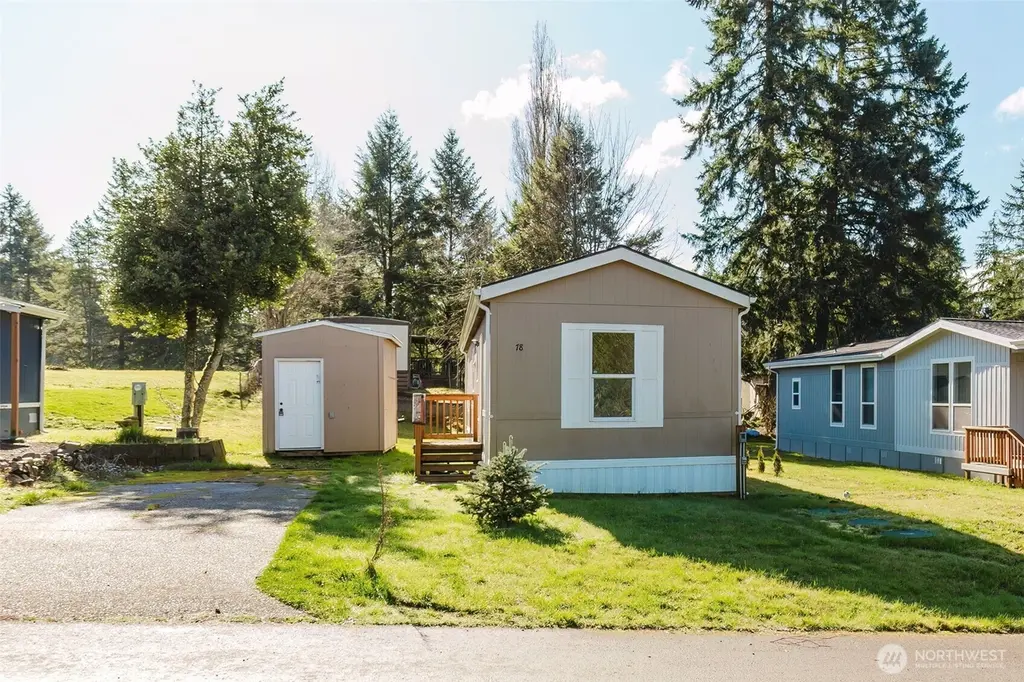
3371 Bielmeier Rd #78 · Bethel, WA
Flood risk 1/10 · Minimal
- FEMA flood zone
- X (unshaded)
- Chance of flooding over 30 yrs
- 0.0%
- Est. flood insurance / yr
- $507 – $1,088
Fire risk 1/10 · Minimal
- Est. fire insurance / yr
- $604 – $1,122
Heat risk 3/10 · Minor
- Hot days now (above 86°F)
- 7 days/yr
- Hot days in 30 yrs
- 14 days/yr
Wind risk 1/10 · Minimal
- Chance of severe wind over 30 yrs
- —
Air-quality risk 7/10 · Major
- Unhealthy air days now
- 9 days/yr
- Unhealthy air days in 30 yrs
- 10 days/yr
Risk factors via First Street. Map © Google.
Why this score? — see what drove the C+ grade
The composite is a weighted blend of 9 inputs, each scored 0–100. Each bar is that input's sub-score; the figure is the points it added to the 100-point composite (weight × sub-score).
- Cash flow +30.0/30.0
- 1% rule +10.0/10.0
- DSCR +10.0/10.0
- Schools +5.2/10.0
- Livability +3.4/5.0
- Rent growth +2.9/5.0
- Condition / age +2.5/5.0
- ARV discount +0.0/15.0
- Appreciation +0.0/10.0
$84,900
🖨 Deal sheet 📄 Offer letter ✓ Due diligence
Listing remarks
Move-in ready and beautifully updated! This 2015-built 2-bedroom, 1-bath home in the desirable Kitsap West Mobile Home Park offers modern comfort with a fresh, stylish feel. Recent upgrades include luxury vinyl plank flooring throughout, all-new interior paint, trim, cabinetry, and appliances—every detail thoughtfully refreshed. The open living space is light and inviting, while the efficient kitchen shines with new cabinets and appliances, all of which stay. Enjoy the convenience of a handy storage shed and the benefit of a spacious yard, perfect for relaxing or gardening. Kitsap West is an all-ages community featuring open space and generous lot sizes, creating a welcoming neighborh
Key facts
- Spacious yard
- Open space
- New cabinets
Tags
Neighborhood map
What this means for you Summary
Snapshot
- This is a 2-bed/1.0-bath manufactured listed at $85k.
Deal economics
- At list price, monthly cash flow is $987 ($12k/yr) — positive.
- The deal already cash-flows at list — no discount required.
- Meets the 1% rule at list price ($2k rent vs $85k).
- Recommended offer: $75k (12.0% below list) — sets the bar for market timing.
- Cap rate 20.2% vs local median 3.6% in Bethel — top-decile yield for the area; either an underpriced asset or a hidden risk that comps aren't pricing in. Stress-test before assuming the spread holds.
Location & tenants
- Location reads 68/100 on livability (#279 in WA) — a middle-class / working-renter tenant base. Strengths: housing A+, employment A, crime B+; Watch: health & safety C-, cost of living D+, schools D-.
- South Kitsap School District (suburban): math 52% / reading 64% proficiency, ranked #71 of 291 in WA (top 24%) — acceptable for families but not a draw, mixed tenant base, ~2y average lease.
- Market conditions: Rents rising (+1.6%/yr); 341 active listings in the ZIP; high-income renter base; 1,294 units permitted in Kitsap County in 2024 (302 in 5+ unit buildings).
Forward outlook
- Local home prices are declining (-3.0%/yr); year-one equity from $587 of loan paydown is wiped out by about $3k of value loss. Plan a longer hold.
- Kitsap County population projected at +8% by 2050 — modest demand growth; plan on rents tracking national, not racing it.
- At projected returns (-3.0% appreciation + 1.6% rent growth), your $24k cash investment doubles in ~3 years — after that, you're playing with house money.
Negotiation context
- It's been on market 127 days — a 12% lower offer ($75k) is reasonable based on typical stale-listing flexibility.
- 2 sale attempts since 6y ago; this cycle's ask has dropped $5k (6%) from the opening price — seller is motivated, your offer sets the floor, not the list.
- Current owner paid $58k; 47% above their basis — modest negotiation headroom, anchor on the comps not their cost.
Questions for the listing agent
- It's been on market 127 days. Have you received any prior offers? Is the seller open to a 12% concession, seller financing, or rate buy-down credit?
- Why hasn't it sold? Are there any deal-killer items the seller is aware of (foundation, flood, title, zoning, code violations)?
- Is there a deadline driving the sale (1031 exchange, divorce, estate, relocation)? That informs how much negotiation room exists.
- Schools are D-rated, which usually means shorter tenancies and higher turnover. Who's the typical renter profile here, and what's been the actual vacancy rate?
- What's the average days-on-market for RENTAL listings here right now (not sales)? A rising rental-DOM trend means longer vacancies and softer asking-rent achievability than the comps imply.
- What's the recent tenant-quality profile in this submarket — average credit score on applications, eviction rate, late-payment / NSF rate, and stable-employment percentage? A property-management company in the area should have these aggregated.
- How much new for-sale + rental construction is in the pipeline within 1–3 miles? Heavy new supply typically softens prices + rents 12–24 months out; constrained supply supports both.
Investment metrics
- 1% rule
- 2.35% ✓
- Cap rate
- 20.25%
- Cash-on-cash
- 49.84%
- DSCR
- 3.22
- GRM
- 3.6
CMA / ARV
- ARV (median comp)
- $68,084
- List price
- $84,900
- Delta
- 24.70%
- Verdict
- OVERPRICED
- Comps
- 2 within 1.0 mi
Show comp detail 1 sale within ~0.75 mi
| Address | Dist | Beds/Ba | Sqft | Sold | Price | $/sf | Match |
|---|---|---|---|---|---|---|---|
| 3371 SE Bielmeier Rd #33 | 0.05mi | 2/1.0 | 864 (+10%) | 4mo | $69,900 | $81 | 77 |
Match score weights: distance 35% · size 25% · config 20% · recency 20%. Top-matched comps best support the ARV.
Projected returns pro-forma
-3.0% appreciation · 1.6% rent growth · sell at horizon
- IRR
- 45.9%
- Equity multiple
- 2.95×
- Total profit
- $46,391
- Equity at exit
- $12,659
- IRR
- 51.1%
- Equity multiple
- 5.65×
- Total profit
- $110,451
- Equity at exit
- $7,341
Cash invested: $23,772 (down + closing). Projections, not guarantees.
Landlord ↔ Tenant lean methodology
- Overall (STATE)
- 28 Tenant-Leaning
- State Washington
- 28 Tenant-Leaning · D+8
- County
- — inherits STATE
- City
- — inherits STATE
ZIP-level market 98367
- Rents YoY
- 1.6%
- Active inventory
- 341
- Price-to-rent
- 3.6×
Monthly cashflow live
- Estimated rent
- $1,993 medium interval (Pro) →
- Mortgage (P&I)
- −$445
- Tax est. 1.5%
- −$106 /mo · $1,274/yr
- Insurance
- −$35
- HOA
- −$0
- Vacancy / Maint / Mgmt
- −$418
- Net cashflow
- $987
Break-even live
UW: 25.0% down · 7.5% · 30yr · 1.5% tax · 5.0% vac · 8.0% maint · 8.0% mgmt
Financing live
Cash to close
- Down payment
- $21,225
- Closing costs
- $2,547
- Reserves months
- —
- Total cash needed
- —
Loan-product check · same deal, 3 products live
Conventional
25% down · 7.5% · 30yr
- Down + closing
- —
- Monthly P&I
- —
- Monthly cashflow
- —
- DSCR
- —
- Eligible?
- —
Personal DTI + credit; lowest rate.
DSCR
20% down · 8.5% · 30yr
- Down + closing
- —
- Monthly P&I
- —
- Monthly cashflow
- —
- DSCR
- —
- Eligible?
- —
No personal income docs; deal must DSCR.
Hard money
10% down · 12.0% · 12mo
- Down + closing
- —
- Monthly P&I
- —
- Monthly cashflow
- —
- DSCR
- —
- Eligible?
- —
Short-term bridge; refi at stabilization.
Listing history 22 events
-
2026-06-18days on market $84,900 Active 127 DOM
-
2026-06-17days on market $84,900 Active 126 DOM
-
2026-06-16days on market $84,900 Active 125 DOM
-
2026-06-15days on market $84,900 Active 124 DOM
-
2026-06-14days on market $84,900 Active 122 DOM
-
2026-06-13days on market $84,900 Active 121 DOM
-
2026-06-10days on market $84,900 Active 119 DOM
-
2026-06-09days on market $84,900 Active 118 DOM
-
2026-06-09price $84,900 Active 117 DOM
-
2026-06-08days on market $89,900 Active 117 DOM
-
2026-06-07days on market $89,900 Active 116 DOM
-
2026-06-05days on market $89,900 Active 113 DOM
-
2026-06-03days on market $89,900 Active 112 DOM
-
2026-06-02days on market $89,900 Active 111 DOM
-
2026-06-01days on market $89,900 Active 110 DOM
-
2026-05-31days on market $89,900 Active 109 DOM
-
2026-05-30days on market $89,900 Active 108 DOM
-
2026-02-11$89,900 Active
-
2020-09-09soldstatus $57,900 Sold
-
2020-08-07status Pending
-
2020-08-03status Pending Inspection
-
2020-05-29$59,900 Active
ⓘ Source: listings_history table (triggers on properties + properties_extension) + one-shot
backfill from property_details.listing_events for pre-trigger history.
Climate risk First Street
- Flood 1/10 Low FEMA zone X (unshaded) · 0% chance over 30 yrs
- Wildfire 1/10 Low
- Heat 3/10 Moderate 7 d/yr ≥86°F today · 14 d/yr by 30 yrs out
- Wind 1/10 Low
- Air quality 7/10 Severe 9 unhealthy d/yr today · 10 by 30 yrs out
Nearby sold comps map
Loading sold comps map…
Walkable amenities ~0.75 mi
Loading nearby amenities…
Taxation est. · year 1
- Rental income
- $23,910
- − Mortgage interest
- −$4,756
- − Property taxes
- −$1,274
- − Insurance
- −$424
- − Repairs & maintenance
- −$1,913
- − Management
- −$1,913
- − Depreciation
- −$2,470
- Taxable income
- $11,161
- Est. tax owed @ 24.0%
- −$2,679
- After-tax cash flow
- $9,170/yr
For passive investors: Depreciation is non-cash, so a rental often shows a tax loss while cash-flowing — sheltering income. Rental losses are passive: they offset passive income freely, and up to $25,000/yr can offset ordinary (W-2) income if you actively participate and your MAGI is under $100k (phasing out to $0 by $150k); unused losses carry forward. On sale, claimed depreciation is recaptured at up to 25%, and gains may owe capital-gains tax (a 1031 exchange can defer both). Figures are a year-1 estimate at your 24.0% rate — not tax advice; consult a CPA.
Schools (NCES district)
- District
- South Kitsap School District
- NCES district ID
- 5308160
- Math proficiency
- 52% ▲ 2.00%
- Reading proficiency
- 64% ▲ 3.00%
- Median HH income
- $62,824
- Composite
- 52.31/100
- National rank
- #3445
- State rank
- #71 of 291 in WA
Livability — Bethel
- Score
- 68/100
- State rank
- #279
- US rank
- #9629
Category grades
Schools grade is shown separately in the Schools card above.
Census & demographics
- Census place
- Bethel, WA
- County
- Kitsap County · 243,099 people
- Metro
- Bremerton-Silverdale-Port Orchard, WA
- Population (ZIP)
- 31,756
- Household income
- $115,482
- Rent vs Own
- Severe rent burden
- 595.0
Population outlook (Kitsap County) Hauer SSP2
- Today (2025)
- 277,525 people
- By 2030
- 285,040 · +2.7%
- By 2040
- 294,957 · +6.3%
- By 2050
- 300,622 · +8.3%
- By 2075
- 315,580 · +13.7%
- By 2100
- 304,340 · +9.7%
Race, ethnicity, and origin ACS 2023
- Neighborhood character
- Predominantly White (78%)
- Race & ethnicity
- White 78% Two or more races 11% Hispanic / Latino 7% Asian 4% Pacific Islander 1%
- Hispanic origin (detail)
- Mexican 5%
- Common ancestry
- Italian 7% Portuguese 6% Slovak 4%
- Foreign-born
- 6% · Canada, South Korea, Vietnam
- Languages at home
- 91% English-only · Spanish 3% Tagalog/Filipino 2% Other Asian/Pacific 2%
Political lean MEDSL · Kitsap
- 2024 margin
- Strong D (+20.9) · D 58.8% · R 37.9% · Other 3.3%
- 2008→2024 swing
- +8.6pp toward D · 2008: 12.3pp · 2024: 20.9pp
- All cycles
- 2024: D+20.9 2020: D+18.1 2016: D+11.6 2012: D+11.1 2008: D+12.3
Not yet ingested
- Civics
- —
Market trends
- HPI YoY
- ▼ -441.02%
- Current HPI
- 351.671
- Rent YoY
- ▲ 1.60%
- Metro
- Bremerton-Silverdale-Port Orchard, WA
- State GDP YoY
- ▲ 4.65%
- F500 in state
- 22
Industry mix (Fortune 500 HQ in WA)
| Industry | F500 HQs | Revenue |
|---|---|---|
| Retail | 2 | $269B |
|
||
| Technology / Retail | 1 | $638B |
|
||
| Technology | 1 | $245B |
|
||
| Telecommunications | 1 | $38B |
|
||
| Food / Beverage | 1 | $36B |
|
||
| Automotive / Trucks | 1 | $34B |
|
||
Price history
+50.1% since first listed5 events — show timeline
- 2026-02-11 Listed $89,900 NWMLS as Distributed by MLS Grid
- 2020-09-09 Sold (MLS) $57,900 NWMLS as Distributed by MLS Grid
- 2020-08-07 Pending — NWMLS as Distributed by MLS Grid
- 2020-08-03 Pending — NWMLS as Distributed by MLS Grid
- 2020-05-29 Listed $59,900 NWMLS as Distributed by MLS Grid
Cash-flow waterfall
monthlySold comps — $/sqft
last 12 mo · ≤1 miLoading sold comps…