2809 Hogg St · West Orange, TX
Flood risk 8/10 · Major
- FEMA flood zone
- X (shaded)
- Chance of flooding over 30 yrs
- 0.97%
- Est. flood insurance / yr
- $507 – $1,088
Fire risk 1/10 · Minimal
- Est. fire insurance / yr
- $1,222 – $2,270
Heat risk 9/10 · Severe
- Hot days now (above 109°F)
- 7 days/yr
- Hot days in 30 yrs
- 23 days/yr
Wind risk 9/10 · Severe
- Chance of severe wind over 30 yrs
- 99.0%
Air-quality risk 2/10 · Minimal
- Unhealthy air days now
- 1 days/yr
- Unhealthy air days in 30 yrs
- 1 days/yr
Risk factors via First Street. Map © Google.
Why this score? — see what drove the B+ grade
The composite is a weighted blend of 9 inputs, each scored 0–100. Each bar is that input's sub-score; the figure is the points it added to the 100-point composite (weight × sub-score).
- Cash flow +28.5/30.0
- ARV discount +15.0/15.0
- DSCR +10.0/10.0
- 1% rule +9.0/10.0
- Appreciation +5.5/10.0
- Rent growth +3.9/5.0
- Livability +3.0/5.0
- Condition / age +2.5/5.0
- Schools +1.6/10.0
$100,000
🖨 Deal sheet 📄 Offer letter ✓ Due diligence
Listing remarks MLS
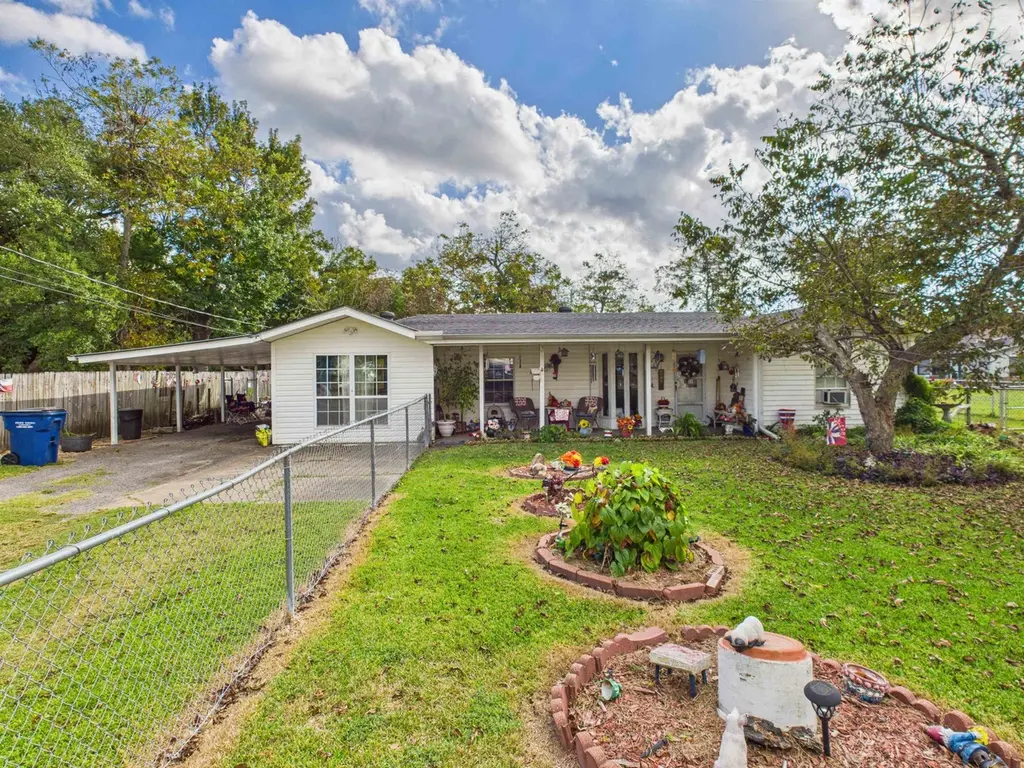
Welcome home to this charming 2-bedroom, 2-bath property that’s perfect for a first-time home buyer or an investor looking for a solid opportunity. This cozy home offers a spacious living area with warm wood accents and a wood-burning stove that adds character and comfort. The inviting covered front porch is ideal for relaxing outdoors, while the fenced yard provides space for pets, gardening, or play. Enjoy established landscaping, plenty of natural light, and a layout that feels open and welcoming. With great potential and classic charm, this home is ready for its next owner to make it their own.
Key facts
- Covered front porch
- Fenced yard
- Wood accents
Tags
Neighborhood map
What this means for you Summary
Snapshot
- This is a 2-bed/2.0-bath single-family listed at $100k.
Deal economics
- At list price, monthly cash flow is $260 ($3k/yr) — positive.
- The deal already cash-flows at list — no discount required.
- Meets the 1% rule at list price ($1k rent vs $100k).
- Recommended offer: $94k (6.0% below list) — sets the bar for market timing.
Location & tenants
- Location reads 60/100 on livability (#1,075 in TX) — a middle-class / working-renter tenant base. Strengths: cost of living A+, housing A, health & safety A; Watch: crime C-, schools D-, amenities F.
- West Orange-Cove CISD (suburban): math 17% / reading 21% proficiency, ranked #784 of 826 in TX (top 95%) — low school quality limits family demand, transient renter base, plan for 1-2y turnover; 79% free/reduced lunch — lower-income household profile, screen leases tightly.
- Market conditions: Rents rising fast (+5.7%/yr); 337 active listings in the ZIP; 4 comparable units currently listed for rent nearby; rentals at typical pace (median 14d on market — plan ~3-4 weeks tenant-placement turnaround); 235 units permitted in Orange County in 2024 (50 in 5+ unit buildings).
Forward outlook
- In year one you build about $2k of equity ($691 loan paydown + $1k appreciation (1.0% local appreciation)).
- Orange County population projected at +6% by 2050 — modest demand growth; plan on rents tracking national, not racing it.
- At projected returns (1.0% appreciation + 5.7% rent growth), your $28k cash investment doubles in ~5 years — after that, you're playing with house money.
Negotiation context
- It's been on market 80 days — a 6% lower offer ($94k) is reasonable based on typical stale-listing flexibility.
Risks & watch-outs
- Watch-outs: property tax is 2.5% of price; flood insurance adds $66/mo; built in 1957 — expect roof / HVAC / electrical / plumbing capex.
- Climate carrying-cost: severe flood risk; severe wind risk, 99% chance of damaging wind over 30y; extreme-heat days projected 7→23/yr by 2055 (HVAC capex compounding) — expect insurance premiums to compound above CPI over the hold.
Questions for the listing agent
- It's been on market 80 days. Have you received any prior offers? Is the seller open to a 6% concession, seller financing, or rate buy-down credit?
- Built in 1957 — when were the roof, HVAC, electrical panel, plumbing, and water heater last replaced?
- Property tax is high relative to price — has the assessment been appealed recently, and will the sale trigger a re-assessment?
- What's the actual annual flood-insurance premium (NFIP or private), and is the property in a SFHA with mandatory coverage?
- Why hasn't it sold? Are there any deal-killer items the seller is aware of (foundation, flood, title, zoning, code violations)?
- Is there a deadline driving the sale (1031 exchange, divorce, estate, relocation)? That informs how much negotiation room exists.
- Schools are D-rated, which usually means shorter tenancies and higher turnover. Who's the typical renter profile here, and what's been the actual vacancy rate?
- What's the average days-on-market for RENTAL listings here right now (not sales)? A rising rental-DOM trend means longer vacancies and softer asking-rent achievability than the comps imply.
- What's the recent tenant-quality profile in this submarket — average credit score on applications, eviction rate, late-payment / NSF rate, and stable-employment percentage? A property-management company in the area should have these aggregated.
- How much new for-sale + rental construction is in the pipeline within 1–3 miles? Heavy new supply typically softens prices + rents 12–24 months out; constrained supply supports both.
Investment metrics
- 1% rule
- 1.40% ✓
- Cap rate
- 10.21%
- Cash-on-cash
- 14.00%
- DSCR
- 1.62
- GRM
- 6.0
CMA / ARV
- ARV (median comp)
- $144,673
- List price
- $100,000
- Delta
- -30.88%
- Verdict
- UNDERPRICED
- Comps
- 7 within 1.0 mi
Show comp detail 3 sales within ~0.75 mi
| Address | Dist | Beds/Ba | Sqft | Sold | Price | $/sf | Match |
|---|---|---|---|---|---|---|---|
| 2911 Kelly St | 0.13mi | 3/2.0 (+1) | 1,392 (-11%) | 18mo | $149,900 | $108 | 54 |
| 3012 Hogg St | 0.12mi | 3/1.0 (+1) | 1,804 (+15%) | 13mo | $89,999 | $50 | 50 |
| 1907 Irving St | 0.45mi | 3/1.5 (+1) | 1,728 (+10%) | 18mo | $179,900 | $104 | 40 |
Match score weights: distance 35% · size 25% · config 20% · recency 20%. Top-matched comps best support the ARV.
Projected returns pro-forma
1.01% appreciation · 5.71% rent growth · sell at horizon
- IRR
- 15.4%
- Equity multiple
- 1.80×
- Total profit
- $22,510
- Equity at exit
- $34,190
- IRR
- 20.8%
- Equity multiple
- 3.76×
- Total profit
- $77,195
- Equity at exit
- $45,475
Cash invested: $28,000 (down + closing). Projections, not guarantees.
Landlord ↔ Tenant lean methodology
- Overall (STATE)
- 87 Strongly Landlord-Friendly
- State Texas
- 87 Strongly Landlord-Friendly · R+5
- County
- — inherits STATE
- City
- — inherits STATE
ZIP-level market 77630
- Home prices YoY
- 0.4%
- Rents YoY
- 5.7%
- Active inventory
- 337
- Price-to-rent
- 6.0×
Monthly cashflow live
- Estimated rent
- $1,396 medium interval (Pro) →
- Mortgage (P&I)
- −$524
- Tax from tax record
- −$210 /mo · $2,520/yr
- Insurance
- −$42
- Flood insurance flood zone
- −$66 /mo · $798/yr
- HOA
- −$0
- Vacancy / Maint / Mgmt
- −$293
- Net cashflow
- $260
Break-even live
UW: 25.0% down · 7.5% · 30yr · 1.5% tax · 5.0% vac · 8.0% maint · 8.0% mgmt
Financing live
Cash to close
- Down payment
- $25,000
- Closing costs
- $3,000
- Reserves months
- —
- Total cash needed
- —
Loan-product check · same deal, 3 products live
Conventional
25% down · 7.5% · 30yr
- Down + closing
- —
- Monthly P&I
- —
- Monthly cashflow
- —
- DSCR
- —
- Eligible?
- —
Personal DTI + credit; lowest rate.
DSCR
20% down · 8.5% · 30yr
- Down + closing
- —
- Monthly P&I
- —
- Monthly cashflow
- —
- DSCR
- —
- Eligible?
- —
No personal income docs; deal must DSCR.
Hard money
10% down · 12.0% · 12mo
- Down + closing
- —
- Monthly P&I
- —
- Monthly cashflow
- —
- DSCR
- —
- Eligible?
- —
Short-term bridge; refi at stabilization.
Rent comps 4 comps
| Address | Beds | Baths | Sqft | Rent | $/sqft | DOM | Units | Dist |
|---|---|---|---|---|---|---|---|---|
| 2810 Gandy St West Orange, TX | 3.0 | 2.0 | 1613 | $1,700 | $1.05 | 44d | 1 | 0.60mi |
| 1543 Alamo St West Orange, TX | 3.0 | 1.0 | 1170 | $1,200 | $1.03 | 14d | 1 | 0.95mi |
| 309 Quincy St West Orange, TX | 3.0 | 1.5 | 1113 | $1,200 | $1.08 | 14d | 1 | 1.11mi |
| 305 Rhode Island St Orange, TX | 3.0 | 2.0 | 1430 | $1,575 | $1.10 | 13d | 1 | 1.48mi |
Listing history 18 events
-
2026-06-18status $100,000 Pending 80 DOM
-
2026-06-18days on market $100,000 Active 80 DOM
-
2026-06-17days on market $100,000 Active 79 DOM
-
2026-06-16days on market $100,000 Active 78 DOM
-
2026-06-15days on market $100,000 Active 77 DOM
-
2026-06-14days on market $100,000 Active 75 DOM
-
2026-06-13days on market $100,000 Active 74 DOM
-
2026-06-10days on market $100,000 Active 72 DOM
-
2026-06-09days on market $100,000 Active 71 DOM
-
2026-06-08days on market $100,000 Active 70 DOM
-
2026-06-07days on market $100,000 Active 69 DOM
-
2026-06-03days on market $100,000 Active 65 DOM
-
2026-06-02days on market $100,000 Active 64 DOM
-
2026-06-01days on market $100,000 Active 63 DOM
-
2026-05-31days on market $100,000 Active 62 DOM
-
2026-05-30days on market $100,000 Active 61 DOM
-
2026-03-30$100,000 Active 611-char remark
Show marketing remark (611 chars)
Welcome home to this charming 2-bedroom, 2-bath property that’s perfect for a first-time home buyer or an investor looking for a solid opportunity. This cozy home offers a spacious living area with warm wood accents and a wood-burning stove that adds character and comfort. The inviting covered front porch is ideal for relaxing outdoors, while the fenced yard provides space for pets, gardening, or play. Enjoy established landscaping, plenty of natural light, and a layout that feels open and welcoming. With great potential and classic charm, this home is ready for its next owner to make it their own.
-
2026-03-11price $100,000
ⓘ Source: listings_history table (triggers on properties + properties_extension) + one-shot
backfill from property_details.listing_events for pre-trigger history.
Tax reassessment forecast TX · Resets to sale price
- Current annual tax
- $2,520 · $210/mo
- Projected year-2 tax
- $2,520 · $210/mo
- Expected delta
- $0/yr ($0/mo · 0.0%)
ⓘ Screening estimate from a state-policy table — verify with the county assessor before closing.
Climate risk First Street
- Flood 8/10 Severe FEMA zone X (shaded) · 97% chance over 30 yrs
- Wildfire 1/10 Low
- Heat 9/10 Extreme 7 d/yr ≥109°F today · 23 d/yr by 30 yrs out
- Wind 9/10 Extreme 99% chance of damaging wind over 30 yrs
- Air quality 2/10 Low 1 unhealthy d/yr today · 1 by 30 yrs out
Nearby sold comps map
Loading sold comps map…
Walkable amenities ~0.75 mi
Loading nearby amenities…
Taxation est. · year 1
- Rental income
- $16,749
- − Mortgage interest
- −$5,602
- − Property taxes
- −$2,520
- − Insurance
- −$1,298
- − Repairs & maintenance
- −$1,340
- − Management
- −$1,340
- − Depreciation
- −$2,909
- Taxable income
- $1,741
- Est. tax owed @ 24.0%
- −$418
- After-tax cash flow
- $2,704/yr
For passive investors: Depreciation is non-cash, so a rental often shows a tax loss while cash-flowing — sheltering income. Rental losses are passive: they offset passive income freely, and up to $25,000/yr can offset ordinary (W-2) income if you actively participate and your MAGI is under $100k (phasing out to $0 by $150k); unused losses carry forward. On sale, claimed depreciation is recaptured at up to 25%, and gains may owe capital-gains tax (a 1031 exchange can defer both). Figures are a year-1 estimate at your 24.0% rate — not tax advice; consult a CPA.
Schools (NCES district)
- District
- West Orange-Cove CISD
- NCES district ID
- 4845090
- Math proficiency
- 17% ▼ -7.00%
- Reading proficiency
- 21% ▼ -2.00%
- Median HH income
- $37,329
- Composite
- 15.86/100
- National rank
- #9260
- State rank
- #784 of 826 in TX
Livability — West Orange
- Score
- 60/100
- State rank
- #1075
- US rank
- #19069
Category grades
Schools grade is shown separately in the Schools card above.
Census & demographics
- Census place
- West Orange, TX
- County
- Orange County · 87,112 people
- Metro
- Beaumont-Port Arthur, TX
- Population (ZIP)
- 28,983
- Household income
- $64,373
- Rent vs Own
- Severe rent burden
- 1018.0
Population outlook (Orange County) Hauer SSP2
- Today (2025)
- 88,065 people
- By 2030
- 89,591 · +1.7%
- By 2040
- 91,982 · +4.4%
- By 2050
- 93,023 · +5.6%
- By 2075
- 94,871 · +7.7%
- By 2100
- 88,155 · +0.1%
Race, ethnicity, and origin ACS 2023
- Neighborhood character
- Majority White (64%)
- Race & ethnicity
- White 64% Black 21% Hispanic / Latino 11% Two or more races 9%
- Hispanic origin (detail)
- Mexican 7%
- Common ancestry
- Lithuanian 13% Italian 1% Slovak 1%
- Foreign-born
- 5% · Canada
- Languages at home
- 91% English-only · Spanish 7% French/Haitian/Cajun 1% Other Asian/Pacific 1%
Political lean MEDSL · Orange
- 2024 margin
- Solid R (+66.8) · D 16.4% · R 83.1%
- 2008→2024 swing
- -19.6pp toward R · 2008: -47.1pp · 2024: -66.8pp
- All cycles
- 2024: R+66.8 2020: R+63.4 2016: R+61.9 2012: R+54.3 2008: R+47.1
Not yet ingested
- Civics
- —
Market trends
- HPI YoY
- ▲ 1.01%
- Current HPI
- 264.14
- Rent YoY
- ▲ 5.71%
- Metro
- Beaumont-Port Arthur, TX
- State GDP YoY
- ▲ 3.95%
- F500 in state
- 110
Industry mix (Fortune 500 HQ in TX)
| Industry | F500 HQs | Revenue |
|---|---|---|
| Energy | 16 | $1,198B |
|
||
| Technology | 5 | $198B |
|
||
| Engineering / Construction | 4 | $72B |
|
||
| Energy Services | 3 | $60B |
|
||
| Utilities | 3 | $41B |
|
||
| Healthcare | 2 | $330B |
|
||
Price history
+0.0% since first listed2 events — show timeline
- 2026-03-30 Listed $100,000 BBOR
- 2026-03-11 Price Changed $100,000 BBOR
Property tax history
+2.7%/yrLatest (2025): $2,520 · +6.4% YoY. Source: county tax records.
Cash-flow waterfall
monthlySold comps — $/sqft
last 12 mo · ≤1 miLoading sold comps…