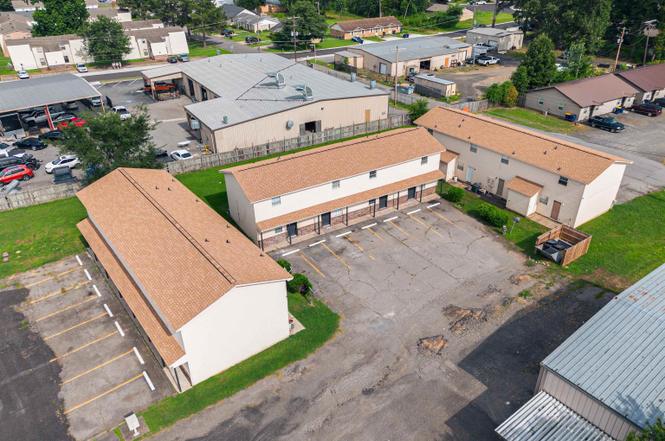
 12-Plex
1099 W Elm St · Cabot, AR
Flood risk 1/10 · Minimal
- FEMA flood zone
- X (unshaded)
- Chance of flooding over 30 yrs
- 0.0%
- Est. flood insurance / yr
- $507 – $1,088
Fire risk 4/10 · Minor
- Est. fire insurance / yr
- $1,499 – $2,785
Heat risk 6/10 · Moderate
- Hot days now (above 109°F)
- 7 days/yr
- Hot days in 30 yrs
- 18 days/yr
Wind risk 3/10 · Minor
- Chance of severe wind over 30 yrs
- 7.0%
Air-quality risk 2/10 · Minimal
- Unhealthy air days now
- 1 days/yr
- Unhealthy air days in 30 yrs
- 1 days/yr
Risk factors via First Street. Map © Google.
Why this score? — see what drove the C+ grade
The composite is a weighted blend of 9 inputs, each scored 0–100. Each bar is that input's sub-score; the figure is the points it added to the 100-point composite (weight × sub-score).
- Cash flow +25.3/30.0
- DSCR +8.3/10.0
- ARV discount +7.5/15.0
- 1% rule +6.6/10.0
- Schools +4.0/10.0
- Livability +3.9/5.0
- Rent growth +3.3/5.0
- Condition / age +2.5/5.0
- Appreciation +0.0/10.0
$1,150,000
🖨 Deal sheet 📄 Offer letter ✓ Due diligence
Multi-family units
County records classify this as Multi-Family (5+ Unit). Listing-text estimate: 12 units. confirmed
5+ unit building — per-unit beds/baths from public records are typically unavailable; the breakdown below (if shown) is an estimate from the listing text.
Listing remarks MLS
Great Investment Opportunity!! 12 units, fully occupied. 3 buildings with 4 townhomes each. Several units have been remodeled with fresh paint, new carpet, and new appliances. All 3 buildings have new roofs in 2022. Exterior has been power washed. All Hvac systems have been serviced within past 12 months. This is a turn key investment. See agent remarks.
Key facts
- Updated appliances
- 12 unit multifamily
- Townhome style units
Tags
Property features AI
Finance
- Financial info: Yearly lease type; Tenant pays all utilities; Owner pays taxes; Twelve units with 2-bedroom rents listed at $900
Exterior
- Parking: Parking for 4+ cars; Parking pads
- Utilities: Electric (Co-Op); Public water; Public sewer
- Home design: Commercial-zoned multi-unit building; Approx. 1.85 acres
- Construction: Metal/vinyl siding; Architectural shingle roof; Slab foundation; Approximate building size 9,600
- Exterior features: Partially fenced; Paved road access; Inside city limits; Level lot; Not in a subdivision
Interior
- Kitchen: Free-standing stove; Electric range; Dishwasher; Disposal
- Bedrooms: Twelve 2-bedroom units
- Flooring: Luxury vinyl; Tile
- Heating & cooling: Central electric heat; Central electric cooling
- Interior features: Washer connection; Dryer connection (electric); Electric hot water heater; Smoke detector; Ceiling fan
- Laundry & utility: Washer connection; Dryer connection (electric)
Neighborhood map
What this means for you Summary
Snapshot
- This is a 12 × 2-bed/1.5-bath units multifamily listed at $1.15M.
Deal economics
- At list price, monthly cash flow is $3k ($31k/yr) — positive. Per door: $216/mo.
- The deal already cash-flows at list — no discount required.
- Meets the 1% rule at list price ($13k rent vs $1.15M).
- Cap rate 9.0% vs local median 4.6% in Cabot — top-decile yield for the area; either an underpriced asset or a hidden risk that comps aren't pricing in. Stress-test before assuming the spread holds.
Location & tenants
- Location reads 78/100 on livability (#6 in AR, #2,695 nationally) — a middle-class / working-renter tenant base. Strengths: cost of living A+, housing A+, health & safety A+; Watch: commute F.
- Cabot School District (suburban): math 48% / reading 43% proficiency, ranked #29 of 238 in AR (top 12%) — families likely to look elsewhere, expect single-tenant / working-renter base with shorter leases.
- Market conditions: Rents rising (+3.2%/yr); 334 active listings in the ZIP; solid renter incomes; 185 units permitted in Lonoke County in 2024 (0 in 5+ unit buildings).
- At $13,347/mo this rent would consume 208% of the median local household income ($77k/yr) (locally 939% of renters already pay >50% of income on rent) — very limited rent-growth headroom before tenants either downsize or default.
Forward outlook
- Local home prices are declining (-3.0%/yr); year-one equity from $8k of loan paydown is wiped out by about $34k of value loss. Plan a longer hold.
- Lonoke County population projected at +12% by 2050 — modest demand growth; plan on rents tracking national, not racing it.
Negotiation context
- Only 9 days on market — expect competitive offers; lowballing is unlikely to land.
- 2 sale attempts since 3y ago with the ask held roughly flat each time — persistent listings suggest the price (not the market) is what's stuck; bring a comps-based counter.
- Current owner paid $900k; 28% above their basis — modest negotiation headroom, anchor on the comps not their cost.
Risks & watch-outs
- Climate carrying-cost: extreme-heat days projected 7→18/yr by 2055 (HVAC capex compounding) — expect insurance premiums to compound above CPI over the hold.
Questions for the listing agent
- Can we see the unit-by-unit rent roll, current vacancy, and any below-market leases? What's the average tenancy length?
- What capital expenditures (roof, boiler, parking lot, exteriors) have been made in the last 5 years, and what's planned in the next 2?
- Is there a deadline driving the sale (1031 exchange, divorce, estate, relocation)? That informs how much negotiation room exists.
- What's the average days-on-market for RENTAL listings here right now (not sales)? A rising rental-DOM trend means longer vacancies and softer asking-rent achievability than the comps imply.
- What's the recent tenant-quality profile in this submarket — average credit score on applications, eviction rate, late-payment / NSF rate, and stable-employment percentage? A property-management company in the area should have these aggregated.
- How much new apartment / multifamily construction is in the pipeline within 1–3 miles? Heavy new supply (>2% of stock underway) typically softens rents 12–24 months out; light construction supports rent growth.
Investment metrics
- 1% rule
- 1.16% ✓
- Cap rate
- 9.00%
- Cash-on-cash
- 9.68%
- DSCR
- 1.43
- GRM
- 7.2
CMA / ARV
No comps found within radius.
Projected returns pro-forma
-3.0% appreciation · 3.19% rent growth · sell at horizon
- IRR
- -1.5%
- Equity multiple
- 0.94×
- Total profit
- $-18,204
- Equity at exit
- $171,469
- IRR
- 8.4%
- Equity multiple
- 1.65×
- Total profit
- $208,460
- Equity at exit
- $99,431
Cash invested: $322,000 (down + closing). Projections, not guarantees.
Landlord ↔ Tenant lean methodology
- Overall (STATE)
- 92 Strongly Landlord-Friendly
- State Arkansas
- 92 Strongly Landlord-Friendly · R+14
- County
- — inherits STATE
- City
- — inherits STATE
ZIP-level market 72023
- Home prices YoY
- -13.8%
- Rents YoY
- 3.2%
- Active inventory
- 334
- Price-to-rent
- 86.2×
Monthly cashflow live
- Estimated rent
- $13,347 medium interval (Pro) →
- Mortgage (P&I)
- −$6,031
- Tax est. 1.5%
- −$1,438 /mo · $17,250/yr
- Insurance
- −$479
- HOA
- −$0
- Vacancy / Maint / Mgmt
- −$2,803
- Net cashflow
- $2,597
Break-even live
12-unit breakdown (identical units grouped — click to expand)
| Units | Beds | Baths | Est. rent |
|---|---|---|---|
| 12× units | 2 | 1.5 | $13,344 |
| #1 | 2 | 1.5 | $1,112 |
| #2 | 2 | 1.5 | $1,112 |
| #3 | 2 | 1.5 | $1,112 |
| #4 | 2 | 1.5 | $1,112 |
| #5 | 2 | 1.5 | $1,112 |
| #6 | 2 | 1.5 | $1,112 |
| #7 | 2 | 1.5 | $1,112 |
| #8 | 2 | 1.5 | $1,112 |
| #9 | 2 | 1.5 | $1,112 |
| #10 | 2 | 1.5 | $1,112 |
| #11 | 2 | 1.5 | $1,112 |
| #12 | 2 | 1.5 | $1,112 |
| Total (12 units) | $13,347 | ||
UW: 25.0% down · 7.5% · 30yr · 1.5% tax · 5.0% vac · 8.0% maint · 8.0% mgmt
Financing live
Cash to close
- Down payment
- $287,500
- Closing costs
- $34,500
- Reserves months
- —
- Total cash needed
- —
Loan-product check · same deal, 3 products live
Conventional
25% down · 7.5% · 30yr
- Down + closing
- —
- Monthly P&I
- —
- Monthly cashflow
- —
- DSCR
- —
- Eligible?
- —
Personal DTI + credit; lowest rate.
DSCR
20% down · 8.5% · 30yr
- Down + closing
- —
- Monthly P&I
- —
- Monthly cashflow
- —
- DSCR
- —
- Eligible?
- —
No personal income docs; deal must DSCR.
Hard money
10% down · 12.0% · 12mo
- Down + closing
- —
- Monthly P&I
- —
- Monthly cashflow
- —
- DSCR
- —
- Eligible?
- —
Short-term bridge; refi at stabilization.
Listing history 7 events
-
2026-06-18days on market $1,150,000 Active 9 DOM
-
2026-06-17days on market $1,150,000 Active 8 DOM
-
2026-06-16statusdays on market $1,150,000 Active 7 DOM
-
2026-06-15days on market $1,150,000 New Listing 6 DOM
-
2026-06-14days on market $1,150,000 New Listing 4 DOM
-
2026-06-10remarks 465-char remark
-
2026-06-10$1,150,000 New Listing 1 DOM
ⓘ Source: listings_history table (triggers on properties + properties_extension) + one-shot
backfill from property_details.listing_events for pre-trigger history.
Climate risk First Street
- Flood 1/10 Low FEMA zone X (unshaded) · 0% chance over 30 yrs
- Wildfire 4/10 Moderate
- Heat 6/10 Major 7 d/yr ≥109°F today · 18 d/yr by 30 yrs out
- Wind 3/10 Moderate 7% chance of damaging wind over 30 yrs
- Air quality 2/10 Low 1 unhealthy d/yr today · 1 by 30 yrs out
Nearby sold comps map
Loading sold comps map…
Walkable amenities ~0.75 mi
Loading nearby amenities…
Taxation est. · year 1
- Rental income
- $160,164
- − Mortgage interest
- −$64,418
- − Property taxes
- −$17,250
- − Insurance
- −$5,750
- − Repairs & maintenance
- −$12,813
- − Management
- −$12,813
- − Depreciation
- −$33,455
- Taxable income
- $13,665
- Est. tax owed @ 24.0%
- −$3,280
- After-tax cash flow
- $27,881/yr
For passive investors: Depreciation is non-cash, so a rental often shows a tax loss while cash-flowing — sheltering income. Rental losses are passive: they offset passive income freely, and up to $25,000/yr can offset ordinary (W-2) income if you actively participate and your MAGI is under $100k (phasing out to $0 by $150k); unused losses carry forward. On sale, claimed depreciation is recaptured at up to 25%, and gains may owe capital-gains tax (a 1031 exchange can defer both). Figures are a year-1 estimate at your 24.0% rate — not tax advice; consult a CPA.
Schools (NCES district)
- District
- Cabot School District
- NCES district ID
- 0503750
- Math proficiency
- 48% ▼ -14.00%
- Reading proficiency
- 43% ▼ -10.00%
- Median HH income
- $55,993
- Composite
- 39.66/100
- National rank
- #3912
- State rank
- #29 of 238 in AR
Livability — Cabot
- Score
- 78/100
- State rank
- #6
- US rank
- #2695
Category grades
Schools grade is shown separately in the Schools card above.
Census & demographics
- Census place
- Cabot, AR
- County
- Lonoke County · 46,130 people
- City population
- 37,452
- Metro
- Little Rock-North Little Rock-Conway, AR
- Population (ZIP)
- 37,452
- Household income
- $76,931
- Rent vs Own
- Severe rent burden
- 939.0
Population outlook (Lonoke County) Hauer SSP2
- Today (2025)
- 78,072 people
- By 2030
- 80,673 · +3.3%
- By 2040
- 84,977 · +8.8%
- By 2050
- 87,778 · +12.4%
- By 2075
- 91,398 · +17.1%
- By 2100
- 87,858 · +12.5%
Race, ethnicity, and origin ACS 2023
- Neighborhood character
- Predominantly White (85%)
- Race & ethnicity
- White 85% Two or more races 6% Hispanic / Latino 5% Black 4% Asian 2%
- Common ancestry
- Italian 2% Lithuanian 2% Serbian 1%
- Foreign-born
- 3% · Canada, Vietnam
- Languages at home
- 96% English-only · Spanish 2%
Political lean MEDSL · Lonoke
- 2024 margin
- Solid R (+53.7) · D 22.2% · R 75.8% · Other 2.0%
- 2008→2024 swing
- -6.2pp toward R · 2008: -47.5pp · 2024: -53.7pp
- All cycles
- 2024: R+53.7 2020: R+52.8 2016: R+53.3 2012: R+50.9 2008: R+47.5
Not yet ingested
- Civics
- —
Market trends
- HPI YoY
- ▼ -29.12%
- Current HPI
- 182.3489
- Rent YoY
- ▲ 3.19%
- Metro
- Little Rock-North Little Rock-Conway, AR
- State GDP YoY
- ▲ 3.80%
- F500 in state
- 10
Industry mix (Fortune 500 HQ in AR)
| Industry | F500 HQs | Revenue |
|---|---|---|
| Retail | 1 | $681B |
|
||
| Food / Agriculture | 1 | $53B |
|
||
| Retail / Energy | 1 | $22B |
|
||
| Transportation / Logistics | 1 | $12B |
|
||
| Energy | 1 | $4B |
|
||
Price history
+219.4% since first listed7 events — show timeline
- 2026-06-09 Listed $1,150,000 CARMLS
- 2023-12-15 Sold (MLS) $900,000 CARMLS
- 2023-12-11 Pending — CARMLS
- 2023-11-20 Contingent — CARMLS
- 2023-10-16 Listed $1,000,000 CARMLS
- 2022-09-07 Sold (Public Records) $630,000 Public Records
- 2001-08-27 Sold (Public Records) $360,000 Public Records
Property tax history
+5.9%/yrLatest (2025): $2,288 · +0.0% YoY. Source: county tax records.
Cash-flow waterfall
monthlySold comps — $/sqft
last 12 mo · ≤1 miLoading sold comps…