 🏗️ New Construction
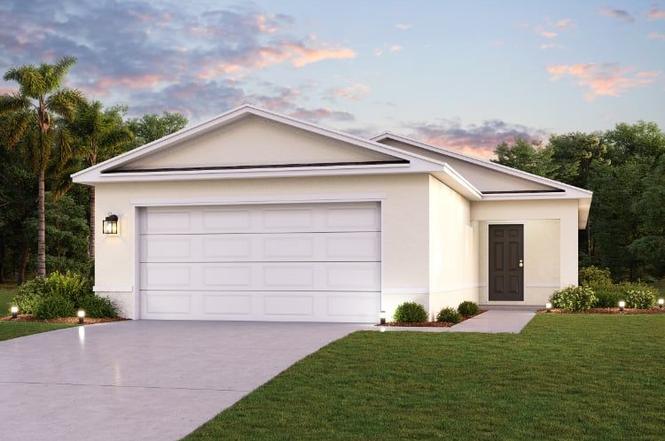
TALISON Plan · LaBelle, FL
Flood risk 4/10 · Minor
- FEMA flood zone
- X (unshaded)
- Chance of flooding over 30 yrs
- 0.24%
- Est. flood insurance / yr
- $507 – $1,088
Fire risk 4/10 · Minor
- Est. fire insurance / yr
- $947 – $1,759
Heat risk 9/10 · Severe
- Hot days now (above 109°F)
- 7 days/yr
- Hot days in 30 yrs
- 25 days/yr
Wind risk 10/10 · Severe
- Chance of severe wind over 30 yrs
- 99.0%
Air-quality risk 2/10 · Minimal
- Unhealthy air days now
- 1 days/yr
- Unhealthy air days in 30 yrs
- 2 days/yr
Risk factors via First Street. Map © Google.
Why this score? — see what drove the D+ grade
The composite is a weighted blend of 9 inputs, each scored 0–100. Each bar is that input's sub-score; the figure is the points it added to the 100-point composite (weight × sub-score).
- Cash flow +12.6/30.0
- Appreciation +10.0/10.0
- ARV discount +7.5/15.0
- DSCR +3.8/10.0
- 1% rule +3.6/10.0
- Livability +3.6/5.0
- Schools +3.1/10.0
- Rent growth +2.5/5.0
- Condition / age +2.5/5.0
$282,990
🖨 Deal sheet (PDF) 📄 Offer letter ✓ Due diligence
Key facts
- 2 garage spots
- Listed 218 days
Property features AI
Finance
- Other: Address: Friendship Cir, Labelle, FL 33935; Listing status: Active
- Financial info: List price $282,990
Exterior
- Home design: New construction plan; Single-family plan entry: TALISON
- Exterior features: Living area approximately 1409
Interior
- Bedrooms: 3 bedrooms
- Bathrooms: 2 full bathrooms
- Interior features: Plan name: TALISON
Neighborhood map
What this means for you Summary
Snapshot
- This is a 3-bed/2.0-bath single-family listed at $283k.
Deal economics
- At list price, monthly cash flow is $-29 ($-342/yr) — negative.
- To cash-flow at today's rent, offer at most $235k (16.8% below list).
- To meet the 1% rule (rent ≥ 1% of price), the offer needs to be $206k (27.2% below list).
- Recommended offer: $206k (27.2% below list) — sets the bar for 1% rule.
- Cap rate 6.1% vs local median 4.8% in LaBelle — meaningfully above typical; check what's discounted (condition, days-on-market, listing class) to confirm the premium yield is real.
Location & tenants
- Location reads 72/100 on livability (#324 in FL) — a middle-class / working-renter tenant base. Strengths: cost of living A+, housing A+, health & safety A+; Watch: schools C-, commute F, employment F.
- Hendry (town): math 35% / reading 40% proficiency, ranked #65 of 73 in FL (top 89%) — families likely to look elsewhere, expect single-tenant / working-renter base with shorter leases; 75% free/reduced lunch — lower-income household profile, screen leases tightly.
- Market conditions: 942 active listings in the ZIP; 9 comparable units currently listed for rent nearby; rentals at typical pace (median 25d on market — plan ~3-4 weeks tenant-placement turnaround); 557 units permitted in Hendry County in 2024 (45 in 5+ unit buildings).
- This rent runs 43% of the median local income ($57k/yr) — at the standard rent-burdened threshold; future hikes will face affordability resistance.
Forward outlook
- In year one you build about $26k of equity ($2k loan paydown + $24k appreciation (10.0% local appreciation)).
- Hendry County population projected to shrink 7% by 2050 — rents likely to lag national; underwrite the cash flow, not the appreciation.
- At projected returns (10.0% appreciation + 3.0% rent growth), your $67k cash investment doubles in ~3 years — after that, you're playing with house money.
- By year 2, paydown + projected appreciation supports a ~$41k cash-out refi (75% LTV) — recoverable capital for the next deal without selling this one.
Negotiation context
- It's been on market 218 days — a 12% lower offer ($249k) is reasonable based on typical stale-listing flexibility.
Risks & watch-outs
- Climate carrying-cost: severe wind risk, 99% chance of damaging wind over 30y; extreme-heat days projected 7→25/yr by 2055 (HVAC capex compounding) — expect insurance premiums to compound above CPI over the hold.
Questions for the listing agent
- What do current leases actually rent for vs. the listed asking? Can we see a recent rent roll and the last 12 months of T-12 income?
- It's been on market 218 days. Have you received any prior offers? Is the seller open to a 27% concession, seller financing, or rate buy-down credit?
- Why hasn't it sold? Are there any deal-killer items the seller is aware of (foundation, flood, title, zoning, code violations)?
- Is there a deadline driving the sale (1031 exchange, divorce, estate, relocation)? That informs how much negotiation room exists.
- The area grade is low — what's the realistic commute time and amenity access for the typical tenant pool here? Any planned neighborhood developments (good or bad) we should know about?
- What's the average days-on-market for RENTAL listings here right now (not sales)? A rising rental-DOM trend means longer vacancies and softer asking-rent achievability than the comps imply.
- What's the recent tenant-quality profile in this submarket — average credit score on applications, eviction rate, late-payment / NSF rate, and stable-employment percentage? A property-management company in the area should have these aggregated.
- How much new for-sale + rental construction is in the pipeline within 1–3 miles? Heavy new supply typically softens prices + rents 12–24 months out; constrained supply supports both.
Investment metrics
- 1% rule
- 0.86% ✗
- Cap rate
- 6.15%
- Cash-on-cash
- -0.51%
- DSCR
- 0.98
- GRM
- 9.7
CMA / ARV
- ARV (on-the-fly)
- $239,530
- Comps found
- 12
Show comp detail 12 sales within ~0.75 mi
| Address | Dist | Beds/Ba | Sqft | Sold | Price | $/sf | Match |
|---|---|---|---|---|---|---|---|
| 870 Friendship Cir | 0.11mi | 3/2.0 | 1,409 (0%) | 7mo | $239,990 | $170 | 89 |
| 864 Friendship Cir | 0.14mi | 3/2.0 | 1,409 (0%) | 6mo | $239,990 | $170 | 88 |
| 878 Friendship Cir | 0.09mi | 3/2.0 | 1,582 (+12%) | 4mo | $252,000 | $159 | 72 |
| 868 Friendship Cir | 0.12mi | 3/2.0 | 1,582 (+12%) | 5mo | $255,990 | $162 | 70 |
| 876 Friendship Cir | 0.09mi | 3/2.0 | 1,582 (+12%) | 9mo | $260,000 | $164 | 68 |
| 862 Friendship Cir | 0.15mi | 3/2.0 | 1,582 (+12%) | 12mo | $258,990 | $164 | 63 |
| 848 Friendship Cir | 0.16mi | 3/2.0 | 1,582 (+12%) | 12mo | $270,000 | $171 | 62 |
| 181 Hardee St | 0.52mi | 2/2.0 (-1) | 1,266 (-10%) | 0mo | $284,900 | $225 | 54 |
| 465 2nd Ave | 0.45mi | 3/2.0 | 1,567 (+11%) | 10mo | $298,000 | $190 | 52 |
| 623 Captain Hendry Dr | 0.69mi | 3/2.0 | 1,539 (+9%) | 7mo | $385,000 | $250 | 47 |
| 109 Florida St | 0.55mi | 3/2.5 | 1,605 (+14%) | 3mo | $350,000 | $218 | 47 |
| 851 W Lincoln Ave | 0.64mi | 3/1.0 | 1,222 (-13%) | 2mo | $90,000 | $74 | 42 |
Match score weights: distance 35% · size 25% · config 20% · recency 20%. Top-matched comps best support the ARV.
Projected returns pro-forma
10.0% appreciation · 3.0% rent growth · sell at horizon
- IRR
- 23.9%
- Equity multiple
- 2.92×
- Total profit
- $128,668
- Equity at exit
- $215,788
- IRR
- 21.2%
- Equity multiple
- 6.67×
- Total profit
- $380,398
- Equity at exit
- $465,354
Cash invested: $67,068 (down + closing). Projections, not guarantees.
Landlord ↔ Tenant lean methodology
- Overall (STATE)
- 87 Strongly Landlord-Friendly
- State Florida
- 87 Strongly Landlord-Friendly · R+3
- County
- — inherits STATE
- City
- — inherits STATE
ZIP-level market 33935
- Home prices YoY
- 16.3%
- Active inventory
- 942
- Price-to-rent
- 11.5×
Monthly cashflow live
- Estimated rent
- $2,059 high interval (Pro) →
- Mortgage (P&I)
- −$1,256
- Tax est. 1.5%
- −$299 /mo · $3,593/yr
- Insurance
- −$100
- HOA
- −$0
- Vacancy / Maint / Mgmt
- −$432
- Net cashflow
- $-29
Break-even live
Sensitivity live
| Price | -10% $137 | -5% $54 | +0% $-29 | +5% $-111 | +10% $-194 |
|---|---|---|---|---|---|
| Rent | -10% $-191 | -5% $-110 | +0% $-29 | +5% $53 | +10% $134 |
| Rate | -1.0pp $92 | -0.5pp $32 | base $-29 | +0.5pp $-91 | +1.0pp $-154 |
UW: 25.0% down · 7.5% · 30yr · 1.5% tax · 5.0% vac · 8.0% maint · 8.0% mgmt
Financing live
Cash to close
- Down payment
- $59,882
- Closing costs
- $7,186
- Reserves months
- —
- Total cash needed
- —
Loan-product check · same deal, 3 products live
Conventional
25% down · 7.5% · 30yr
- Down + closing
- —
- Monthly P&I
- —
- Monthly cashflow
- —
- DSCR
- —
- Eligible?
- —
Personal DTI + credit; lowest rate.
DSCR
20% down · 8.5% · 30yr
- Down + closing
- —
- Monthly P&I
- —
- Monthly cashflow
- —
- DSCR
- —
- Eligible?
- —
No personal income docs; deal must DSCR.
Hard money
10% down · 12.0% · 12mo
- Down + closing
- —
- Monthly P&I
- —
- Monthly cashflow
- —
- DSCR
- —
- Eligible?
- —
Short-term bridge; refi at stabilization.
Rent comps 9 comps
| Address | Beds | Baths | Sqft | Rent | $/sqft | DOM | Units | Dist |
|---|---|---|---|---|---|---|---|---|
| 878 Friendship Cir Labelle, FL | 3.0 | 2.0 | 1576 | $1,850 | $1.17 | 17d | 1 | 0.10mi |
| 858 Friendship Cir Labelle, FL | 3.0 | 2.0 | 1576 | $2,000 | $1.27 | 24d | 1 | 0.17mi |
| 345 3rd Ave LaBelle, FL | 3.0 | 2.0 | 1050 | $1,400 | $1.33 | 24d | 1 | 0.58mi |
| 343 3rd Ave Labelle, FL | 3.0 | 2.0 | 1050 | $1,400 | $1.33 | 24d | 1 | 0.58mi |
| 335 4th Ave Labelle, FL | 3.0 | 2.0 | 1710 | $2,000 | $1.17 | 24d | 1 | 0.62mi |
| 176 E Yeomans Ave Labelle, FL | 3.0 | 2.0 | 1000 | $1,800 | $1.80 | 15d | 1 | 1.10mi |
| 174 Village Cir Labelle, FL | 2.0 | 2.0 | 1224 | $1,600 | $1.31 | 24d | 1 | 1.12mi |
| 184 Village Cir Labelle, FL | 2.0 | 2.0 | 1239 | $2,000 | $1.61 | 4d | 1 | 1.12mi |
| 198 Park Ave Unit 198 LaBelle, FL | 2.0 | 2.0 | 1000 | $1,200 | $1.20 | 24d | 1 | 1.21mi |
Listing history 13 events
-
2026-06-18days on market $282,990 Active 218 DOM
-
2026-06-17days on market $282,990 Active 217 DOM
-
2026-06-16days on market $282,990 Active 216 DOM
-
2026-06-15days on market $282,990 Active 215 DOM
-
2026-06-13days on market $282,990 Active 212 DOM
-
2026-06-10days on market $282,990 Active 210 DOM
-
2026-06-09days on market $282,990 Active 209 DOM
-
2026-06-08days on market $282,990 Active 208 DOM
-
2026-06-07days on market $282,990 Active 207 DOM
-
2026-06-03days on market $282,990 Active 203 DOM
-
2026-06-02days on market $282,990 Active 202 DOM
-
2026-06-01days on market $282,990 Active 201 DOM
-
2026-05-31days on market $282,990 Active 200 DOM
ⓘ Source: listings_history table (triggers on properties + properties_extension) + one-shot
backfill from property_details.listing_events for pre-trigger history.
Climate risk First Street
- Flood 4/10 Moderate FEMA zone X (unshaded) · 24% chance over 30 yrs
- Wildfire 4/10 Moderate
- Heat 9/10 Extreme 7 d/yr ≥109°F today · 25 d/yr by 30 yrs out
- Wind 10/10 Extreme 99% chance of damaging wind over 30 yrs
- Air quality 2/10 Low 1 unhealthy d/yr today · 2 by 30 yrs out
Nearby sold comps map
Loading sold comps map…
Walkable amenities ~0.75 mi
Loading nearby amenities…
Taxation est. · year 1
- Rental income
- $24,711
- − Mortgage interest
- −$13,417
- − Property taxes
- −$3,593
- − Insurance
- −$1,198
- − Repairs & maintenance
- −$1,977
- − Management
- −$1,977
- − Depreciation
- −$6,968
- Taxable loss
- −$4,419
- Est. tax savings @ 24.0%
- +$1,061
- After-tax cash flow
- $718/yr
For passive investors: Depreciation is non-cash, so a rental often shows a tax loss while cash-flowing — sheltering income. Rental losses are passive: they offset passive income freely, and up to $25,000/yr can offset ordinary (W-2) income if you actively participate and your MAGI is under $100k (phasing out to $0 by $150k); unused losses carry forward. On sale, claimed depreciation is recaptured at up to 25%, and gains may owe capital-gains tax (a 1031 exchange can defer both). Figures are a year-1 estimate at your 24.0% rate — not tax advice; consult a CPA.
Schools (NCES district)
- District
- Hendry
- NCES district ID
- 1200780
- Math proficiency
- 35% ▼ -11.00%
- Reading proficiency
- 40% ▼ -4.00%
- Median HH income
- $37,043
- Composite
- 31.16/100
- National rank
- #6054
- State rank
- #65 of 73 in FL
Livability — LaBelle
- Score
- 72/100
- State rank
- #324
- US rank
- #5736
Category grades
Schools grade is shown separately in the Schools card above.
Census & demographics
- Census place
- LaBelle, FL
- County
- Hendry County · 23,186 people
- City population
- 23,186
- Metro
- Clewiston, FL
- Population (ZIP)
- 23,186
- Household income
- $57,009
- Rent vs Own
- Severe rent burden
- 498.0
Population outlook (Hendry County) Hauer SSP2
- Today (2025)
- 38,866 people
- By 2030
- 38,558 · -0.8%
- By 2040
- 37,743 · -2.9%
- By 2050
- 36,117 · -7.1%
- By 2075
- 30,070 · -22.6%
- By 2100
- 21,966 · -43.5%
Race, ethnicity, and origin ACS 2023
- Neighborhood character
- Majority Hispanic (56%)
- Race & ethnicity
- Hispanic / Latino 56% White 39% Two or more races 21% Black 2% Native American 2%
- Hispanic origin (detail)
- Mexican 40% Puerto Rican 3% Cuban 5%
- Common ancestry
- Lithuanian 2% Serbian 2% Slovak 1%
- Foreign-born
- 27% · Canada, Jamaica
- Languages at home
- 50% English-only · Spanish 50%
Political lean MEDSL · Hendry
- 2024 margin
- Solid R (+38.3) · D 30.4% · R 68.7%
- 2008→2024 swing
- -31.1pp toward R · 2008: -7.2pp · 2024: -38.3pp
- All cycles
- 2024: R+38.3 2020: R+23.0 2016: R+14.2 2012: R+5.9 2008: R+7.2
Not yet ingested
- Civics
- —
Market trends
- HPI YoY
- ▲ 75.20%
- Current HPI
- 537.4928
- Rent YoY
- —
- Metro
- Clewiston, FL
- State GDP YoY
- ▲ 3.28%
- F500 in state
- 36
Industry mix (Fortune 500 HQ in FL)
| Industry | F500 HQs | Revenue |
|---|---|---|
| Industrial Technology | 2 | $29B |
|
||
| Insurance | 2 | $17B |
|
||
| Retail | 1 | $60B |
|
||
| Technology Distribution | 1 | $58B |
|
||
| Homebuilding | 1 | $35B |
|
||
| Technology Manufacturing | 1 | $35B |
|
||
Cash-flow waterfall
monthlySold comps — $/sqft
last 12 mo · ≤1 miLoading sold comps…