1200 Tallwood Ave #305 · Hollywood, FL
Flood risk 4/10 · Minor
- FEMA flood zone
- AH
- Chance of flooding over 30 yrs
- 0.24%
- Est. flood insurance / yr
- $1,142 – $2,507
Fire risk 1/10 · Minimal
- Est. fire insurance / yr
- $947 – $1,759
Heat risk 10/10 · Severe
- Hot days now (above 105°F)
- 7 days/yr
- Hot days in 30 yrs
- 24 days/yr
Wind risk 10/10 · Severe
- Chance of severe wind over 30 yrs
- 99.0%
Air-quality risk 2/10 · Minimal
- Unhealthy air days now
- 2 days/yr
- Unhealthy air days in 30 yrs
- 2 days/yr
Risk factors via First Street. Map © Google.
Why this score? — see what drove the D+ grade
The composite is a weighted blend of 9 inputs, each scored 0–100. Each bar is that input's sub-score; the figure is the points it added to the 100-point composite (weight × sub-score).
- Cash flow +14.8/30.0
- ARV discount +7.5/15.0
- 1% rule +6.7/10.0
- DSCR +4.5/10.0
- Schools +4.1/10.0
- Livability +3.8/5.0
- Rent growth +3.1/5.0
- Condition / age +2.5/5.0
- Appreciation +0.0/10.0
$175,000
🖨 Deal sheet (PDF) 📄 Offer letter ✓ Due diligence
Listing remarks
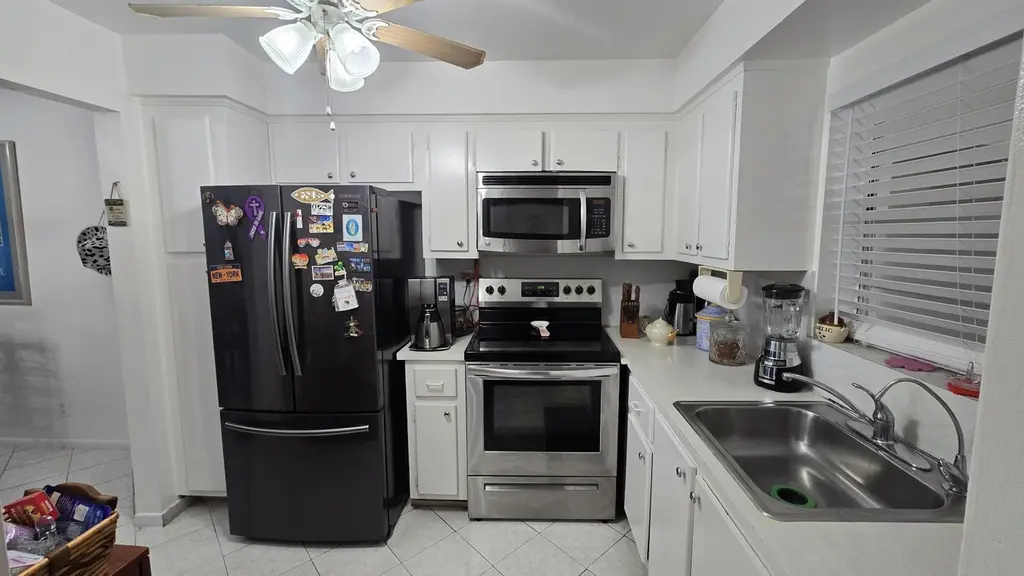
Beautifully maintained 2-bedroom, 2-bath condo in the desirable Hillcrest area of Hollywood! This bright and spacious unit features tile flooring throughout, modern appliances in the kitchen, a screened balcony, and ample storage. Conveniently located near the elevator and laundry facilities, with assigned parking plus guest parking. Enjoy a community pool and a well-kept all-ages community. Ideally situated just minutes from shopping, dining, major highways, Fort Lauderdale Airport, and the world-famous Hollywood Beach Broadwalk. A fantastic opportunity for year-round living or a seasonal retreat! 2 especial assessments one for the roof one for the elevator to be done December this year.
Key facts
- Guest parking
- Laundry facilities
- Community pool
Tags
Property features AI
Finance
- HOA & community: Community association (Tallwood); Monthly HOA fee of $485; HOA includes cable TV, water, sewer, trash, grounds maintenance, common areas, elevator, pool service and reserve funds; Association amenities: elevator(s), laundry, parking, pool, storage, trash chute
Exterior
- Parking: Two parking spaces (assigned and guest parking); One open parking space
- Utilities: Public water; Public sewer; Electricity connected
- Home design: Condominium; One level (within a three-story building); North-facing entry
- Construction: CBS construction; Concrete flat roof; Built as part of a multi-story building (3 stories total)
- Exterior features: Not waterfront; Entry on level 3
Interior
- Kitchen: Electric range; Microwave; Refrigerator
- Bedrooms: One main-level bedroom
- Flooring: Ceramic tile; Tile
- Bathrooms: Two full bathrooms (one on the main level)
- Heating & cooling: Central electric heating; Central air; Ceiling fan(s); Individual central cooling
- Interior features: Walk-in closet(s)
- Laundry & utility: Laundry room; Electric water heater
Neighborhood map
What this means for you Summary
Snapshot
- This is a 2-bed/2.0-bath condo listed at $175k.
Deal economics
- At list price, monthly cash flow is $-103 ($-1k/yr) — negative.
- To cash-flow at today's rent, offer at most $157k (10.4% below list).
- Meets the 1% rule at list price ($2k rent vs $175k).
- Recommended offer: $157k (10.4% below list) — sets the bar for cash-flow.
- Cap rate 6.6% vs local median 3.2% in Hollywood — top-decile yield for the area; either an underpriced asset or a hidden risk that comps aren't pricing in. Stress-test before assuming the spread holds.
Location & tenants
- Location reads 76/100 on livability (#232 in FL, #3,548 nationally) — a middle-class / working-renter tenant base. Strengths: commute A+, housing A+, crime B+; Watch: amenities D.
- Broward (suburban): math 42% / reading 53% proficiency, ranked #46 of 73 in FL (top 63%) — families likely to look elsewhere, expect single-tenant / working-renter base with shorter leases.
- Zoned schools: Orange Brook Elementary School (math 27% / reading 34%, grade F, #1,862 of 2,144 statewide, top 88%, 679 students, 80% FRL); Mcnicol Middle School (math 25% / reading 31%, grade F, #486 of 571 statewide, top 86%, 643 students, 80% FRL); Hallandale High School (math 10% / reading 24%, grade F, #597 of 667 statewide, top 90%, 1,104 students, 70% FRL) — zoned schools average 77% FRL vs 51% district-wide (25 pts higher); higher-poverty schools than district average — tighter screening recommended.
- Zoned-school proficiency averages 25% at this address vs 48% district-wide (-22 pts) — the specific schools serving this property underperform the Broward average; the district grade overstates school quality for this exact location.
- Market conditions: Rents rising (+2.4%/yr); 538 active listings in the ZIP; 40 comparable units currently listed for rent nearby; rentals at typical pace (median 18d on market — plan ~3-4 weeks tenant-placement turnaround); 2,111 units permitted in Broward County in 2024 (1,265 in 5+ unit buildings).
Forward outlook
- Local home prices are declining (-3.0%/yr); year-one equity from $1k of loan paydown is wiped out by about $5k of value loss. Plan a longer hold.
- Broward County population projected at +34% by 2050 — long-run rental-demand tailwind backs the buy-and-hold thesis.
Negotiation context
- It's been on market 17 days — a 2% lower offer ($172k) is reasonable based on typical stale-listing flexibility.
- 7 sale attempts since 12y ago with the ask held roughly flat each time — persistent listings suggest the price (not the market) is what's stuck; bring a comps-based counter.
- Current owner paid $115k; list at $175k implies a 52% gain — meaningful room to come down on a strong offer.
Risks & watch-outs
- Watch-outs: flood insurance adds $152/mo; HOA is 24% of rent.
- Climate carrying-cost: in FEMA flood zone AH (mandatory federal flood insurance); severe wind risk, 99% chance of damaging wind over 30y; extreme-heat days projected 7→24/yr by 2055 (HVAC capex compounding) — expect insurance premiums to compound above CPI over the hold.
Questions for the listing agent
- What do current leases actually rent for vs. the listed asking? Can we see a recent rent roll and the last 12 months of T-12 income?
- Built in 1969 — when were the roof, HVAC, electrical panel, plumbing, and water heater last replaced?
- What's the actual annual flood-insurance premium (NFIP or private), and is the property in a SFHA with mandatory coverage?
- What does the HOA fee cover, when was the last increase, and are there any pending special assessments or reserve-fund shortfalls?
- Any open or pending special assessments — roof, HVAC, plumbing, elevator, façade? What's the per-unit balance and payoff schedule, and is the seller paying it off at close or rolling it to the buyer?
- Is there a deadline driving the sale (1031 exchange, divorce, estate, relocation)? That informs how much negotiation room exists.
- The area grade is low — what's the realistic commute time and amenity access for the typical tenant pool here? Any planned neighborhood developments (good or bad) we should know about?
- What's the average days-on-market for RENTAL listings here right now (not sales)? A rising rental-DOM trend means longer vacancies and softer asking-rent achievability than the comps imply.
- What's the recent tenant-quality profile in this submarket — average credit score on applications, eviction rate, late-payment / NSF rate, and stable-employment percentage? A property-management company in the area should have these aggregated.
- How much new apartment / multifamily construction is in the pipeline within 1–3 miles? Heavy new supply (>2% of stock underway) typically softens rents 12–24 months out; light construction supports rent growth.
Investment metrics
- 1% rule
- 1.17% ✓
- Cap rate
- 6.63%
- Cash-on-cash
- 1.20%
- DSCR
- 1.05
- GRM
- 7.1
CMA / ARV
No comps found within radius.
Projected returns pro-forma
-3.0% appreciation · 2.41% rent growth · sell at horizon
- IRR
- -21.2%
- Equity multiple
- 0.27×
- Total profit
- $-35,782
- Equity at exit
- $26,093
- IRR
- -16.2%
- Equity multiple
- 0.12×
- Total profit
- $-43,103
- Equity at exit
- $15,131
Cash invested: $49,000 (down + closing). Projections, not guarantees.
Landlord ↔ Tenant lean methodology
- Overall (STATE)
- 87 Strongly Landlord-Friendly
- State Florida
- 87 Strongly Landlord-Friendly · R+3
- County
- — inherits STATE
- City
- — inherits STATE
ZIP-level market 33021
- Rents YoY
- 2.4%
- Active inventory
- 538
- Price-to-rent
- 7.1×
Monthly cashflow live
- Estimated rent
- $2,041 high interval (Pro) →
- Mortgage (P&I)
- −$918
- Tax from tax record
- −$88 /mo · $1,052/yr
- Insurance
- −$73
- Flood insurance flood zone
- −$152 /mo · $1,824/yr
- HOA
- −$485
- Vacancy / Maint / Mgmt
- −$429
- Net cashflow
- $-103
Break-even live
Sensitivity live
| Price | -10% $-4 | -5% $-53 | +0% $-103 | +5% $-153 | +10% $-202 |
|---|---|---|---|---|---|
| Rent | -10% $-264 | -5% $-184 | +0% $-103 | +5% $-22 | +10% $58 |
| Rate | -1.0pp $-15 | -0.5pp $-59 | base $-103 | +0.5pp $-148 | +1.0pp $-195 |
UW: 25.0% down · 7.5% · 30yr · 1.5% tax · 5.0% vac · 8.0% maint · 8.0% mgmt
Financing live
Cash to close
- Down payment
- $43,750
- Closing costs
- $5,250
- Reserves months
- —
- Total cash needed
- —
Loan-product check · same deal, 3 products live
Conventional
25% down · 7.5% · 30yr
- Down + closing
- —
- Monthly P&I
- —
- Monthly cashflow
- —
- DSCR
- —
- Eligible?
- —
Personal DTI + credit; lowest rate.
DSCR
20% down · 8.5% · 30yr
- Down + closing
- —
- Monthly P&I
- —
- Monthly cashflow
- —
- DSCR
- —
- Eligible?
- —
No personal income docs; deal must DSCR.
Hard money
10% down · 12.0% · 12mo
- Down + closing
- —
- Monthly P&I
- —
- Monthly cashflow
- —
- DSCR
- —
- Eligible?
- —
Short-term bridge; refi at stabilization.
Rent comps 40 comps
| Address | Beds | Baths | Sqft | Rent | $/sqft | DOM | Units | Dist |
|---|---|---|---|---|---|---|---|---|
| 1200 Tallwood Ave #302 Hollywood, FL | 2.0 | 2.0 | 840 | $2,250 | $2.68 | 25d | 1 | 0.03mi |
| 1200 Tallwood Ave #302 Hollywood, FL | 2.0 | 2.0 | 840 | $2,225 | $2.65 | 4d | 1 | 0.03mi |
| 919 Hillcrest Dr #511 Hollywood, FL | 1.0 | 1.5 | 830 | $1,700 | $2.05 | 25d | 1 | 0.08mi |
| 919 Hillcrest Dr #303 Hollywood, FL | 2.0 | 2.0 | 1100 | $2,000 | $1.82 | 25d | 1 | 0.08mi |
| 900 Tallwood Ave #207 Hollywood, FL | 1.0 | 1.0 | 640 | $1,575 | $2.46 | 21d | 1 | 0.10mi |
| 901 Hillcrest Dr #208 Hollywood, FL | 1.0 | 1.5 | 830 | $1,700 | $2.05 | 25d | 1 | 0.14mi |
| 901 Hillcrest Dr #307 Hollywood, FL | 1.0 | 1.5 | 830 | $1,750 | $2.11 | 25d | 1 | 0.14mi |
| 950 Hillcrest Dr Hollywood, FL | 1.0 | 1.5 | 775 | $1,675 | $2.16 | 16d | 2 | 0.19mi |
| 950 Hillcrest Dr Hollywood, FL | 1.0 | 1.5 | 775 | $1,675 | $2.16 | 0d | 2 | 0.19mi |
| 4700 Washington St Hollywood, FL | 1.0 | 1.5 | 775 | $1,725 | $2.23 | 0d | 4 | 0.26mi |
| 4700 Washington St Hollywood, FL | 1.0 | 1.5 | 775 | $1,725 | $2.23 | 13d | 3 | 0.26mi |
| 4802 Washington St #5 Hollywood, FL | 2.0 | 2.0 | 1080 | $2,500 | $2.31 | 25d | 1 | 0.31mi |
| 4812 Washington St #7 Hollywood, FL | 2.0 | 2.0 | 1080 | $2,200 | $2.04 | 19d | 1 | 0.33mi |
| 4812 Washington St Unit 147 Hollywood, FL | 2.0 | 2.0 | 1080 | $2,200 | $2.04 | 8d | 1 | 0.34mi |
| 981 Hillcrest Ct #114 Hollywood, FL | 2.0 | 2.0 | 899 | $2,000 | $2.22 | 25d | 1 | 0.34mi |
| 4902 Washington St #4 Hollywood, FL | 2.0 | 2.0 | 1080 | $2,650 | $2.45 | 4d | 1 | 0.37mi |
| 4902 Washington St #4 Hollywood, FL | 2.0 | 2.0 | 1080 | $2,650 | $2.45 | 13d | 1 | 0.37mi |
| 4902 Washington St #4 Hollywood, FL | 2.0 | 2.0 | 1080 | $2,750 | $2.55 | 18d | 1 | 0.37mi |
| 4917 Washington St Hollywood, FL | 1.0 | 1.0 | 600 | $1,300 | $2.17 | 8d | 1 | 0.38mi |
| 5300 Washington St Hollywood, FL | 2.0 | 1.5–2.0 | 979 | $1,795 | $1.83 | 0d | 3 | 0.57mi |
| 5300 Washington St Hollywood, FL | 2.0 | 1.5–2.0 | 979 | $1,832 | $1.87 | 6d | 3 | 0.57mi |
| 400 S Luna Ct #2 Hollywood, FL | 2.0 | 1.0 | 960 | $2,300 | $2.40 | 25d | 1 | 0.59mi |
| 3624 Jackson St Unit 21 Hollywood, FL | 2.0 | 2.0 | 1100 | $1,900 | $1.73 | 4d | 1 | 0.62mi |
| 555 S Luna Ct Hollywood, FL | 2.0 | 2.0 | 1036 | $2,120 | $2.05 | 6d | 2 | 0.62mi |
| 911 S Park Rd Hollywood, FL | 1.0–3.0 | 1.0–2.0 | 1123 | $2,715 | $2.42 | 0d | 25 | 0.63mi |
| 4420 SW 21st St West Park, FL | 3.0 | 2.0 | 1020 | $2,700 | $2.65 | 25d | 1 | 0.66mi |
| 3711 Van Buren St #2 Hollywood, FL | 1.0 | 1.0 | 660 | $1,550 | $2.35 | 25d | 1 | 0.66mi |
| 812 S Park Rd Hollywood, FL | 1.0–3.0 | 1.0–2.0 | 999 | $2,353 | $2.36 | 0d | 23 | 0.67mi |
| 570 S Park Rd Unit 13-6 Hollywood, FL | 2.0 | 2.0 | 1060 | $2,400 | $2.26 | 25d | 1 | 0.68mi |
| 3500 Jackson St Unit 203 Hollywood, FL | 2.0 | 2.0 | 875 | $1,995 | $2.28 | 25d | 1 | 0.69mi |
| 3600 Van Buren St Hollywood, FL | 1.0–2.0 | 1.0–2.0 | 1055 | $2,350 | $2.23 | 4d | 4 | 0.69mi |
| 3601 Van Buren St Hollywood, FL | 2.0 | 2.0 | 1107 | $2,195 | $1.98 | 0d | 2 | 0.71mi |
| 5500 Washington St Hollywood, FL | 1.0–3.0 | 1.0–2.0 | 1000 | $2,095 | $2.10 | 0d | 17 | 0.71mi |
| 640 S Park Rd Unit 34-4 Hollywood, FL | 2.0 | 2.0 | 1060 | $2,250 | $2.12 | 25d | 1 | 0.72mi |
| 640 S Park Rd Unit 14-4 Hollywood, FL | 2.0 | 2.0 | 1060 | $2,300 | $2.17 | 25d | 1 | 0.72mi |
| 530 S Park Rd Hollywood, FL | 1.0 | 1.0 | 841 | $1,800 | $2.14 | 25d | 1 | 0.72mi |
| 550 S Park Rd Unit 14-8 Hollywood, FL | 1.0 | 1.0 | 650 | $1,750 | $2.69 | 8d | 1 | 0.72mi |
| 640 S Park Rd Unit 14-4 Hollywood, FL | 2.0 | 2.0 | 1060 | $2,200 | $2.08 | 18d | 1 | 0.72mi |
| 530 S Park Rd Hollywood, FL | 2.0 | 2.0 | 1060 | $2,375 | $2.24 | 19d | 1 | 0.72mi |
| 450 S Park Rd Unit 5-307 Hollywood, FL | 3.0 | 2.0 | 1084 | $2,800 | $2.58 | 25d | 1 | 0.74mi |
HOA detail condo
- Monthly dues
- $485 · $5,820/yr
- Likely covers
- poolparking
- Assessments
- None detected in remarks — confirm with the listing agent.
Listing history 10 events
-
2026-06-21days on market $175,000 Active 17 DOM
-
2026-06-18days on market $175,000 Active 14 DOM
-
2026-06-17days on market $175,000 Active 13 DOM
-
2026-06-16days on market $175,000 Active 12 DOM
-
2026-06-15days on market $175,000 Active 11 DOM
-
2026-06-13days on market $175,000 Active 9 DOM
-
2026-06-09days on market $175,000 Active 5 DOM
-
2026-06-08days on market $175,000 Active 4 DOM
-
2026-06-07remarks 697-char remark
-
2026-06-07$175,000 Active 3 DOM
ⓘ Source: listings_history table (triggers on properties + properties_extension) + one-shot
backfill from property_details.listing_events for pre-trigger history.
Tax reassessment forecast FL · Resets to sale price
- Current annual tax
- $1,052 · $88/mo
- Projected year-2 tax
- $1,452 · $121/mo
- Expected delta
- +$400/yr (+$33/mo · 38.0%)
ⓘ Screening estimate from a state-policy table — verify with the county assessor before closing.
Climate risk First Street
- Flood 4/10 Moderate FEMA zone AH · 24% chance over 30 yrs
- Wildfire 1/10 Low
- Heat 10/10 Extreme 7 d/yr ≥105°F today · 24 d/yr by 30 yrs out
- Wind 10/10 Extreme 99% chance of damaging wind over 30 yrs
- Air quality 2/10 Low 2 unhealthy d/yr today · 2 by 30 yrs out
Nearby sold comps map
Loading sold comps map…
Walkable amenities ~0.75 mi
Loading nearby amenities…
Taxation est. · year 1
- Rental income
- $24,491
- − Mortgage interest
- −$9,803
- − Property taxes
- −$1,052
- − Insurance
- −$2,700
- − Repairs & maintenance
- −$1,959
- − Management
- −$1,959
- − HOA
- −$5,820
- − Depreciation
- −$5,091
- Taxable loss
- −$3,893
- Est. tax savings @ 24.0%
- +$934
- After-tax cash flow
- $-302/yr
For passive investors: Depreciation is non-cash, so a rental often shows a tax loss while cash-flowing — sheltering income. Rental losses are passive: they offset passive income freely, and up to $25,000/yr can offset ordinary (W-2) income if you actively participate and your MAGI is under $100k (phasing out to $0 by $150k); unused losses carry forward. On sale, claimed depreciation is recaptured at up to 25%, and gains may owe capital-gains tax (a 1031 exchange can defer both). Figures are a year-1 estimate at your 24.0% rate — not tax advice; consult a CPA.
Schools (NCES district)
- District
- Broward
- NCES district ID
- 1200180
- Math proficiency
- 42% ▼ -18.00%
- Reading proficiency
- 53% ▼ -5.00%
- Median HH income
- $52,139
- Composite
- 40.88/100
- National rank
- #3621
- State rank
- #46 of 73 in FL
Livability — Hollywood
- Score
- 76/100
- State rank
- #232
- US rank
- #3548
Category grades
Schools grade is shown separately in the Schools card above.
Census & demographics
- Census place
- Hollywood, FL
- County
- Broward County · 1,963,430 people
- City population
- 109,079
- Metro
- Miami-Fort Lauderdale-Pompano Beach, FL
- Population (ZIP)
- 48,464
- Household income
- $71,318
- Rent vs Own
- Severe rent burden
- 2151.0
Population outlook (Broward County) Hauer SSP2
- Today (2025)
- 2,207,033 people
- By 2030
- 2,360,704 · +7.0%
- By 2040
- 2,661,208 · +20.6%
- By 2050
- 2,946,698 · +33.5%
- By 2075
- 3,602,273 · +63.2%
- By 2100
- 3,970,984 · +79.9%
Race, ethnicity, and origin ACS 2023
- Neighborhood character
- Diverse neighborhood (Simpson 0.65)
- Race & ethnicity
- White 45% Hispanic / Latino 37% Two or more races 17% Black 13% Asian 3%
- Hispanic origin (detail)
- Puerto Rican 5% Cuban 10% Dominican 2%
- Common ancestry
- Romanian 3% Scotch-Irish 2% Hispanic 2%
- Foreign-born
- 35% · Canada, Jamaica, Dominican Republic
- Languages at home
- 53% English-only · Spanish 33% French/Haitian/Cajun 4% Russian/Polish/Slavic 2%
Political lean MEDSL · Broward
- 2024 margin
- D (+17.0) · D 58.0% · R 41.0%
- 2008→2024 swing
- -17.8pp toward R · 2008: 34.7pp · 2024: 17.0pp
- All cycles
- 2024: D+17.0 2020: D+29.8 2016: D+35.0 2012: D+34.9 2008: D+34.7
Not yet ingested
- Civics
- —
Market trends
- HPI YoY
- ▼ -404.28%
- Current HPI
- 429.7129
- Rent YoY
- ▲ 2.41%
- Metro
- Miami-Fort Lauderdale-Pompano Beach, FL
- State GDP YoY
- ▲ 3.28%
- F500 in state
- 36
Industry mix (Fortune 500 HQ in FL)
| Industry | F500 HQs | Revenue |
|---|---|---|
| Industrial Technology | 2 | $29B |
|
||
| Insurance | 2 | $17B |
|
||
| Retail | 1 | $60B |
|
||
| Technology Distribution | 1 | $58B |
|
||
| Homebuilding | 1 | $35B |
|
||
| Technology Manufacturing | 1 | $35B |
|
||
Price history
+753.7% since first listed20 events — show timeline
- 2026-06-01 Listed $175,000 Beaches MLS
- 2025-10-16 Listing Removed — MARMLS
- 2025-09-03 Listed $200,000 MARMLS
- 2023-01-31 Listing Removed — MARMLS
- 2023-01-31 Relisted — MARMLS
- 2023-01-18 Listed $180,000 MARMLS
- 2018-05-18 Listing Removed — MARMLS
- 2017-11-23 Listed $115,000 MARMLS
- 2014-06-09 Listing Removed — MARMLS
- 2014-06-09 Price Changed $115,000 MARMLS
- 2014-06-09 Price Changed $89,000 MARMLS
- 2014-06-09 Pending — MARMLS
- 2014-06-07 Relisted — MARMLS
- 2014-06-07 Price Changed $115,000 MARMLS
- 2014-05-22 Pending — MARMLS
- 2014-01-23 Listed $89,000 MARMLS
- 2004-10-05 Sold (Public Records) $115,000 Public Records
- 1997-10-21 Sold (Public Records) $49,000 Public Records
- 1997-10-21 Sold (Public Records) $49,000 Public Records
- 1977-07-01 Sold (Public Records) $20,500 Public Records
Property tax history
+0.9%/yrLatest (2025): $1,052 · +2.1% YoY. Source: county tax records.
Cash-flow waterfall
monthlySold comps — $/sqft
last 12 mo · ≤1 miLoading sold comps…