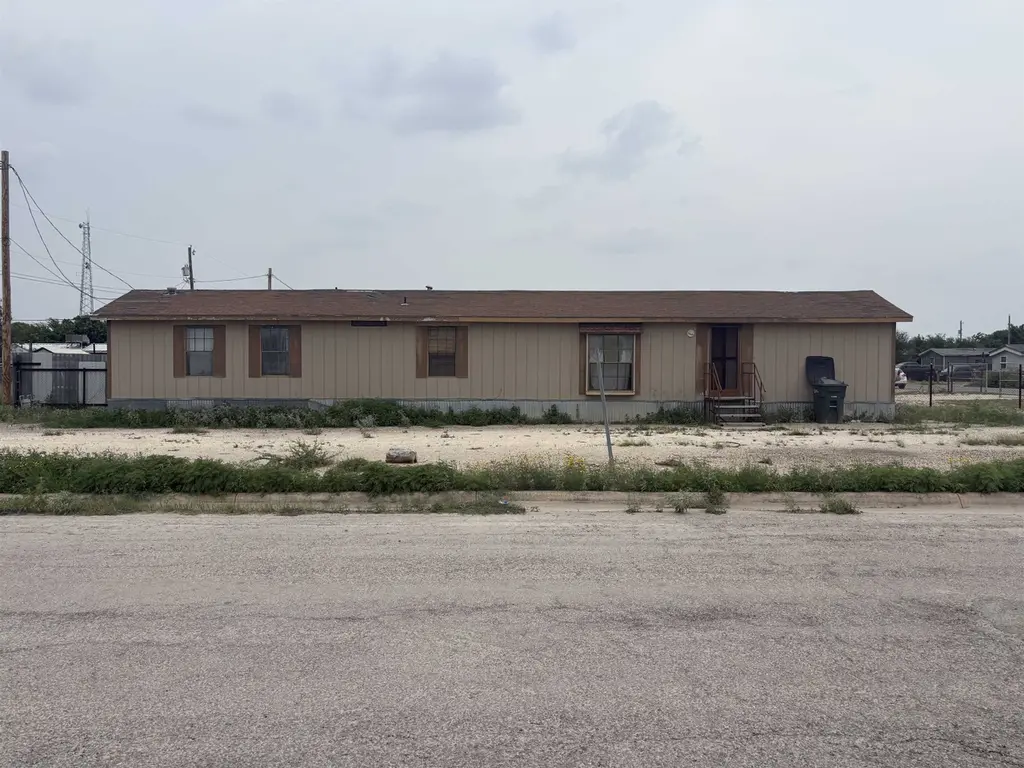
700 E Adobe St · Del Rio, TX
Flood risk 6/10 · Moderate
- FEMA flood zone
- X (unshaded)
- Chance of flooding over 30 yrs
- 0.7%
- Est. flood insurance / yr
- $507 – $1,088
Fire risk 5/10 · Moderate
- Est. fire insurance / yr
- $1,222 – $2,270
Heat risk 8/10 · Major
- Hot days now (above 108°F)
- 7 days/yr
- Hot days in 30 yrs
- 25 days/yr
Wind risk 4/10 · Minor
- Chance of severe wind over 30 yrs
- 14.0%
Air-quality risk 1/10 · Minimal
- Unhealthy air days now
- 0 days/yr
- Unhealthy air days in 30 yrs
- 0 days/yr
Risk factors via First Street. Map © Google.
Why this score? — see what drove the B- grade
The composite is a weighted blend of 9 inputs, each scored 0–100. Each bar is that input's sub-score; the figure is the points it added to the 100-point composite (weight × sub-score).
- Cash flow +30.0/30.0
- 1% rule +10.0/10.0
- DSCR +10.0/10.0
- ARV discount +7.5/15.0
- Livability +3.5/5.0
- Rent growth +2.9/5.0
- Condition / age +2.5/5.0
- Schools +2.4/10.0
- Appreciation +0.0/10.0
$69,500
🖨 Deal sheet 📄 Offer letter ✓ Due diligence
Listing remarks
Spacious mobile home with lot included! This property offers great potential for homeowners or investors looking for affordable living with room to grow. Features include a functional layout, ample outdoor space, and convenient access to schools, shopping, and local amenities. his property is full of opportunity. Schedule your showing today!
Key facts
- Access to schools
- Access to shopping
- Functional layout
Tags
Property features AI
Exterior
- Utilities: Public water; Public sewer
- Home design: Residential manufactured home on land (mobile home with land); Zoned for single-family residential
- Construction: Vinyl siding
- Exterior features: Composition roof
Interior
- Kitchen: Electric range
- Flooring: Vinyl flooring
- Bathrooms: 2 full bathrooms
- Heating & cooling: Central heating (electric); Cooling (ceiling fan(s))
- Interior features: Electric water heater; Ceiling fan(s)
Neighborhood map
What this means for you Summary
Snapshot
- This is a 2-bed/2.0-bath manufactured listed at $70k.
Deal economics
- At list price, monthly cash flow is $459 ($6k/yr) — positive.
- The deal already cash-flows at list — no discount required.
- Meets the 1% rule at list price ($1k rent vs $70k).
- Recommended offer: $68k (1.5% below list) — sets the bar for market timing.
Location & tenants
- Location reads 70/100 on livability (#349 in TX) — a middle-class / working-renter tenant base. Strengths: cost of living A+, housing A+, crime A-; Watch: health & safety C-, employment D+, amenities F.
- San Felipe-Del Rio CISD (town): math 25% / reading 32% proficiency, ranked #667 of 826 in TX (top 81%) — low school quality limits family demand, transient renter base, plan for 1-2y turnover; 70% free/reduced lunch — lower-income household profile, screen leases tightly.
- Zoned schools: Dr Fermin Calderon El (math 15% / reading 24%, grade F, #3,583 of 4,322 statewide, top 86%, 541 students, 86% FRL) — zoned schools average 86% FRL vs 70% district-wide (16 pts higher); higher-poverty schools than district average — tighter screening recommended.
- Market conditions: Rents rising (+1.6%/yr); 549 active listings in the ZIP; 3 comparable units currently listed for rent nearby; rentals lingering (median 44d on market — plan ~5-8 weeks vacancy on turnover, expect pricing pressure); 100% of comp listings sitting > 30 days — soft ceiling on asking rent; 85 units permitted in Val Verde County in 2024 (0 in 5+ unit buildings).
Forward outlook
- Local home prices are declining (-3.0%/yr); year-one equity from $481 of loan paydown is wiped out by about $2k of value loss. Plan a longer hold.
- Val Verde County population projected to shrink 9% by 2050 — rents likely to lag national; underwrite the cash flow, not the appreciation.
- At projected returns (-3.0% appreciation + 1.6% rent growth), your $19k cash investment doubles in ~5 years — after that, you're playing with house money.
Negotiation context
- It's been on market 30 days — a 2% lower offer ($68k) is reasonable based on typical stale-listing flexibility.
Risks & watch-outs
- Climate carrying-cost: major flood risk; moderate wildfire risk; extreme-heat days projected 7→25/yr by 2055 (HVAC capex compounding) — expect insurance premiums to compound above CPI over the hold.
Questions for the listing agent
- Is there a deadline driving the sale (1031 exchange, divorce, estate, relocation)? That informs how much negotiation room exists.
- Schools are D-rated, which usually means shorter tenancies and higher turnover. Who's the typical renter profile here, and what's been the actual vacancy rate?
- What's the average days-on-market for RENTAL listings here right now (not sales)? A rising rental-DOM trend means longer vacancies and softer asking-rent achievability than the comps imply.
- What's the recent tenant-quality profile in this submarket — average credit score on applications, eviction rate, late-payment / NSF rate, and stable-employment percentage? A property-management company in the area should have these aggregated.
- How much new for-sale + rental construction is in the pipeline within 1–3 miles? Heavy new supply typically softens prices + rents 12–24 months out; constrained supply supports both.
Investment metrics
- 1% rule
- 1.63% ✓
- Cap rate
- 14.22%
- Cash-on-cash
- 28.31%
- DSCR
- 2.26
- GRM
- 5.1
CMA / ARV
No comps found within radius.
Projected returns pro-forma
-3.0% appreciation · 1.55% rent growth · sell at horizon
- IRR
- 20.9%
- Equity multiple
- 1.84×
- Total profit
- $16,343
- Equity at exit
- $10,363
- IRR
- 28.2%
- Equity multiple
- 3.33×
- Total profit
- $45,354
- Equity at exit
- $6,009
Cash invested: $19,460 (down + closing). Projections, not guarantees.
Landlord ↔ Tenant lean methodology
- Overall (STATE)
- 87 Strongly Landlord-Friendly
- State Texas
- 87 Strongly Landlord-Friendly · R+5
- County
- — inherits STATE
- City
- — inherits STATE
ZIP-level market 78840
- Home prices YoY
- -33.6%
- Rents YoY
- 1.6%
- Active inventory
- 549
- Price-to-rent
- 5.1×
Monthly cashflow live
- Estimated rent
- $1,132 medium interval (Pro) →
- Mortgage (P&I)
- −$364
- Tax from tax record
- −$42 /mo · $502/yr
- Insurance
- −$29
- HOA
- −$0
- Vacancy / Maint / Mgmt
- −$238
- Net cashflow
- $459
Break-even live
UW: 25.0% down · 7.5% · 30yr · 1.5% tax · 5.0% vac · 8.0% maint · 8.0% mgmt
Financing live
Cash to close
- Down payment
- $17,375
- Closing costs
- $2,085
- Reserves months
- —
- Total cash needed
- —
Loan-product check · same deal, 3 products live
Conventional
25% down · 7.5% · 30yr
- Down + closing
- —
- Monthly P&I
- —
- Monthly cashflow
- —
- DSCR
- —
- Eligible?
- —
Personal DTI + credit; lowest rate.
DSCR
20% down · 8.5% · 30yr
- Down + closing
- —
- Monthly P&I
- —
- Monthly cashflow
- —
- DSCR
- —
- Eligible?
- —
No personal income docs; deal must DSCR.
Hard money
10% down · 12.0% · 12mo
- Down + closing
- —
- Monthly P&I
- —
- Monthly cashflow
- —
- DSCR
- —
- Eligible?
- —
Short-term bridge; refi at stabilization.
Rent comps 3 comps
| Address | Beds | Baths | Sqft | Rent | $/sqft | DOM | Units | Dist |
|---|---|---|---|---|---|---|---|---|
| 405 N Bedell Ave Del Rio, TX | 2.0–3.0 | 1.0–2.0 | 940 | $875 | $0.93 | 43d | 4 | 1.05mi |
| 113 Long Dr Del Rio, TX | 2.0 | 1.0 | 1100 | $1,300 | $1.18 | 43d | 1 | 1.13mi |
| 163 Yucca St Del Rio, TX | 2.0 | 2.0 | 850 | $746 | $0.88 | 43d | 1 | 1.49mi |
Listing history 17 events
-
2026-06-19days on market $69,500 Active 30 DOM
-
2026-06-18days on market $69,500 Active 29 DOM
-
2026-06-17days on market $69,500 Active 28 DOM
-
2026-06-16days on market $69,500 Active 27 DOM
-
2026-06-15days on market $69,500 Active 26 DOM
-
2026-06-14days on market $69,500 Active 24 DOM
-
2026-06-12days on market $69,500 Active 23 DOM
-
2026-06-09days on market $69,500 Active 20 DOM
-
2026-06-08days on market $69,500 Active 19 DOM
-
2026-06-07days on market $69,500 Active 18 DOM
-
2026-06-05days on market $69,500 Active 15 DOM
-
2026-06-03days on market $69,500 Active 14 DOM
-
2026-06-02days on market $69,500 Active 13 DOM
-
2026-06-01days on market $69,500 Active 12 DOM
-
2026-05-31days on market $69,500 Active 11 DOM
-
2026-05-30days on market $69,500 Active 10 DOM
-
2026-05-19$69,500 Active
ⓘ Source: listings_history table (triggers on properties + properties_extension) + one-shot
backfill from property_details.listing_events for pre-trigger history.
Tax reassessment forecast TX · Resets to sale price
- Current annual tax
- $502 · $42/mo
- Projected year-2 tax
- $1,272 · $106/mo
- Expected delta
- +$770/yr (+$64/mo · 153.5%)
ⓘ Screening estimate from a state-policy table — verify with the county assessor before closing.
Climate risk First Street
- Flood 6/10 Major FEMA zone X (unshaded) · 70% chance over 30 yrs
- Wildfire 5/10 Major
- Heat 8/10 Severe 7 d/yr ≥108°F today · 25 d/yr by 30 yrs out
- Wind 4/10 Moderate 14% chance of damaging wind over 30 yrs
- Air quality 1/10 Low 0 unhealthy d/yr today · 0 by 30 yrs out
Nearby sold comps map
Loading sold comps map…
Walkable amenities ~0.75 mi
Loading nearby amenities…
Taxation est. · year 1
- Rental income
- $13,586
- − Mortgage interest
- −$3,893
- − Property taxes
- −$502
- − Insurance
- −$348
- − Repairs & maintenance
- −$1,087
- − Management
- −$1,087
- − Depreciation
- −$2,022
- Taxable income
- $4,648
- Est. tax owed @ 24.0%
- −$1,115
- After-tax cash flow
- $4,394/yr
For passive investors: Depreciation is non-cash, so a rental often shows a tax loss while cash-flowing — sheltering income. Rental losses are passive: they offset passive income freely, and up to $25,000/yr can offset ordinary (W-2) income if you actively participate and your MAGI is under $100k (phasing out to $0 by $150k); unused losses carry forward. On sale, claimed depreciation is recaptured at up to 25%, and gains may owe capital-gains tax (a 1031 exchange can defer both). Figures are a year-1 estimate at your 24.0% rate — not tax advice; consult a CPA.
Schools (NCES district)
- District
- San Felipe-Del Rio CISD
- NCES district ID
- 4838900
- Math proficiency
- 25% ▼ -18.00%
- Reading proficiency
- 32% ▼ -5.00%
- Median HH income
- $40,582
- Composite
- 24.04/100
- National rank
- #7766
- State rank
- #667 of 826 in TX
Livability — Del Rio
- Score
- 70/100
- State rank
- #349
- US rank
- #7531
Category grades
Schools grade is shown separately in the Schools card above.
Census & demographics
- Census place
- Del Rio, TX
- County
- Val Verde County · 47,256 people
- City population
- 47,256
- Metro
- Del Rio, TX
- Population (ZIP)
- 47,256
- Household income
- $66,084
- Rent vs Own
- Severe rent burden
- 1111.0
Population outlook (Val Verde County) Hauer SSP2
- Today (2025)
- 48,073 people
- By 2030
- 47,468 · -1.3%
- By 2040
- 45,930 · -4.5%
- By 2050
- 43,904 · -8.7%
- By 2075
- 38,126 · -20.7%
- By 2100
- 26,217 · -45.5%
Race, ethnicity, and origin ACS 2023
- Neighborhood character
- Predominantly Hispanic (82%)
- Race & ethnicity
- Hispanic / Latino 82% Two or more races 24% White 15% Black 1%
- Hispanic origin (detail)
- Mexican 75%
- Common ancestry
- Italian 1% Lithuanian 1% Slovak 1%
- Foreign-born
- 19% · Canada
- Languages at home
- 36% English-only · Spanish 63%
Political lean MEDSL · Val Verde
- 2024 margin
- Strong R (+26.6) · D 36.2% · R 62.9%
- 2008→2024 swing
- -36.2pp toward R · 2008: 9.6pp · 2024: -26.6pp
- All cycles
- 2024: R+26.6 2020: R+9.9 2016: D+7.9 2012: D+5.4 2008: D+9.6
Not yet ingested
- Civics
- —
Market trends
- HPI YoY
- ▼ -81.95%
- Current HPI
- 161.762
- Rent YoY
- ▲ 1.55%
- Metro
- Del Rio, TX
- State GDP YoY
- ▲ 3.95%
- F500 in state
- 110
Industry mix (Fortune 500 HQ in TX)
| Industry | F500 HQs | Revenue |
|---|---|---|
| Energy | 16 | $1,198B |
|
||
| Technology | 5 | $198B |
|
||
| Engineering / Construction | 4 | $72B |
|
||
| Energy Services | 3 | $60B |
|
||
| Utilities | 3 | $41B |
|
||
| Healthcare | 2 | $330B |
|
||
Price history
1 event — show timeline
- 2026-05-19 Listed $69,500 DRBORMLS
Property tax history
+6.1%/yrLatest (2025): $502 · +0.6% YoY. Source: county tax records.
Cash-flow waterfall
monthlySold comps — $/sqft
last 12 mo · ≤1 miLoading sold comps…