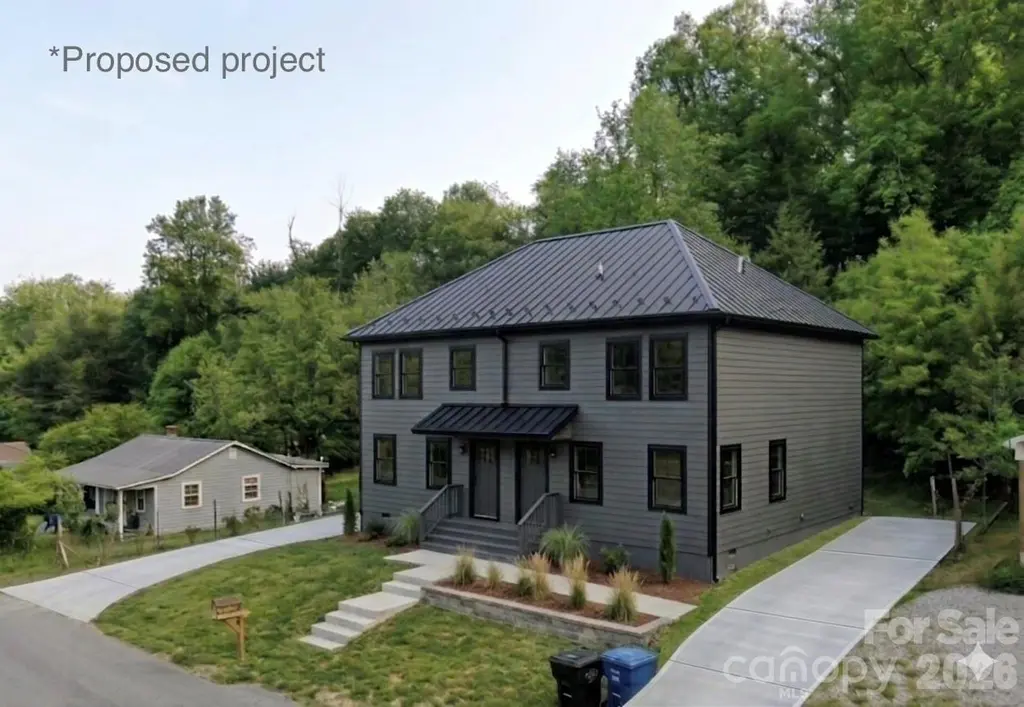
205 Frazier St · Waynesville, NC
Flood risk 6/10 · Moderate
- FEMA flood zone
- X (unshaded)
- Chance of flooding over 30 yrs
- 0.27%
- Est. flood insurance / yr
- $473 – $860
Fire risk 4/10 · Minor
- Est. fire insurance / yr
- $906 – $1,684
Heat risk 3/10 · Minor
- Hot days now (above 94°F)
- 8 days/yr
- Hot days in 30 yrs
- 23 days/yr
Wind risk 2/10 · Minimal
- Chance of severe wind over 30 yrs
- —
Air-quality risk 3/10 · Minor
- Unhealthy air days now
- 2 days/yr
- Unhealthy air days in 30 yrs
- 2 days/yr
Risk factors via First Street. Map © Google.
Why this score? — see what drove the B- grade
The composite is a weighted blend of 9 inputs, each scored 0–100. Each bar is that input's sub-score; the figure is the points it added to the 100-point composite (weight × sub-score).
- Cash flow +24.9/30.0
- ARV discount +15.0/15.0
- DSCR +8.1/10.0
- 1% rule +5.2/10.0
- Schools +4.5/10.0
- Livability +3.4/5.0
- Rent growth +2.5/5.0
- Condition / age +2.5/5.0
- Appreciation +0.0/10.0
$169,500
🖨 Deal sheet 📄 Offer letter ✓ Due diligence
Listing remarks
Exceptional Development Opportunity – 4 Unit Potential in the Heart of Waynesville! Positioned on one of the largest lots on Fraser Street, this prime 0.46-acre property offers a rare chance to capitalize on location, scale, and flexibility. Located in a rapidly growing corridor just off Highway Exit 102, the site is surrounded by major retail, restaurants, and daily conveniences—including Publix, Ingles Markets, Chick-fil-A, and Starbucks—placing future residents within minutes of everything. The property includes duplex plans tailored specifically for the lot, while current zoning allows for up to four residential units, presenting strong upside for developers and inves
Key facts
- 0.46 acre lot
- Garage
- Built 1960
Property features AI
Finance
- HOA & community: No HOA
Exterior
- Parking: Attached garage (main level)
- Utilities: City water; Public sewer
- Home design: Single-family residence; Site-built construction; One story; Crawl space foundation
- Construction: Vinyl exterior
- Exterior features: Gravel and paved road access; Publicly maintained road
Interior
- Bedrooms: Three bedrooms on the main level
- Bathrooms: One full bathroom on the main level
- Heating & cooling: No heating system listed; No cooling system listed
- Interior features: One living room (room count: 1); No built-in appliances listed
- Laundry & utility: No laundry facilities listed
Neighborhood map
What this means for you Summary
Snapshot
- This is a 3-bed/1.0-bath single-family listed at $170k.
Deal economics
- At list price, monthly cash flow is $365 ($4k/yr) — positive.
- The deal already cash-flows at list — no discount required.
- Meets the 1% rule at list price ($2k rent vs $170k).
- Recommended offer: $164k (3.0% below list) — sets the bar for market timing.
- Cap rate 8.9% vs local median 2.1% in Waynesville — top-decile yield for the area; either an underpriced asset or a hidden risk that comps aren't pricing in. Stress-test before assuming the spread holds.
Location & tenants
- Location reads 67/100 on livability (#248 in NC) — a middle-class / working-renter tenant base. Strengths: cost of living A+, housing A-; Watch: employment D+, crime F, amenities F.
- Haywood County Schools (suburban): math 55% / reading 53% proficiency, ranked #50 of 178 in NC (top 28%) — acceptable for families but not a draw, mixed tenant base, ~2y average lease.
- Zoned schools: Hazelwood Elementary (math 57% / reading 49%, grade C, #344 of 1,410 statewide, top 25%, 492 students, 99% FRL); Tuscola High (math 57% / reading 60%, grade C, #235 of 535 statewide, top 45%, 917 students, 49% FRL) — zoned schools average 74% FRL vs 49% district-wide (26 pts higher); higher-poverty schools than district average — tighter screening recommended.
- Market conditions: 291 active listings in the ZIP; 537 units permitted in Haywood County in 2024 (150 in 5+ unit buildings).
- This rent runs 35% of the median local income ($59k/yr) — at the standard rent-burdened threshold; future hikes will face affordability resistance.
Forward outlook
- Local home prices are declining (-3.0%/yr); year-one equity from $1k of loan paydown is wiped out by about $5k of value loss. Plan a longer hold.
Negotiation context
- It's been on market 44 days — a 3% lower offer ($164k) is reasonable based on typical stale-listing flexibility.
Risks & watch-outs
- Climate carrying-cost: major flood risk — expect insurance premiums to compound above CPI over the hold.
Questions for the listing agent
- It's been on market 44 days. Have you received any prior offers? Is the seller open to a 3% concession, seller financing, or rate buy-down credit?
- Built in 1960 — when were the roof, HVAC, electrical panel, plumbing, and water heater last replaced?
- Is there a deadline driving the sale (1031 exchange, divorce, estate, relocation)? That informs how much negotiation room exists.
- Schools are D-rated, which usually means shorter tenancies and higher turnover. Who's the typical renter profile here, and what's been the actual vacancy rate?
- Crime grade is F in this area — have there been break-ins, vandalism, or insurance claims at this property in the last 3 years? What carrier currently insures it and at what premium?
- What's the average days-on-market for RENTAL listings here right now (not sales)? A rising rental-DOM trend means longer vacancies and softer asking-rent achievability than the comps imply.
- What's the recent tenant-quality profile in this submarket — average credit score on applications, eviction rate, late-payment / NSF rate, and stable-employment percentage? A property-management company in the area should have these aggregated.
- How much new for-sale + rental construction is in the pipeline within 1–3 miles? Heavy new supply typically softens prices + rents 12–24 months out; constrained supply supports both.
Investment metrics
- 1% rule
- 1.02% ✓
- Cap rate
- 8.88%
- Cash-on-cash
- 9.23%
- DSCR
- 1.41
- GRM
- 8.2
CMA / ARV
- ARV (on-the-fly)
- $216,104
- Comps found
- 3
Show comp detail 3 sales within ~0.75 mi
| Address | Dist | Beds/Ba | Sqft | Sold | Price | $/sf | Match |
|---|---|---|---|---|---|---|---|
| 187 Harris St | 0.54mi | 3/1.0 | 969 (+2%) | 4mo | $220,000 | $227 | 69 |
| 1315 Russ Ave | 0.50mi | 2/1.0 (-1) | 891 (-6%) | 4mo | $257,500 | $289 | 58 |
| 106 Culpepper Dr | 0.62mi | 3/2.0 | 1,064 (+12%) | 4mo | $229,000 | $215 | 44 |
Match score weights: distance 35% · size 25% · config 20% · recency 20%. Top-matched comps best support the ARV.
Projected returns pro-forma
-3.0% appreciation · 3.0% rent growth · sell at horizon
- IRR
- -2.4%
- Equity multiple
- 0.91×
- Total profit
- $-4,293
- Equity at exit
- $25,273
- IRR
- 7.2%
- Equity multiple
- 1.55×
- Total profit
- $25,878
- Equity at exit
- $14,655
Cash invested: $47,460 (down + closing). Projections, not guarantees.
Landlord ↔ Tenant lean methodology
- Overall (STATE)
- 85 Strongly Landlord-Friendly
- State North Carolina
- 85 Strongly Landlord-Friendly · R+3
- County
- — inherits STATE
- City
- — inherits STATE
ZIP-level market 28786
- Active inventory
- 291
- Price-to-rent
- 8.2×
Monthly cashflow live
- Estimated rent
- $1,725 medium interval (Pro) →
- Mortgage (P&I)
- −$889
- Tax from tax record
- −$38 /mo · $462/yr
- Insurance
- −$71
- HOA
- −$0
- Vacancy / Maint / Mgmt
- −$362
- Net cashflow
- $365
Break-even live
UW: 25.0% down · 7.5% · 30yr · 1.5% tax · 5.0% vac · 8.0% maint · 8.0% mgmt
Financing live
Cash to close
- Down payment
- $42,375
- Closing costs
- $5,085
- Reserves months
- —
- Total cash needed
- —
Loan-product check · same deal, 3 products live
Conventional
25% down · 7.5% · 30yr
- Down + closing
- —
- Monthly P&I
- —
- Monthly cashflow
- —
- DSCR
- —
- Eligible?
- —
Personal DTI + credit; lowest rate.
DSCR
20% down · 8.5% · 30yr
- Down + closing
- —
- Monthly P&I
- —
- Monthly cashflow
- —
- DSCR
- —
- Eligible?
- —
No personal income docs; deal must DSCR.
Hard money
10% down · 12.0% · 12mo
- Down + closing
- —
- Monthly P&I
- —
- Monthly cashflow
- —
- DSCR
- —
- Eligible?
- —
Short-term bridge; refi at stabilization.
Listing history 17 events
-
2026-06-18days on market $169,500 Active 44 DOM
-
2026-06-17days on market $169,500 Active 43 DOM
-
2026-06-16days on market $169,500 Active 42 DOM
-
2026-06-15days on market $169,500 Active 41 DOM
-
2026-06-14days on market $169,500 Active 39 DOM
-
2026-06-13days on market $169,500 Active 38 DOM
-
2026-06-10days on market $169,500 Active 36 DOM
-
2026-06-09days on market $169,500 Active 35 DOM
-
2026-06-08days on market $169,500 Active 34 DOM
-
2026-06-07days on market $169,500 Active 33 DOM
-
2026-06-03days on market $169,500 Active 29 DOM
-
2026-06-02days on market $169,500 Active 28 DOM
-
2026-06-01days on market $169,500 Active 27 DOM
-
2026-05-31days on market $169,500 Active 26 DOM
-
2026-05-30days on market $169,500 Active 25 DOM
-
2026-05-14price $179,500
-
2026-05-05$195,000 Active
ⓘ Source: listings_history table (triggers on properties + properties_extension) + one-shot
backfill from property_details.listing_events for pre-trigger history.
Tax reassessment forecast NC · Resets to sale price
- Current annual tax
- $462 · $38/mo
- Projected year-2 tax
- $1,390 · $116/mo
- Expected delta
- +$928/yr (+$77/mo · 201.0%)
ⓘ Screening estimate from a state-policy table — verify with the county assessor before closing.
Climate risk First Street
- Flood 6/10 Major FEMA zone X (unshaded) · 27% chance over 30 yrs
- Wildfire 4/10 Moderate
- Heat 3/10 Moderate 8 d/yr ≥94°F today · 23 d/yr by 30 yrs out
- Wind 2/10 Low
- Air quality 3/10 Moderate 2 unhealthy d/yr today · 2 by 30 yrs out
Nearby sold comps map
Loading sold comps map…
Walkable amenities ~0.75 mi
Loading nearby amenities…
Taxation est. · year 1
- Rental income
- $20,705
- − Mortgage interest
- −$9,495
- − Property taxes
- −$462
- − Insurance
- −$848
- − Repairs & maintenance
- −$1,656
- − Management
- −$1,656
- − Depreciation
- −$4,931
- Taxable income
- $1,658
- Est. tax owed @ 24.0%
- −$398
- After-tax cash flow
- $3,983/yr
For passive investors: Depreciation is non-cash, so a rental often shows a tax loss while cash-flowing — sheltering income. Rental losses are passive: they offset passive income freely, and up to $25,000/yr can offset ordinary (W-2) income if you actively participate and your MAGI is under $100k (phasing out to $0 by $150k); unused losses carry forward. On sale, claimed depreciation is recaptured at up to 25%, and gains may owe capital-gains tax (a 1031 exchange can defer both). Figures are a year-1 estimate at your 24.0% rate — not tax advice; consult a CPA.
Schools (NCES district)
- District
- Haywood County Schools
- NCES district ID
- 3702040
- Math proficiency
- 55% ▲ 7.00%
- Reading proficiency
- 53% ▲ 2.00%
- Median HH income
- $42,715
- Composite
- 45.42/100
- National rank
- #2623
- State rank
- #50 of 178 in NC
Livability — Waynesville
- Score
- 67/100
- State rank
- #248
- US rank
- #11055
Category grades
Schools grade is shown separately in the Schools card above.
Census & demographics
- Census place
- Waynesville, NC
- County
- Haywood County · 22,056 people
- City population
- 22,056
- Metro
- Asheville, NC
- Population (ZIP)
- 22,056
- Household income
- $59,371
- Rent vs Own
- Severe rent burden
- 611.0
Population outlook (Haywood County) Hauer SSP2
- Today (2025)
- 61,607 people
- By 2030
- 62,137 · +0.9%
- By 2040
- 62,418 · +1.3%
- By 2050
- 61,578 · +-0.0%
- By 2075
- 59,137 · -4.0%
- By 2100
- 53,470 · -13.2%
Race, ethnicity, and origin ACS 2023
- Neighborhood character
- Predominantly White (89%)
- Race & ethnicity
- White 89% Two or more races 6% Hispanic / Latino 6% Black 2%
- Hispanic origin (detail)
- Mexican 2% Puerto Rican 1%
- Common ancestry
- Slovak 5% Serbian 5% Lithuanian 3%
- Foreign-born
- 3% · Canada
- Languages at home
- 97% English-only · Spanish 2%
Political lean MEDSL · Haywood
- 2024 margin
- Strong R (+25.1) · D 36.9% · R 62.0% · Other 1.1%
- 2008→2024 swing
- -17.4pp toward R · 2008: -7.8pp · 2024: -25.1pp
- All cycles
- 2024: R+25.1 2020: R+26.5 2016: R+28.0 2012: R+13.8 2008: R+7.8
Not yet ingested
- Civics
- —
Market trends
- HPI YoY
- ▼ -132.00%
- Current HPI
- 203.0776
- Rent YoY
- —
- Metro
- Asheville, NC
- State GDP YoY
- ▲ 3.28%
- F500 in state
- 26
Industry mix (Fortune 500 HQ in NC)
| Industry | F500 HQs | Revenue |
|---|---|---|
| Financial Services | 2 | $213B |
|
||
| Retail | 2 | $95B |
|
||
| Industrial Conglomerate | 1 | $38B |
|
||
| Metals / Steel | 1 | $35B |
|
||
| Utilities | 1 | $30B |
|
||
| Industrial Machinery | 1 | $19B |
|
||
Price history
-7.9% since first listed2 events — show timeline
- 2026-05-14 Price Changed $179,500 CANOPYMLS as Distributed by MLS Grid
- 2026-05-05 Listed $195,000 CANOPYMLS as Distributed by MLS Grid
Property tax history
+6.8%/yrLatest (2017): $462 · -0.5% YoY. Source: county tax records.
Cash-flow waterfall
monthlySold comps — $/sqft
last 12 mo · ≤1 miLoading sold comps…