 Duplex
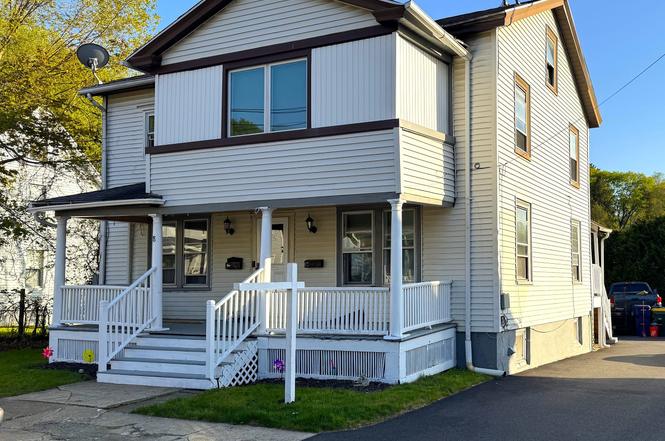
6-8 Vose St · Ansonia, CT
Flood risk 1/10 · Minimal
- FEMA flood zone
- X (unshaded)
- Chance of flooding over 30 yrs
- 0.0%
- Est. flood insurance / yr
- $473 – $860
Fire risk 2/10 · Minimal
- Est. fire insurance / yr
- $829 – $1,539
Heat risk 6/10 · Moderate
- Hot days now (above 98°F)
- 7 days/yr
- Hot days in 30 yrs
- 16 days/yr
Wind risk 6/10 · Moderate
- Chance of severe wind over 30 yrs
- 27.0%
Air-quality risk 4/10 · Minor
- Unhealthy air days now
- 4 days/yr
- Unhealthy air days in 30 yrs
- 6 days/yr
Risk factors via First Street. Map © Google.
Why this score? — see what drove the D grade
The composite is a weighted blend of 9 inputs, each scored 0–100. Each bar is that input's sub-score; the figure is the points it added to the 100-point composite (weight × sub-score).
- Cash flow +14.7/30.0
- ARV discount +7.0/15.0
- DSCR +4.5/10.0
- Rent growth +4.3/5.0
- 1% rule +3.6/10.0
- Livability +3.6/5.0
- Condition / age +2.5/5.0
- Schools +1.7/10.0
- Appreciation +0.0/10.0
$449,000
🖨 Deal sheet (PDF) 📄 Offer letter ✓ Due diligence
Multi-family units
County records classify this as Multi-Family (2-4 Unit). Listing-text estimate: 2 units. confirmed
Listing remarks
Your next investment awaits! One step unto this property and you'll see why it's such a great value! Set on a lovely street and offering 3-4 bedrooms and 2 baths, this spacious 2 family home on oversized and level lot, is a great addition for owner-occupants and investors alike. With ample parking to accommodate multiple cars, boats, RVs etc with ease including 6 spots in the driveway and a newer built oversized two car garage, you and your tenants will never have to jockey for parking. The first floor unit is well appointed, large and features 5 rooms, 2 bedrooms and 1 bath. The 2nd floor unit offers 1-2 bedrooms, 1 full bath and spans 2 levels for even more living space as well. The lower
Key facts
- 7,405 sq ft lot
- 2 garage spots
- Built 1885
Property features AI
Exterior
- Parking: Detached garage; 2-car garage; Driveway (asphalt); On-street parking; Off-street parking; Total parking for 6 vehicles
- Utilities: Public water connected; Public sewer connected; Natural gas
- Home design: Multi-family (2-family); Multi-family for sale; Frame construction
- Construction: Asphalt shingle roof; Block and brick foundation
- Exterior features: Level lot; Vinyl siding; Cream exterior color
Interior
- Bedrooms: 4 bedrooms
- Bathrooms: 2 full bathrooms
- Heating & cooling: Hot air heating; Natural gas hot water with 40-gallon tank; Wall unit cooling
- Interior features: Full basement; Walk-up attic
- Laundry & utility: Laundry in basement with basement hook-ups
Neighborhood map
What this means for you Summary
Snapshot
- This is a 2 × 2-bed/1.0-bath units multifamily listed at $449k.
Deal economics
- At list price, monthly cash flow is $113 ($1k/yr) — positive. Per door: $57/mo.
- The deal already cash-flows at list — no discount required.
- To meet the 1% rule (rent ≥ 1% of price), the offer needs to be $386k (14.1% below list).
- Recommended offer: $386k (14.1% below list) — sets the bar for 1% rule.
- Cap rate 6.6% vs local median 3.8% in Ansonia — top-decile yield for the area; either an underpriced asset or a hidden risk that comps aren't pricing in. Stress-test before assuming the spread holds.
Location & tenants
- Location reads 71/100 on livability (#87 in CT) — a middle-class / working-renter tenant base. Strengths: crime A+, health & safety A+, housing A-; Watch: employment C-, amenities F, commute F.
- Ansonia School District (suburban): math 13% / reading 25% proficiency, ranked #144 of 153 in CT (top 94%) — low school quality limits family demand, transient renter base, plan for 1-2y turnover.
- Zoned schools: Prendergast School (math 10% / reading 22%, grade F, #468 of 553 statewide, top 85%, 606 students, 67% FRL); Ansonia Middle School (math 15% / reading 29%, grade F, #158 of 175 statewide, top 90%, 537 students, 63% FRL); Ansonia High School (math 22% / reading 37%, grade F, #139 of 194 statewide, top 74%, 555 students, 60% FRL).
- Market conditions: Rents rising fast (+7.3%/yr); 52 active listings in the ZIP; 15 comparable units currently listed for rent nearby; rentals leasing fast (median 12d on market — plan ~1-2 weeks tenant-placement turnaround); solid renter incomes; 502 units permitted in Naugatuck Valley Planning Region in 2024 (171 in 5+ unit buildings).
- At $3,855/mo this rent would consume 54% of the median local household income ($86k/yr) (locally 541% of renters already pay >50% of income on rent) — very limited rent-growth headroom before tenants either downsize or default.
Forward outlook
- Local home prices are declining (-3.0%/yr); year-one equity from $3k of loan paydown is wiped out by about $13k of value loss. Plan a longer hold.
Negotiation context
- It's been on market 32 days — a 3% lower offer ($436k) is reasonable based on typical stale-listing flexibility.
- Current owner paid $190k; list at $449k implies a 136% gain — meaningful room to come down on a strong offer.
Risks & watch-outs
- Watch-outs: built in 1885 — expect roof / HVAC / electrical / plumbing capex.
- Climate carrying-cost: major wind risk, 27% chance of damaging wind over 30y; extreme-heat days projected 7→16/yr by 2055 (HVAC capex compounding) — expect insurance premiums to compound above CPI over the hold.
Questions for the listing agent
- It's been on market 32 days. Have you received any prior offers? Is the seller open to a 14% concession, seller financing, or rate buy-down credit?
- Can we see the unit-by-unit rent roll, current vacancy, and any below-market leases? What's the average tenancy length?
- What capital expenditures (roof, boiler, parking lot, exteriors) have been made in the last 5 years, and what's planned in the next 2?
- Built in 1885 — when were the roof, HVAC, electrical panel, plumbing, and water heater last replaced?
- Is there a deadline driving the sale (1031 exchange, divorce, estate, relocation)? That informs how much negotiation room exists.
- Schools are F-rated, which usually means shorter tenancies and higher turnover. Who's the typical renter profile here, and what's been the actual vacancy rate?
- The area grade is low — what's the realistic commute time and amenity access for the typical tenant pool here? Any planned neighborhood developments (good or bad) we should know about?
- What's the average days-on-market for RENTAL listings here right now (not sales)? A rising rental-DOM trend means longer vacancies and softer asking-rent achievability than the comps imply.
- What's the recent tenant-quality profile in this submarket — average credit score on applications, eviction rate, late-payment / NSF rate, and stable-employment percentage? A property-management company in the area should have these aggregated.
- How much new apartment / multifamily construction is in the pipeline within 1–3 miles? Heavy new supply (>2% of stock underway) typically softens rents 12–24 months out; light construction supports rent growth.
Investment metrics
- 1% rule
- 0.86% ✗
- Cap rate
- 6.59%
- Cash-on-cash
- 1.08%
- DSCR
- 1.05
- GRM
- 9.7
CMA / ARV
- ARV (median comp)
- $444,036
- List price
- $449,000
- Delta
- 1.12%
- Verdict
- FAIR
- Comps
- 20 within 1.0 mi
Show comp detail 8 sales within ~0.75 mi
| Address | Dist | Beds/Ba | Sqft | Sold | Price | $/sf | Match |
|---|---|---|---|---|---|---|---|
| 53 Elm St | 0.03mi | 4/2.0 (+1) | 1,984 (-2%) | 22mo | $440,000 | $222 | 72 |
| 70-72 Elm St | 0.08mi | 4/3.0 (+1) | 2,127 (+5%) | 19mo | $390,000 | $183 | 63 |
| 59 Vine St | 0.30mi | 4/2.0 (+1) | 1,768 (-13%) | 1mo | $442,000 | $250 | 59 |
| 20 Hodge Ave | 0.28mi | 4/2.0 (+1) | 2,294 (+13%) | 7mo | $465,000 | $203 | 54 |
| 19 N Spring St | 0.71mi | 4/2.0 (+1) | 2,080 (+3%) | 12mo | $355,000 | $171 | 47 |
| 91 Jewett St | 0.47mi | 4/2.0 (+1) | 1,738 (-14%) | 5mo | $395,000 | $227 | 45 |
| 40 Lewis St | 0.74mi | 3/2.0 | 1,856 (-8%) | 22mo | $255,000 | $137 | 33 |
| 51-53 Bassett St | 0.75mi | 4/3.0 (+1) | 2,136 (+6%) | 19mo | $490,000 | $229 | 31 |
Match score weights: distance 35% · size 25% · config 20% · recency 20%. Top-matched comps best support the ARV.
Projected returns pro-forma
-3.0% appreciation · 7.35% rent growth · sell at horizon
- IRR
- -10.1%
- Equity multiple
- 0.62×
- Total profit
- $-47,995
- Equity at exit
- $66,947
- IRR
- 4.3%
- Equity multiple
- 1.37×
- Total profit
- $46,351
- Equity at exit
- $38,821
Cash invested: $125,720 (down + closing). Projections, not guarantees.
Landlord ↔ Tenant lean methodology
- Overall (STATE)
- 27 Tenant-Leaning
- State Connecticut
- 27 Tenant-Leaning · D+7
- County
- — inherits STATE
- City
- — inherits STATE
ZIP-level market 06401
- Home prices YoY
- -4.7%
- Rents YoY
- 7.3%
- Active inventory
- 52
- Price-to-rent
- 19.4×
Monthly cashflow live
- Estimated rent
- $3,855 high interval (Pro) →
- Mortgage (P&I)
- −$2,355
- Tax from tax record
- −$391 /mo · $4,689/yr
- Insurance
- −$187
- HOA
- −$0
- Vacancy / Maint / Mgmt
- −$810
- Net cashflow
- $113
Break-even live
Sensitivity live
| Price | -10% $367 | -5% $240 | +0% $113 | +5% $-14 | +10% $-141 |
|---|---|---|---|---|---|
| Rent | -10% $-192 | -5% $-39 | +0% $113 | +5% $265 | +10% $418 |
| Rate | -1.0pp $339 | -0.5pp $227 | base $113 | +0.5pp $-3 | +1.0pp $-122 |
2-unit breakdown (identical units grouped — click to expand)
| Units | Beds | Baths | Est. rent |
|---|---|---|---|
| 2× units | 2 | 1 | $3,856 |
| #1 | 2 | 1 | $1,928 |
| #2 | 2 | 1 | $1,928 |
| Total (2 units) | $3,855 | ||
UW: 25.0% down · 7.5% · 30yr · 1.5% tax · 5.0% vac · 8.0% maint · 8.0% mgmt
Financing live
Cash to close
- Down payment
- $112,250
- Closing costs
- $13,470
- Reserves months
- —
- Total cash needed
- —
Loan-product check · same deal, 3 products live
Conventional
25% down · 7.5% · 30yr
- Down + closing
- —
- Monthly P&I
- —
- Monthly cashflow
- —
- DSCR
- —
- Eligible?
- —
Personal DTI + credit; lowest rate.
DSCR
20% down · 8.5% · 30yr
- Down + closing
- —
- Monthly P&I
- —
- Monthly cashflow
- —
- DSCR
- —
- Eligible?
- —
No personal income docs; deal must DSCR.
Hard money
10% down · 12.0% · 12mo
- Down + closing
- —
- Monthly P&I
- —
- Monthly cashflow
- —
- DSCR
- —
- Eligible?
- —
Short-term bridge; refi at stabilization.
Rent comps 15 comps
| Address | Beds | Baths | Sqft | Rent | $/sqft | DOM | Units | Dist |
|---|---|---|---|---|---|---|---|---|
| 57 Vine St Unit 2 Ansonia, CT | 4.0 | 1.0 | 2200 | $2,715 | $1.23 | 45d | 1 | 0.32mi |
| 91 Jewett St Unit 1st Floor Ansonia, CT | 3.0 | 1.0 | 1738 | $2,600 | $1.50 | 4d | 1 | 0.49mi |
| 100 Mount Pleasant St Derby, CT | 3.0 | 2.0 | 2027 | $2,100 | $1.04 | 21d | 1 | 0.69mi |
| 14 N Spring St Ansonia, CT | 2.0 | 1.0 | 1400 | $1,900 | $1.36 | 45d | 1 | 0.70mi |
| 168 Minerva St Unit 2 Derby, CT | 3.0 | 1.0 | 1450 | $2,100 | $1.45 | 5d | 1 | 0.85mi |
| 14 Meadow St Ansonia, CT | 3.0 | 1.0 | 2481 | $2,800 | $1.13 | 4d | 1 | 0.91mi |
| 19 Hawkins St Unit 1 Derby, CT | 3.0 | 1.0 | 2356 | $2,200 | $0.93 | 5d | 1 | 0.96mi |
| 11 7th St Unit 1 Derby, CT | 2.0 | 1.0 | 2378 | $1,900 | $0.80 | 12d | 1 | 0.97mi |
| 30 Hawkins St Derby, CT | 3.0 | 1.0 | 2370 | $1,900 | $0.80 | 13d | 1 | 0.98mi |
| 92 Smith St Derby, CT | 3.0 | 1.0 | 1722 | $2,050 | $1.19 | 16d | 1 | 0.99mi |
| 10 Summit St Unit 1st Floor Derby, CT | 2.0 | 2.5 | 1834 | $1,875 | $1.02 | 5d | 1 | 1.06mi |
| 105 Camptown St Unit 1St FL Derby, CT | 2.0 | 1.0 | 1496 | $1,700 | $1.14 | 45d | 1 | 1.10mi |
| 156 Hawthorne Ave Derby, CT | 3.0 | 2.0 | 1710 | $3,100 | $1.81 | 12d | 1 | 1.18mi |
| 130 New Haven Ave Derby, CT | 3.0 | 1.0 | 1580 | $2,000 | $1.27 | 21d | 1 | 1.35mi |
| 95 Park Ave Derby, CT | 4.0 | 1.5 | 1930 | $3,000 | $1.55 | 4d | 1 | 1.37mi |
Listing history 15 events
-
2026-06-15statusdays on market $449,000 Under Contract 32 DOM
-
2026-06-14days on market $449,000 Under Contract - Continue to Show 31 DOM
-
2026-06-10days on market $449,000 Under Contract - Continue to Show 28 DOM
-
2026-06-09days on market $449,000 Under Contract - Continue to Show 27 DOM
-
2026-06-08days on market $449,000 Under Contract - Continue to Show 26 DOM
-
2026-06-07days on market $449,000 Under Contract - Continue to Show 25 DOM
-
2026-06-03days on market $449,000 Under Contract - Continue to Show 21 DOM
-
2026-06-03days on market $449,000 Under Contract - Continue to Show 20 DOM
-
2026-06-01days on market $449,000 Under Contract - Continue to Show 19 DOM
-
2026-05-31days on market $449,000 Under Contract - Continue to Show 18 DOM
-
2026-05-14$449,000 Active 1372-char remark
-
2026-05-08historical $449,000 1372-char remark
-
2018-11-13soldstatus $189,900
-
2011-06-29soldstatus $158,000
-
1993-12-21soldstatus $87,400
ⓘ Source: listings_history table (triggers on properties + properties_extension) + one-shot
backfill from property_details.listing_events for pre-trigger history.
Tax reassessment forecast CT · Partial reset (capped growth)
- Current annual tax
- $4,689 · $391/mo
- Projected year-2 tax
- $7,149 · $596/mo
- Expected delta
- +$2,460/yr (+$205/mo · 52.5%)
ⓘ Screening estimate from a state-policy table — verify with the county assessor before closing.
Climate risk First Street
- Flood 1/10 Low FEMA zone X (unshaded) · 0% chance over 30 yrs
- Wildfire 2/10 Low
- Heat 6/10 Major 7 d/yr ≥98°F today · 16 d/yr by 30 yrs out
- Wind 6/10 Major 27% chance of damaging wind over 30 yrs
- Air quality 4/10 Moderate 4 unhealthy d/yr today · 6 by 30 yrs out
Nearby sold comps map
Loading sold comps map…
Walkable amenities ~0.75 mi
Loading nearby amenities…
Taxation est. · year 1
- Rental income
- $46,260
- − Mortgage interest
- −$25,151
- − Property taxes
- −$4,689
- − Insurance
- −$2,245
- − Repairs & maintenance
- −$3,701
- − Management
- −$3,701
- − Depreciation
- −$13,062
- Taxable loss
- −$6,288
- Est. tax savings @ 24.0%
- +$1,509
- After-tax cash flow
- $2,865/yr
For passive investors: Depreciation is non-cash, so a rental often shows a tax loss while cash-flowing — sheltering income. Rental losses are passive: they offset passive income freely, and up to $25,000/yr can offset ordinary (W-2) income if you actively participate and your MAGI is under $100k (phasing out to $0 by $150k); unused losses carry forward. On sale, claimed depreciation is recaptured at up to 25%, and gains may owe capital-gains tax (a 1031 exchange can defer both). Figures are a year-1 estimate at your 24.0% rate — not tax advice; consult a CPA.
Schools (NCES district)
- District
- Ansonia School District
- NCES district ID
- 0900060
- Math proficiency
- 13% ▼ -15.00%
- Reading proficiency
- 25% ▼ -12.00%
- Median HH income
- $49,300
- Composite
- 16.97/100
- National rank
- #9132
- State rank
- #144 of 153 in CT
Livability — Ansonia
- Score
- 71/100
- State rank
- #87
- US rank
- #6938
Category grades
Schools grade is shown separately in the Schools card above.
Census & demographics
- Census place
- Ansonia, CT
- County
- New Haven County · 688,236 people
- City population
- 19,315
- Metro
- New Haven-Milford, CT
- Population (ZIP)
- 19,315
- Household income
- $86,178
- Rent vs Own
- Severe rent burden
- 541.0
Population outlook (Naugatuck Valley County) Hauer SSP2
- By 2040
- 496,846
Race, ethnicity, and origin ACS 2023
- Neighborhood character
- Diverse neighborhood (Simpson 0.66)
- Race & ethnicity
- White 50% Hispanic / Latino 25% Black 17% Two or more races 11% Asian 3%
- Hispanic origin (detail)
- Puerto Rican 11% Dominican 4%
- Common ancestry
- Romanian 7% Russian 1% Scotch-Irish 1%
- Foreign-born
- 18% · Canada, Jamaica, China
- Languages at home
- 75% English-only · Spanish 15% Other Indo-European 5% Russian/Polish/Slavic 2%
Political lean MEDSL · Naugatuck Valley
- 2024 margin
- Lean R (+7.4) · D 45.6% · R 53.0% · Other 1.4%
- All cycles
- 2024: R+7.4
Not yet ingested
- Civics
- —
Market trends
- HPI YoY
- ▼ -13.08%
- Current HPI
- 264.8538
- Rent YoY
- ▲ 7.35%
- Metro
- New Haven-Milford, CT
- State GDP YoY
- ▲ 1.06%
- F500 in state
- 38
Industry mix (Fortune 500 HQ in CT)
| Industry | F500 HQs | Revenue |
|---|---|---|
| Industrial Machinery | 4 | $38B |
|
||
| Insurance | 3 | $71B |
|
||
| Financial Services | 2 | $25B |
|
||
| Transportation / Logistics | 2 | $18B |
|
||
| Healthcare | 1 | $247B |
|
||
| Telecommunications | 1 | $55B |
|
||
Price history
+413.7% since first listed7 events — show timeline
- 2026-06-15 Pending — Smart MLS
- 2026-05-20 Contingent — Smart MLS
- 2026-05-14 Listed $449,000 Smart MLS
- 2026-05-08 Coming Soon $449,000 Smart MLS
- 2018-11-13 Sold (Public Records) $189,900 Public Records
- 2011-06-29 Sold (Public Records) $158,000 Public Records
- 1993-12-21 Sold (Public Records) $87,400 Public Records
Property tax history
+2.1%/yrLatest (2023): $4,689 · +20.4% YoY. Source: county tax records.
Cash-flow waterfall
monthlySold comps — $/sqft
last 12 mo · ≤1 miLoading sold comps…