 🔨 Auction
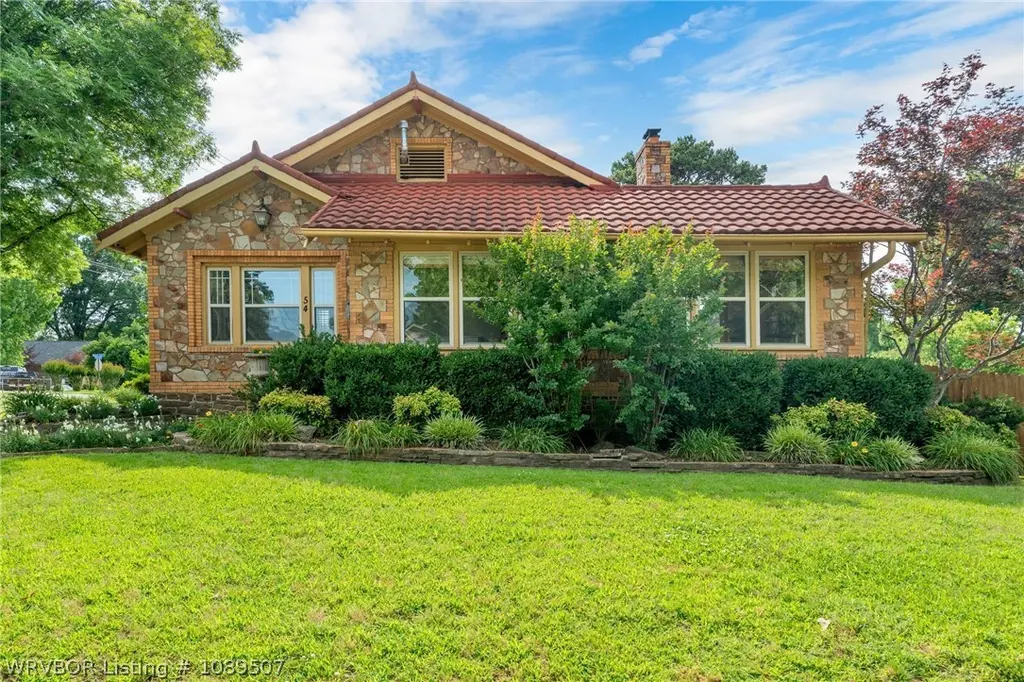
54 Hiland Dr · Fort Smith, AR
Flood risk 1/10 · Minimal
- FEMA flood zone
- X (unshaded)
- Chance of flooding over 30 yrs
- 0.0%
- Est. flood insurance / yr
- $473 – $860
Fire risk 1/10 · Minimal
- Est. fire insurance / yr
- $1,499 – $2,785
Heat risk 6/10 · Moderate
- Hot days now (above 111°F)
- 7 days/yr
- Hot days in 30 yrs
- 19 days/yr
Wind risk 2/10 · Minimal
- Chance of severe wind over 30 yrs
- 2.0%
Air-quality risk 2/10 · Minimal
- Unhealthy air days now
- 0 days/yr
- Unhealthy air days in 30 yrs
- 1 days/yr
Risk factors via First Street. Map © Google.
Why this score? — see what drove the F grade
The composite is a weighted blend of 9 inputs, each scored 0–100. Each bar is that input's sub-score; the figure is the points it added to the 100-point composite (weight × sub-score).
- ARV discount +7.5/15.0
- Cash flow +4.0/30.0
- Rent growth +3.6/5.0
- Livability +3.2/5.0
- Schools +3.1/10.0
- Condition / age +2.5/5.0
- 1% rule +0.2/10.0
- DSCR +0.0/10.0
- Appreciation +0.0/10.0
$1
🖨 Deal sheet 📄 Offer letter ✓ Due diligence
Listing remarks
Auction 07/21/2025 at 11:00 AM Step into timeless charm with this beautifully remodeled 1935 home located in the highly sought-after Hillcrest neighborhood. Offering approximately 2,980 finished square feet, this character-filled residence blends historic appeal with tasteful modern updates throughout. Featuring 3 bedrooms and 2.5 bathrooms, the home showcases beautiful hardwood floors, spacious living areas, and abundant natural light. Thoughtfully updated finishes complement the home's original character while providing modern comfort and convenience. Situated on three lots totaling over half an acre, this corner-lot property offers an exceptional setting with mature landscaping, a full
Key facts
- Remodeled 1935 home
- Three lots
- Natural light
Tags
Property features AI
Exterior
- Parking: Detached garage with concrete driveway; Two covered parking spaces
- Security: Smoke detectors
- Utilities: Public water; Public sewer; Electricity available; Natural gas available; Water and sewer available
- Home design: Single-family house; Two stories
- Construction: Brick construction; Metal roof; Has a finished partial basement
- Exterior features: Patio; Porch; Privacy wood fencing; Cleared, landscaped corner city lot; Paved, public maintained road
Interior
- Kitchen: Dishwasher; Range; Refrigerator; Disposal; Gas water heater
- Flooring: Ceramic tile; Wood
- Bathrooms: Two full bathrooms; One half bathroom
- Heating & cooling: Central heating (natural gas); Central electric cooling; Ceiling fans
- Interior features: Built-in features; Ceiling fans; Cathedral ceilings; Eat-in kitchen; Storage; One fireplace in the family room; Finished partial basement
- Laundry & utility: Washer hookup; Electric dryer hookup
Neighborhood map
What this means for you Summary
Snapshot
- This is a 3-bed/2.5-bath single-family listed at $1.
Deal economics
- At list price, monthly cash flow is $-688 ($-8k/yr) — negative.
- The deal already cash-flows at list — no discount required.
- Meets the 1% rule at list price ($1k rent vs $1).
- Cap rate 2.9% vs local median 4.3% in Fort Smith — below-typical yield; the buyer is paying a premium for something (appreciation thesis, condition, location) that the cap rate doesn't capture.
Location & tenants
- Location reads 65/100 on livability (#151 in AR) — a middle-class / working-renter tenant base. Strengths: cost of living A+, housing A+, health & safety A+; Watch: crime F, amenities F, commute F.
- Fort Smith School District (urban): math 35% / reading 39% proficiency, ranked #106 of 238 in AR (top 44%) — families likely to look elsewhere, expect single-tenant / working-renter base with shorter leases; 64% free/reduced lunch — lower-income household profile, screen leases tightly.
- Zoned schools: Fairview Elementary School (math 50% / reading 38%, grade F, #164 of 454 statewide, top 37%, 458 students, 77% FRL); Ramsey Junior High School (math 37% / reading 47%, grade D-, #78 of 201 statewide, top 40%, 832 students, 67% FRL); Southside High School (math 36% / reading 53%, grade F, #31 of 292 statewide, top 12%, 1,956 students, 47% FRL) — zoned schools at 64% FRL track the district average.
- Market conditions: Rents rising fast (+4.4%/yr); 174 active listings in the ZIP; 6 comparable units currently listed for rent nearby; rentals at typical pace (median 21d on market — plan ~3-4 weeks tenant-placement turnaround); lower-income renter base — watch delinquency; 388 units permitted in Sebastian County in 2024 (16 in 5+ unit buildings).
- This rent runs 35% of the median local income ($43k/yr) — at the standard rent-burdened threshold; future hikes will face affordability resistance.
Forward outlook
- Local home prices are declining (-3.0%/yr); year-one equity from $2k of loan paydown is wiped out by about $7k of value loss. Plan a longer hold.
- Sebastian County population projected at +7% by 2050 — modest demand growth; plan on rents tracking national, not racing it.
Negotiation context
- It's been on market 16 days — a 2% lower offer ($0) is reasonable based on typical stale-listing flexibility.
Risks & watch-outs
- Watch-outs: property tax is 366048.0% of price; built in 1935 — expect roof / HVAC / electrical / plumbing capex.
- Climate carrying-cost: extreme-heat days projected 7→19/yr by 2055 (HVAC capex compounding) — expect insurance premiums to compound above CPI over the hold.
Questions for the listing agent
- What do current leases actually rent for vs. the listed asking? Can we see a recent rent roll and the last 12 months of T-12 income?
- Built in 1935 — when were the roof, HVAC, electrical panel, plumbing, and water heater last replaced?
- Property tax is high relative to price — has the assessment been appealed recently, and will the sale trigger a re-assessment?
- Is there a deadline driving the sale (1031 exchange, divorce, estate, relocation)? That informs how much negotiation room exists.
- Schools are D-rated, which usually means shorter tenancies and higher turnover. Who's the typical renter profile here, and what's been the actual vacancy rate?
- Crime grade is F in this area — have there been break-ins, vandalism, or insurance claims at this property in the last 3 years? What carrier currently insures it and at what premium?
- The area grade is low — what's the realistic commute time and amenity access for the typical tenant pool here? Any planned neighborhood developments (good or bad) we should know about?
- What's the average days-on-market for RENTAL listings here right now (not sales)? A rising rental-DOM trend means longer vacancies and softer asking-rent achievability than the comps imply.
- What's the recent tenant-quality profile in this submarket — average credit score on applications, eviction rate, late-payment / NSF rate, and stable-employment percentage? A property-management company in the area should have these aggregated.
- How much new for-sale + rental construction is in the pipeline within 1–3 miles? Heavy new supply typically softens prices + rents 12–24 months out; constrained supply supports both.
Investment metrics
- 1% rule
- 0.52% ✗
- Cap rate
- 2.91%
- Cash-on-cash
- -12.09%
- DSCR
- 0.46
- GRM
- 16.1
CMA / ARV
- ARV (on-the-fly)
- $244,032
- Comps found
- 12
Show comp detail 12 sales within ~0.75 mi
| Address | Dist | Beds/Ba | Sqft | Sold | Price | $/sf | Match |
|---|---|---|---|---|---|---|---|
| 2816 S 33rd St | 0.42mi | 3/2.0 | 2,021 (+3%) | 1mo | $120,000 | $59 | 74 |
| 2206 S T St | 0.49mi | 3/2.0 | 1,928 (-2%) | 2mo | $290,000 | $150 | 70 |
| 2216 S X St | 0.27mi | 3/2.0 | 1,771 (-10%) | 1mo | $235,500 | $133 | 68 |
| 2315 Country Club Dr | 0.14mi | 4/1.0 (+1) | 2,205 (+12%) | 3mo | $145,000 | $66 | 60 |
| 3404 S 33rd Cir | 0.61mi | 3/2.0 | 1,850 (-6%) | 2mo | $219,000 | $118 | 58 |
| 2420 Independence St | 0.66mi | 4/3.0 (+1) | 2,011 (+2%) | 4mo | $249,900 | $124 | 55 |
| 2112 Carthage Dr | 0.36mi | 4/3.0 (+1) | 2,200 (+12%) | 3mo | $200,000 | $91 | 54 |
| 2800 S 34th St | 0.48mi | 4/2.5 (+1) | 2,237 (+14%) | 2mo | $290,000 | $130 | 48 |
| 3018 S 34th St | 0.51mi | 3/2.0 | 1,680 (-15%) | 2mo | $205,000 | $122 | 48 |
| 2222 S Q St | 0.66mi | 4/2.0 (+1) | 1,829 (-7%) | 4mo | $230,000 | $126 | 48 |
| 2104 S S St | 0.59mi | 3/2.0 | 1,694 (-14%) | 2mo | $210,000 | $124 | 45 |
| 1620 South 29th St | 0.72mi | 3/2.0 | 1,680 (-15%) | 2mo | $148,000 | $88 | 38 |
Match score weights: distance 35% · size 25% · config 20% · recency 20%. Top-matched comps best support the ARV.
Projected returns pro-forma
-3.0% appreciation · 4.37% rent growth · sell at horizon
- IRR
- -37.1%
- Equity multiple
- -0.19×
- Total profit
- $-81,597
- Equity at exit
- $36,386
- IRR
- -44.6%
- Equity multiple
- -0.76×
- Total profit
- $-119,973
- Equity at exit
- $21,099
Cash invested: $68,329 (down + closing). Projections, not guarantees.
Landlord ↔ Tenant lean methodology
- Overall (STATE)
- 92 Strongly Landlord-Friendly
- State Arkansas
- 92 Strongly Landlord-Friendly · R+14
- County
- — inherits STATE
- City
- — inherits STATE
ZIP-level market 72901
- Rents YoY
- 4.4%
- Active inventory
- 174
Monthly cashflow live
- Estimated rent
- $1,264 high interval (Pro) →
- Mortgage (P&I)
- −$1,280
- Tax est. 1.5%
- −$305 /mo · $3,660/yr
- Insurance
- −$102
- HOA
- −$0
- Vacancy / Maint / Mgmt
- −$265
- Net cashflow
- $-688
Break-even live
UW: 25.0% down · 7.5% · 30yr · 1.5% tax · 5.0% vac · 8.0% maint · 8.0% mgmt
Financing live
Cash to close
- Down payment
- $61,008
- Closing costs
- $7,321
- Reserves months
- —
- Total cash needed
- —
Loan-product check · same deal, 3 products live
Conventional
25% down · 7.5% · 30yr
- Down + closing
- —
- Monthly P&I
- —
- Monthly cashflow
- —
- DSCR
- —
- Eligible?
- —
Personal DTI + credit; lowest rate.
DSCR
20% down · 8.5% · 30yr
- Down + closing
- —
- Monthly P&I
- —
- Monthly cashflow
- —
- DSCR
- —
- Eligible?
- —
No personal income docs; deal must DSCR.
Hard money
10% down · 12.0% · 12mo
- Down + closing
- —
- Monthly P&I
- —
- Monthly cashflow
- —
- DSCR
- —
- Eligible?
- —
Short-term bridge; refi at stabilization.
Rent comps 6 comps
| Address | Beds | Baths | Sqft | Rent | $/sqft | DOM | Units | Dist |
|---|---|---|---|---|---|---|---|---|
| 2800 Wharton Cir Unit 2323 Fort Smith, AR | 2.0 | 2.0 | 1240 | $925 | $0.75 | 13d | 1 | 0.24mi |
| 2307 S 23rd St Fort Smith, AR | 3.0 | 2.5 | 1356 | $1,595 | $1.18 | 20d | 1 | 0.32mi |
| 3700 Dallas St Fort Smith, AR | 3.0 | 2.0 | 1544 | $1,795 | $1.16 | 20d | 1 | 0.83mi |
| 704 S 26th St Fort Smith, AR | 2.0 | 2.0 | 1892 | $1,700 | $0.90 | 20d | 1 | 1.32mi |
| 800 S 19th St Fort Smith, AR | 2.0 | 1.0 | 1286 | $1,095 | $0.85 | 3d | 1 | 1.38mi |
| 1306 S 41st St Fort Smith, AR | 4.0 | 2.0 | 2295 | $1,700 | $0.74 | 13d | 1 | 1.41mi |
Listing history 12 events
-
2026-06-19days on market $1 Active 16 DOM
-
2026-06-18days on market $1 Active 15 DOM
-
2026-06-17days on market $1 Active 14 DOM
-
2026-06-16days on market $1 Active 13 DOM
-
2026-06-15days on market $1 Active 12 DOM
-
2026-06-14days on market $1 Active 10 DOM
-
2026-06-13days on market $1 Active 9 DOM
-
2026-06-10days on market $1 Active 7 DOM
-
2026-06-09days on market $1 Active 6 DOM
-
2026-06-08days on market $1 Active 5 DOM
-
2026-06-07remarks 699-char remark
-
2026-06-07$1 Active 4 DOM
ⓘ Source: listings_history table (triggers on properties + properties_extension) + one-shot
backfill from property_details.listing_events for pre-trigger history.
Climate risk First Street
- Flood 1/10 Low FEMA zone X (unshaded) · 0% chance over 30 yrs
- Wildfire 1/10 Low
- Heat 6/10 Major 7 d/yr ≥111°F today · 19 d/yr by 30 yrs out
- Wind 2/10 Low 2% chance of damaging wind over 30 yrs
- Air quality 2/10 Low 0 unhealthy d/yr today · 1 by 30 yrs out
Nearby sold comps map
Loading sold comps map…
Walkable amenities ~0.75 mi
Loading nearby amenities…
Taxation est. · year 1
- Rental income
- $15,162
- − Mortgage interest
- −$13,670
- − Property taxes
- −$3,660
- − Insurance
- −$1,220
- − Repairs & maintenance
- −$1,213
- − Management
- −$1,213
- − Depreciation
- −$7,099
- Taxable loss
- −$12,913
- Est. tax savings @ 24.0%
- +$3,099
- After-tax cash flow
- $-5,160/yr
For passive investors: Depreciation is non-cash, so a rental often shows a tax loss while cash-flowing — sheltering income. Rental losses are passive: they offset passive income freely, and up to $25,000/yr can offset ordinary (W-2) income if you actively participate and your MAGI is under $100k (phasing out to $0 by $150k); unused losses carry forward. On sale, claimed depreciation is recaptured at up to 25%, and gains may owe capital-gains tax (a 1031 exchange can defer both). Figures are a year-1 estimate at your 24.0% rate — not tax advice; consult a CPA.
Schools (NCES district)
- District
- Fort Smith School District
- NCES district ID
- 0506330
- Math proficiency
- 35% ▼ -11.00%
- Reading proficiency
- 39% ▼ -7.00%
- Median HH income
- $36,066
- Composite
- 30.66/100
- National rank
- #6183
- State rank
- #106 of 238 in AR
Livability — Fort Smith
- Score
- 65/100
- State rank
- #151
- US rank
- #13185
Category grades
Schools grade is shown separately in the Schools card above.
Census & demographics
- Census place
- Fort Smith, AR
- County
- Sebastian County · 99,312 people
- City population
- 94,356
- Metro
- Fort Smith, AR-OK
- Population (ZIP)
- 19,819
- Household income
- $42,851
- Rent vs Own
- Severe rent burden
- 1117.0
Population outlook (Sebastian County) Hauer SSP2
- Today (2025)
- 133,992 people
- By 2030
- 136,620 · +2.0%
- By 2040
- 140,832 · +5.1%
- By 2050
- 143,301 · +6.9%
- By 2075
- 147,964 · +10.4%
- By 2100
- 145,848 · +8.8%
Race, ethnicity, and origin ACS 2023
- Neighborhood character
- Diverse neighborhood (Simpson 0.60)
- Race & ethnicity
- White 60% Hispanic / Latino 17% Two or more races 12% Black 10% Asian 2%
- Hispanic origin (detail)
- Mexican 11% Puerto Rican 1%
- Common ancestry
- Slovak 2% Lithuanian 2% Italian 1%
- Foreign-born
- 9% · Canada, Vietnam, Guatemala
- Languages at home
- 83% English-only · Spanish 14% Other Asian/Pacific 1% Vietnamese 1%
Political lean MEDSL · Sebastian
- 2024 margin
- Solid R (+37.5) · D 30.0% · R 67.6% · Other 2.4%
- 2008→2024 swing
- -2.9pp toward R · 2008: -34.6pp · 2024: -37.5pp
- All cycles
- 2024: R+37.5 2020: R+35.5 2016: R+38.1 2012: R+37.1 2008: R+34.6
Not yet ingested
- Civics
- —
Market trends
- HPI YoY
- ▼ -173.82%
- Current HPI
- 172.3777
- Rent YoY
- ▲ 4.37%
- Metro
- Fort Smith, AR-OK
- State GDP YoY
- ▲ 3.80%
- F500 in state
- 10
Industry mix (Fortune 500 HQ in AR)
| Industry | F500 HQs | Revenue |
|---|---|---|
| Retail | 1 | $681B |
|
||
| Food / Agriculture | 1 | $53B |
|
||
| Retail / Energy | 1 | $22B |
|
||
| Transportation / Logistics | 1 | $12B |
|
||
| Energy | 1 | $4B |
|
||
Price history
2 events — show timeline
- 2026-06-03 Listed $1 WRVBOR
- 2022-07-18 Sold (Public Records) $450,000 Public Records
Property tax history
+3.3%/yrLatest (2025): $2,646 · +8.9% YoY. Source: county tax records.
Cash-flow waterfall
monthlySold comps — $/sqft
last 12 mo · ≤1 miLoading sold comps…