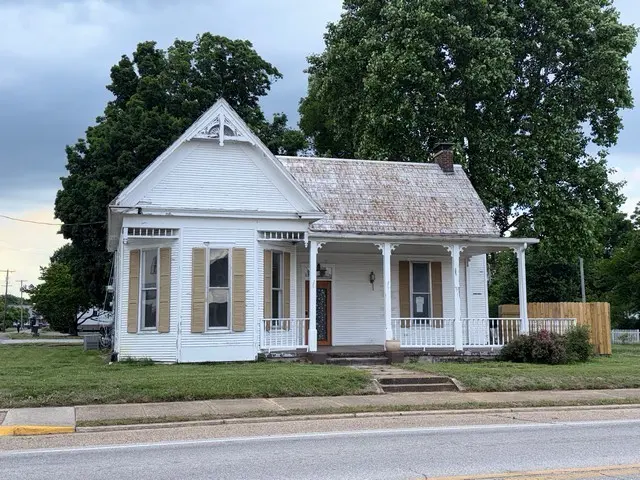
401 Cumberland St E · Cowan, TN
Flood risk 1/10 · Minimal
- FEMA flood zone
- X (unshaded)
- Chance of flooding over 30 yrs
- 0.0%
- Est. flood insurance / yr
- $507 – $1,088
Fire risk 3/10 · Minor
- Est. fire insurance / yr
- $949 – $1,763
Heat risk 6/10 · Moderate
- Hot days now (above 102°F)
- 7 days/yr
- Hot days in 30 yrs
- 21 days/yr
Wind risk 4/10 · Minor
- Chance of severe wind over 30 yrs
- 12.0%
Air-quality risk 2/10 · Minimal
- Unhealthy air days now
- 2 days/yr
- Unhealthy air days in 30 yrs
- 2 days/yr
Risk factors via First Street. Map © Google.
Why this score? — see what drove the B grade
The composite is a weighted blend of 9 inputs, each scored 0–100. Each bar is that input's sub-score; the figure is the points it added to the 100-point composite (weight × sub-score).
- Cash flow +30.0/30.0
- 1% rule +10.0/10.0
- DSCR +10.0/10.0
- ARV discount +7.5/15.0
- Appreciation +4.5/10.0
- Livability +2.9/5.0
- Rent growth +2.5/5.0
- Condition / age +2.5/5.0
- Schools +1.7/10.0
$85,000
🖨 Deal sheet 📄 Offer letter ✓ Due diligence
Listing remarks MLS
Gorgeous Historical property centrally located in the heart of Cowan. Was Commercial rezoned to Residential and all equipment being removed. Features 2 bdrm, 2 baths. Kitchen, living rm, formal dining rm, gorgeous hardwood floors, original crown molding & recessed book shelves, great location. Come and see this deal before it's gone.
Key facts
- 8,712 sq ft lot
- Built 1900
- Listed 9 days
Property features AI
Finance
- Other: Above-grade living area reported as 1,221 (owner provided)
Exterior
- Parking: No covered parking reported; No total parking spaces reported
- Utilities: Public water; Public sewer; Electricity available
- Home design: Single-family residence; One story; Historic home
- Construction: Wood siding
- Exterior features: Corner lot; Lot dimensions approximately 73 x 133
Interior
- Kitchen: Kitchen approximately 11 x 18; Gas range
- Bedrooms: 2 bedrooms (both on the main level); Bedroom sizes approximately 12 x 14 each; Den approximately 6 x 11
- Flooring: Wood flooring
- Bathrooms: 1 full bathroom
- Heating & cooling: Central heating (electric) with zoned controls; Central air conditioning (electric)
- Interior features: Gas range; Wood flooring; No basement
Neighborhood map
What this means for you Summary
Snapshot
- This is a 2-bed/2.0-bath single-family listed at $85k.
Deal economics
- At list price, monthly cash flow is $447 ($5k/yr) — positive.
- The deal already cash-flows at list — no discount required.
- Meets the 1% rule at list price ($1k rent vs $85k).
- Cap rate 12.6% vs local median 3.5% in Cowan — top-decile yield for the area; either an underpriced asset or a hidden risk that comps aren't pricing in. Stress-test before assuming the spread holds.
Location & tenants
- Location reads 57/100 on livability (#329 in TN) — a working-class tenant base; expect higher turnover. Strengths: cost of living A+, housing A+, crime B; Watch: amenities F, commute F, employment F.
- Franklin County (town): math 18% / reading 22% proficiency, ranked #111 of 139 in TN (top 80%) — low school quality limits family demand, transient renter base, plan for 1-2y turnover.
- Zoned schools: Cowan Elementary (math 32% / reading 17%, grade F, #546 of 952 statewide, top 61%, 279 students, 0% FRL); Franklin Co High School (math 5% / reading 22%, grade F, #255 of 332 statewide, top 77%, 1,180 students, 0% FRL) — zoned schools average 0% FRL vs 48% district-wide (48 pts lower); this property's tenant base skews higher-income than the district average.
- Market conditions: 27 active listings in the ZIP; 422 units permitted in Franklin County in 2024 (5 in 5+ unit buildings).
Forward outlook
- Local home prices are declining (-1.1%/yr); year-one equity from $588 of loan paydown is wiped out by about $928 of value loss. Plan a longer hold.
- Franklin County population projected at +6% by 2050 — modest demand growth; plan on rents tracking national, not racing it.
- At projected returns (-1.1% appreciation + 3.0% rent growth), your $24k cash investment doubles in ~5 years — after that, you're playing with house money.
Negotiation context
- Only 10 days on market — expect competitive offers; lowballing is unlikely to land.
- 4 sale attempts since 8y ago with the ask held roughly flat each time — persistent listings suggest the price (not the market) is what's stuck; bring a comps-based counter.
Risks & watch-outs
- Watch-outs: built in 1900 — expect roof / HVAC / electrical / plumbing capex.
- Climate carrying-cost: extreme-heat days projected 7→21/yr by 2055 (HVAC capex compounding) — expect insurance premiums to compound above CPI over the hold.
Questions for the listing agent
- Built in 1900 — when were the roof, HVAC, electrical panel, plumbing, and water heater last replaced?
- Is there a deadline driving the sale (1031 exchange, divorce, estate, relocation)? That informs how much negotiation room exists.
- Schools are F-rated, which usually means shorter tenancies and higher turnover. Who's the typical renter profile here, and what's been the actual vacancy rate?
- What's the average days-on-market for RENTAL listings here right now (not sales)? A rising rental-DOM trend means longer vacancies and softer asking-rent achievability than the comps imply.
- What's the recent tenant-quality profile in this submarket — average credit score on applications, eviction rate, late-payment / NSF rate, and stable-employment percentage? A property-management company in the area should have these aggregated.
- How much new for-sale + rental construction is in the pipeline within 1–3 miles? Heavy new supply typically softens prices + rents 12–24 months out; constrained supply supports both.
Investment metrics
- 1% rule
- 1.50% ✓
- Cap rate
- 12.60%
- Cash-on-cash
- 22.52%
- DSCR
- 2.00
- GRM
- 5.6
CMA / ARV
- ARV (on-the-fly)
- $204,000
- Comps found
- 10
Show comp detail 10 sales within ~0.75 mi
| Address | Dist | Beds/Ba | Sqft | Sold | Price | $/sf | Match |
|---|---|---|---|---|---|---|---|
| 205 Cowan St E | 0.10mi | 3/2.0 (+1) | 1,325 (+4%) | 10mo | $205,000 | $155 | 76 |
| 104 Hill St N | 0.05mi | 2/2.0 | 1,324 (+4%) | 22mo | $214,900 | $162 | 73 |
| 403 Hawkins St | 0.23mi | 3/1.0 (+1) | 1,249 (-2%) | 12mo | $88,700 | $71 | 67 |
| 104 Willow St N | 0.32mi | 3/2.0 (+1) | 1,311 (+3%) | 10mo | $254,900 | $194 | 67 |
| 213 England St W | 0.42mi | 3/1.5 (+1) | 1,275 (0%) | 8mo | $220,000 | $173 | 66 |
| 400 Cowan St E | 0.08mi | 3/2.0 (+1) | 1,152 (-10%) | 11mo | $154,500 | $134 | 66 |
| 116 Poplar St N | 0.23mi | 3/2.0 (+1) | 1,416 (+11%) | 8mo | $190,000 | $134 | 59 |
| 117 Willow St N | 0.28mi | 3/1.0 (+1) | 1,185 (-7%) | 9mo | $190,000 | $160 | 58 |
| 212 Myers St | 0.40mi | 2/1.0 | 1,104 (-13%) | 3mo | $114,000 | $103 | 52 |
| 314 Poplar St N | 0.38mi | 3/1.0 (+1) | 1,305 (+2%) | 21mo | $210,000 | $161 | 52 |
Match score weights: distance 35% · size 25% · config 20% · recency 20%. Top-matched comps best support the ARV.
Projected returns pro-forma
-1.09% appreciation · 3.0% rent growth · sell at horizon
- IRR
- 20.1%
- Equity multiple
- 1.91×
- Total profit
- $21,697
- Equity at exit
- $20,141
- IRR
- 25.7%
- Equity multiple
- 3.61×
- Total profit
- $62,094
- Equity at exit
- $20,831
Cash invested: $23,800 (down + closing). Projections, not guarantees.
Landlord ↔ Tenant lean methodology
- Overall (STATE)
- 87 Strongly Landlord-Friendly
- State Tennessee
- 87 Strongly Landlord-Friendly · R+13
- County
- — inherits STATE
- City
- — inherits STATE
ZIP-level market 37318
- Home prices YoY
- -0.3%
- Active inventory
- 27
- Price-to-rent
- 5.6×
Monthly cashflow live
- Estimated rent
- $1,274 medium interval (Pro) →
- Mortgage (P&I)
- −$446
- Tax from tax record
- −$78 /mo · $942/yr
- Insurance
- −$35
- HOA
- −$0
- Vacancy / Maint / Mgmt
- −$268
- Net cashflow
- $447
Break-even live
UW: 25.0% down · 7.5% · 30yr · 1.5% tax · 5.0% vac · 8.0% maint · 8.0% mgmt
Financing live
Cash to close
- Down payment
- $21,250
- Closing costs
- $2,550
- Reserves months
- —
- Total cash needed
- —
Loan-product check · same deal, 3 products live
Conventional
25% down · 7.5% · 30yr
- Down + closing
- —
- Monthly P&I
- —
- Monthly cashflow
- —
- DSCR
- —
- Eligible?
- —
Personal DTI + credit; lowest rate.
DSCR
20% down · 8.5% · 30yr
- Down + closing
- —
- Monthly P&I
- —
- Monthly cashflow
- —
- DSCR
- —
- Eligible?
- —
No personal income docs; deal must DSCR.
Hard money
10% down · 12.0% · 12mo
- Down + closing
- —
- Monthly P&I
- —
- Monthly cashflow
- —
- DSCR
- —
- Eligible?
- —
Short-term bridge; refi at stabilization.
Listing history 9 events
-
2026-06-19days on market $85,000 Active 10 DOM
-
2026-06-18days on market $85,000 Active 9 DOM
-
2026-06-17days on market $85,000 Active 8 DOM
-
2026-06-16days on market $85,000 Active 7 DOM
-
2026-06-15days on market $85,000 Active 6 DOM
-
2026-06-14days on market $85,000 Active 4 DOM
-
2026-06-13days on market $85,000 Active 3 DOM
-
2026-06-10remarks 221-char remark
-
2026-06-10$85,000 Active 1 DOM
ⓘ Source: listings_history table (triggers on properties + properties_extension) + one-shot
backfill from property_details.listing_events for pre-trigger history.
Tax reassessment forecast TN · Resets to sale price
- Current annual tax
- $942 · $78/mo
- Projected year-2 tax
- $942 · $78/mo
- Expected delta
- $0/yr ($0/mo · 0.0%)
ⓘ Screening estimate from a state-policy table — verify with the county assessor before closing.
Climate risk First Street
- Flood 1/10 Low FEMA zone X (unshaded) · 0% chance over 30 yrs
- Wildfire 3/10 Moderate
- Heat 6/10 Major 7 d/yr ≥102°F today · 21 d/yr by 30 yrs out
- Wind 4/10 Moderate 12% chance of damaging wind over 30 yrs
- Air quality 2/10 Low 2 unhealthy d/yr today · 2 by 30 yrs out
Nearby sold comps map
Loading sold comps map…
Walkable amenities ~0.75 mi
Loading nearby amenities…
Taxation est. · year 1
- Rental income
- $15,286
- − Mortgage interest
- −$4,761
- − Property taxes
- −$942
- − Insurance
- −$425
- − Repairs & maintenance
- −$1,223
- − Management
- −$1,223
- − Depreciation
- −$2,473
- Taxable income
- $4,239
- Est. tax owed @ 24.0%
- −$1,017
- After-tax cash flow
- $4,343/yr
For passive investors: Depreciation is non-cash, so a rental often shows a tax loss while cash-flowing — sheltering income. Rental losses are passive: they offset passive income freely, and up to $25,000/yr can offset ordinary (W-2) income if you actively participate and your MAGI is under $100k (phasing out to $0 by $150k); unused losses carry forward. On sale, claimed depreciation is recaptured at up to 25%, and gains may owe capital-gains tax (a 1031 exchange can defer both). Figures are a year-1 estimate at your 24.0% rate — not tax advice; consult a CPA.
Schools (NCES district)
- District
- Franklin County
- NCES district ID
- 4701290
- Math proficiency
- 18% ▼ -9.00%
- Reading proficiency
- 22% ▼ -8.00%
- Median HH income
- $43,108
- Composite
- 17.24/100
- National rank
- #9094
- State rank
- #111 of 139 in TN
Livability — Cowan
- Score
- 57/100
- State rank
- #329
- US rank
- #21913
Category grades
Schools grade is shown separately in the Schools card above.
Census & demographics
- Census place
- Cowan, TN
- Population (ZIP)
- 2,245
Population outlook (Franklin County) Hauer SSP2
- Today (2025)
- 42,858 people
- By 2030
- 43,540 · +1.6%
- By 2040
- 44,623 · +4.1%
- By 2050
- 45,523 · +6.2%
- By 2075
- 48,954 · +14.2%
- By 2100
- 50,170 · +17.1%
Race, ethnicity, and origin ACS 2023
- Neighborhood character
- Predominantly White (86%)
- Race & ethnicity
- White 86% Black 9% Two or more races 4%
- Common ancestry
- Slovak 2% Serbian 2% Italian 1%
- Foreign-born
- 0%
Political lean MEDSL · Franklin
- 2024 margin
- Solid R (+53.2) · D 23.0% · R 76.1%
- 2008→2024 swing
- -30.6pp toward R · 2008: -22.5pp · 2024: -53.2pp
- All cycles
- 2024: R+53.2 2020: R+47.7 2016: R+43.7 2012: R+28.9 2008: R+22.5
Not yet ingested
- Civics
- —
Market trends
- HPI YoY
- ▼ -1.09%
- Current HPI
- 355.3141
- Rent YoY
- —
- Metro
- —
- State GDP YoY
- ▲ 2.78%
- F500 in state
- 22
Industry mix (Fortune 500 HQ in TN)
| Industry | F500 HQs | Revenue |
|---|---|---|
| Healthcare | 3 | $91B |
|
||
| Retail | 3 | $72B |
|
||
| Transportation / Logistics | 1 | $88B |
|
||
| Paper / Packaging | 1 | $19B |
|
||
| Insurance | 1 | $13B |
|
||
| Energy | 1 | $12B |
|
||
Price history
-29.1% since first listed8 events — show timeline
- 2026-06-10 Listed $85,000 REALTRACS as Distributed by MLS Grid
- 2021-08-20 Sold (MLS) $124,900 REALTRACS as Distributed by MLS Grid
- 2021-06-28 Contingent — REALTRACS as Distributed by MLS Grid
- 2020-12-09 Listed $119,900 REALTRACS as Distributed by MLS Grid
- 2020-12-01 Listing Removed — REALTRACS as Distributed by MLS Grid
- 2019-06-03 Relisted — REALTRACS as Distributed by MLS Grid
- 2019-06-01 Listing Removed — REALTRACS as Distributed by MLS Grid
- 2018-11-28 Listed $119,900 REALTRACS as Distributed by MLS Grid
Property tax history
+0.0%/yrLatest (2025): $942 · +1.4% YoY. Source: county tax records.
Cash-flow waterfall
monthlySold comps — $/sqft
last 12 mo · ≤1 miLoading sold comps…