1048 cordoba Rd · Lake Isabella, MI
Flood risk 1/10 · Minimal
- FEMA flood zone
- X (unshaded)
- Chance of flooding over 30 yrs
- 0.0%
- Est. flood insurance / yr
- $507 – $1,088
Fire risk 3/10 · Minor
- Est. fire insurance / yr
- $784 – $1,456
Heat risk 2/10 · Minimal
- Hot days now (above 96°F)
- 7 days/yr
- Hot days in 30 yrs
- 14 days/yr
Wind risk 1/10 · Minimal
- Chance of severe wind over 30 yrs
- —
Air-quality risk 2/10 · Minimal
- Unhealthy air days now
- 1 days/yr
- Unhealthy air days in 30 yrs
- 2 days/yr
Risk factors via First Street. Map © Google.
Why this score? — see what drove the C- grade
The composite is a weighted blend of 9 inputs, each scored 0–100. Each bar is that input's sub-score; the figure is the points it added to the 100-point composite (weight × sub-score).
- Cash flow +19.2/30.0
- Appreciation +10.0/10.0
- DSCR +6.1/10.0
- 1% rule +4.5/10.0
- Livability +3.5/5.0
- Schools +2.8/10.0
- Rent growth +2.5/5.0
- Condition / age +2.5/5.0
- ARV discount +0.5/15.0
$114,999
🖨 Deal sheet 📄 Offer letter ✓ Due diligence
Listing remarks
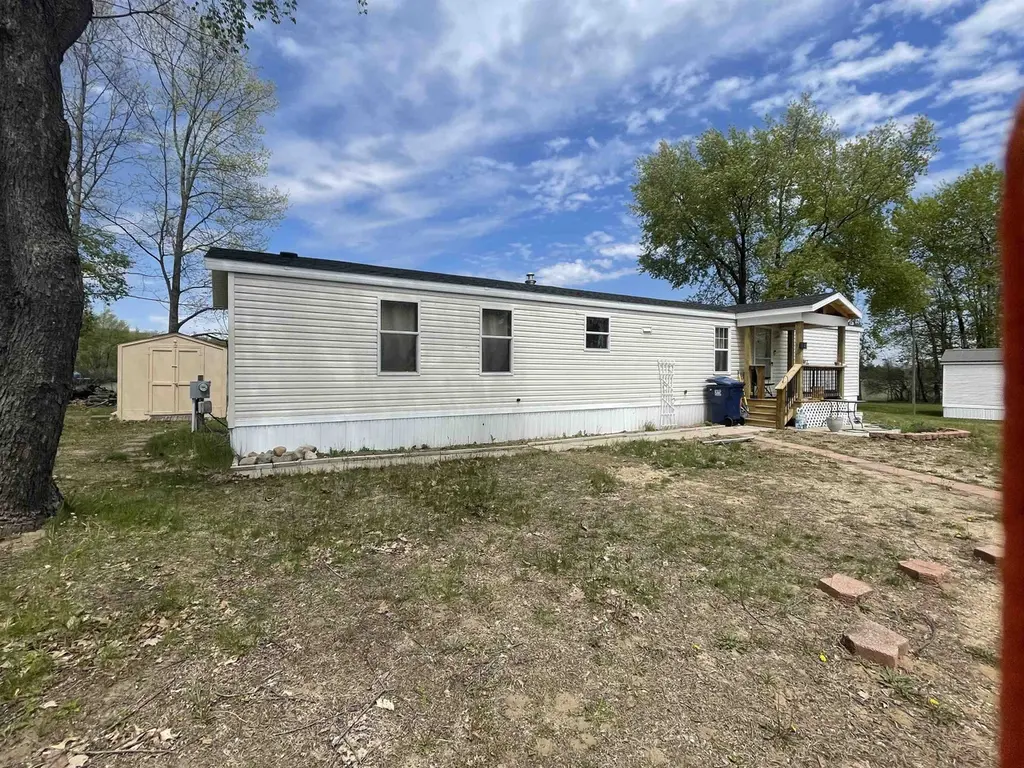
Move -in Ready 2001 singlewide manufactured home featuring 3 bedrooms and 2 full baths !! This well maintained home offers fresh paint , newer roof and 2 brand new decks perfect for relaxing or entertaining. Enjoy the peaceful county views from the back yard along with two sheds for extra space. A great opportunity for a affordable style home with plenty of updates already done. Lake maintenance 30 per year to be a member with park and lake privileges its 270 a year. Enjoy all that Lake Isabella has to offer which includes 20 waterfront parks , tennis courts, boat launches, volleyball, basketball, and more! https://lipoa.org/
Key facts
- Lake privileges
- Fresh paint
- Newer roof
Tags
Property features AI
Finance
- Other: Lot size approximately 0.33 acre (frontage 55')
- HOA & community: Association for Lake Isabella with an annual fee of $300
Exterior
- Utilities: Public water; Septic system; Natural gas; Electric power (standard)
- Home design: Residential manufactured home; Single-wide manufactured body type; One-story
- Construction: Built in 2001; Piers foundation
- Exterior features: Vinyl siding; Road frontage; Located on Lake Isabella
Interior
- Bedrooms: Main-level bedroom: 14 x 12, carpet; Main-level bedroom: 10 x 9, carpet; Main-level bedroom: 7 (approx.), carpet
- Flooring: Carpet in bedrooms; Vinyl in bathrooms
- Bathrooms: Two full bathrooms (both on main level); One additional lavatory (total of three lav/baths); Bathroom flooring: vinyl
- Heating & cooling: Forced air heating; Central A/C; Natural gas heat/fuel
- Interior features: All main-level living areas
Neighborhood map
What this means for you Summary
Snapshot
- This is a 3-bed/2.5-bath single-family listed at $115k.
Deal economics
- At list price, monthly cash flow is $124 ($1k/yr) — positive.
- The deal already cash-flows at list — no discount required.
- To meet the 1% rule (rent ≥ 1% of price), the offer needs to be $109k (5.4% below list).
- Recommended offer: $109k (5.4% below list) — sets the bar for 1% rule.
- Cap rate 7.6% vs local median 1.4% in Lake Isabella — top-decile yield for the area; either an underpriced asset or a hidden risk that comps aren't pricing in. Stress-test before assuming the spread holds.
Location & tenants
- Location reads 70/100 on livability (#329 in MI) — a middle-class / working-renter tenant base. Strengths: crime A+, employment A+, cost of living A+; Watch: schools D, amenities F, commute F.
- Chippewa Hills School District (rural): math 24% / reading 42% proficiency, ranked #324 of 540 in MI (top 60%) — families likely to look elsewhere, expect single-tenant / working-renter base with shorter leases.
- Market conditions: 79 active listings in the ZIP; 72 units permitted in Isabella County in 2024 (0 in 5+ unit buildings).
Forward outlook
- In year one you build about $12k of equity ($795 loan paydown + $12k appreciation (10.0% local appreciation)).
- Isabella County population projected at +9% by 2050 — modest demand growth; plan on rents tracking national, not racing it.
- At projected returns (10.0% appreciation + 3.0% rent growth), your $32k cash investment doubles in ~3 years — after that, you're playing with house money.
- By year 3, paydown + projected appreciation supports a ~$31k cash-out refi (75% LTV) — recoverable capital for the next deal without selling this one.
Negotiation context
- It's been on market 29 days — a 2% lower offer ($113k) is reasonable based on typical stale-listing flexibility.
- Current owner paid $46k; list at $115k implies a 153% gain — meaningful room to come down on a strong offer.
Questions for the listing agent
- What does the HOA fee cover, when was the last increase, and are there any pending special assessments or reserve-fund shortfalls?
- Is there a deadline driving the sale (1031 exchange, divorce, estate, relocation)? That informs how much negotiation room exists.
- Schools are D-rated, which usually means shorter tenancies and higher turnover. Who's the typical renter profile here, and what's been the actual vacancy rate?
- What's the average days-on-market for RENTAL listings here right now (not sales)? A rising rental-DOM trend means longer vacancies and softer asking-rent achievability than the comps imply.
- What's the recent tenant-quality profile in this submarket — average credit score on applications, eviction rate, late-payment / NSF rate, and stable-employment percentage? A property-management company in the area should have these aggregated.
- How much new for-sale + rental construction is in the pipeline within 1–3 miles? Heavy new supply typically softens prices + rents 12–24 months out; constrained supply supports both.
Investment metrics
- 1% rule
- 0.95% ✗
- Cap rate
- 7.58%
- Cash-on-cash
- 4.61%
- DSCR
- 1.21
- GRM
- 8.8
CMA / ARV
- ARV (on-the-fly)
- $99,450
- Comps found
- 2
Show comp detail 2 sales within ~0.75 mi
| Address | Dist | Beds/Ba | Sqft | Sold | Price | $/sf | Match |
|---|---|---|---|---|---|---|---|
| 1000 Vallado Dr | 0.12mi | 3/1.0 | 960 (-2%) | 19mo | $74,000 | $77 | 70 |
| 1021 Cortez Dr | 0.29mi | 3/2.0 | 1,100 (+13%) | 4mo | $112,000 | $102 | 60 |
Match score weights: distance 35% · size 25% · config 20% · recency 20%. Top-matched comps best support the ARV.
Projected returns pro-forma
10.0% appreciation · 3.0% rent growth · sell at horizon
- IRR
- 27.6%
- Equity multiple
- 3.19×
- Total profit
- $70,494
- Equity at exit
- $103,600
- IRR
- 24.1%
- Equity multiple
- 7.25×
- Total profit
- $201,356
- Equity at exit
- $223,418
Cash invested: $32,200 (down + closing). Projections, not guarantees.
Landlord ↔ Tenant lean methodology
- Overall (STATE)
- 62 Landlord-Friendly
- State Michigan
- 62 Landlord-Friendly · EVEN
- County
- — inherits STATE
- City
- — inherits STATE
ZIP-level market 48893
- Home prices YoY
- 6.6%
- Active inventory
- 79
- Price-to-rent
- 8.8×
Monthly cashflow live
- Estimated rent
- $1,088 medium interval (Pro) →
- Mortgage (P&I)
- −$603
- Tax from tax record
- −$60 /mo · $715/yr
- Insurance
- −$48
- HOA
- −$25
- Vacancy / Maint / Mgmt
- −$228
- Net cashflow
- $124
Break-even live
UW: 25.0% down · 7.5% · 30yr · 1.5% tax · 5.0% vac · 8.0% maint · 8.0% mgmt
Financing live
Cash to close
- Down payment
- $28,750
- Closing costs
- $3,450
- Reserves months
- —
- Total cash needed
- —
Loan-product check · same deal, 3 products live
Conventional
25% down · 7.5% · 30yr
- Down + closing
- —
- Monthly P&I
- —
- Monthly cashflow
- —
- DSCR
- —
- Eligible?
- —
Personal DTI + credit; lowest rate.
DSCR
20% down · 8.5% · 30yr
- Down + closing
- —
- Monthly P&I
- —
- Monthly cashflow
- —
- DSCR
- —
- Eligible?
- —
No personal income docs; deal must DSCR.
Hard money
10% down · 12.0% · 12mo
- Down + closing
- —
- Monthly P&I
- —
- Monthly cashflow
- —
- DSCR
- —
- Eligible?
- —
Short-term bridge; refi at stabilization.
HOA detail
- Monthly dues
- $25 · $300/yr
- Likely covers
- water
Listing history 17 events
-
2026-06-16status $114,999 Pending 29 DOM
-
2026-06-15days on market $114,999 Active 29 DOM
-
2026-06-14days on market $114,999 Active 27 DOM
-
2026-06-12days on market $114,999 Active 26 DOM
-
2026-06-09days on market $114,999 Active 23 DOM
-
2026-06-08days on market $114,999 Active 22 DOM
-
2026-06-07days on market $114,999 Active 21 DOM
-
2026-06-05days on market $114,999 Active 18 DOM
-
2026-06-03days on market $114,999 Active 17 DOM
-
2026-06-02days on market $114,999 Active 16 DOM
-
2026-06-01days on market $114,999 Active 15 DOM
-
2026-05-31days on market $114,999 Active 14 DOM
-
2026-05-30days on market $114,999 Active 13 DOM
-
2026-05-17$114,999 Active
-
2023-08-30soldstatus $45,500
-
2016-07-01soldstatus $25,000
-
2013-09-12soldstatus $30,000
ⓘ Source: listings_history table (triggers on properties + properties_extension) + one-shot
backfill from property_details.listing_events for pre-trigger history.
Tax reassessment forecast MI · Partial reset (capped growth)
- Current annual tax
- $715 · $60/mo
- Projected year-2 tax
- $1,243 · $104/mo
- Expected delta
- +$528/yr (+$44/mo · 73.9%)
ⓘ Screening estimate from a state-policy table — verify with the county assessor before closing.
Climate risk First Street
- Flood 1/10 Low FEMA zone X (unshaded) · 0% chance over 30 yrs
- Wildfire 3/10 Moderate
- Heat 2/10 Low 7 d/yr ≥96°F today · 14 d/yr by 30 yrs out
- Wind 1/10 Low
- Air quality 2/10 Low 1 unhealthy d/yr today · 2 by 30 yrs out
Nearby sold comps map
Loading sold comps map…
Walkable amenities ~0.75 mi
Loading nearby amenities…
Taxation est. · year 1
- Rental income
- $13,053
- − Mortgage interest
- −$6,442
- − Property taxes
- −$715
- − Insurance
- −$575
- − Repairs & maintenance
- −$1,044
- − Management
- −$1,044
- − HOA
- −$300
- − Depreciation
- −$3,345
- Taxable loss
- −$413
- Est. tax savings @ 24.0%
- +$99
- After-tax cash flow
- $1,584/yr
For passive investors: Depreciation is non-cash, so a rental often shows a tax loss while cash-flowing — sheltering income. Rental losses are passive: they offset passive income freely, and up to $25,000/yr can offset ordinary (W-2) income if you actively participate and your MAGI is under $100k (phasing out to $0 by $150k); unused losses carry forward. On sale, claimed depreciation is recaptured at up to 25%, and gains may owe capital-gains tax (a 1031 exchange can defer both). Figures are a year-1 estimate at your 24.0% rate — not tax advice; consult a CPA.
Schools (NCES district)
- District
- Chippewa Hills School District
- NCES district ID
- 2609560
- Math proficiency
- 24% ▼ -10.00%
- Reading proficiency
- 42% ▼ -5.00%
- Median HH income
- $43,598
- Composite
- 28.01/100
- National rank
- #6849
- State rank
- #324 of 540 in MI
Livability — Lake Isabella
- Score
- 70/100
- State rank
- #329
- US rank
- #8104
Category grades
Schools grade is shown separately in the Schools card above.
Census & demographics
- Census place
- Lake Isabella, MI
- Population (ZIP)
- 5,660
Population outlook (Isabella County) Hauer SSP2
- Today (2025)
- 75,111 people
- By 2030
- 77,600 · +3.3%
- By 2040
- 79,890 · +6.4%
- By 2050
- 81,568 · +8.6%
- By 2075
- 86,602 · +15.3%
- By 2100
- 92,201 · +22.8%
Race, ethnicity, and origin ACS 2023
- Neighborhood character
- Predominantly White (88%)
- Race & ethnicity
- White 88% Two or more races 7% Hispanic / Latino 2%
- Common ancestry
- Lithuanian 11% Romanian 5% Italian 2%
- Foreign-born
- 1%
- Languages at home
- 95% English-only · German/W. Germanic 4%
Political lean MEDSL · Isabella
- 2024 margin
- Lean R (+7.5) · D 45.5% · R 53.0% · Other 1.6%
- 2008→2024 swing
- -26.7pp toward R · 2008: 19.2pp · 2024: -7.5pp
- All cycles
- 2024: R+7.5 2020: R+2.5 2016: R+3.7 2012: D+9.3 2008: D+19.2
Not yet ingested
- Civics
- —
Market trends
- HPI YoY
- ▲ 23.65%
- Current HPI
- 381.2
- Rent YoY
- —
- Metro
- —
- State GDP YoY
- ▲ 1.37%
- F500 in state
- 28
Industry mix (Fortune 500 HQ in MI)
| Industry | F500 HQs | Revenue |
|---|---|---|
| Automotive Parts | 3 | $48B |
|
||
| Automotive | 2 | $372B |
|
||
| Chemicals | 1 | $45B |
|
||
| Automotive Retail | 1 | $29B |
|
||
| Healthcare / Medical Devices | 1 | $23B |
|
||
| Automotive Technology | 1 | $20B |
|
||
Price history
+283.3% since first listed4 events — show timeline
- 2026-05-17 Listed $114,999 MiRealSource-MiMLS
- 2023-08-30 Sold (Public Records) $45,500 Public Records
- 2016-07-01 Sold (Public Records) $25,000 Public Records
- 2013-09-12 Sold (Public Records) $30,000 Public Records
Property tax history
-3.3%/yrLatest (2023): $715 · +73.0% YoY. Source: county tax records.
Cash-flow waterfall
monthlySold comps — $/sqft
last 12 mo · ≤1 miLoading sold comps…