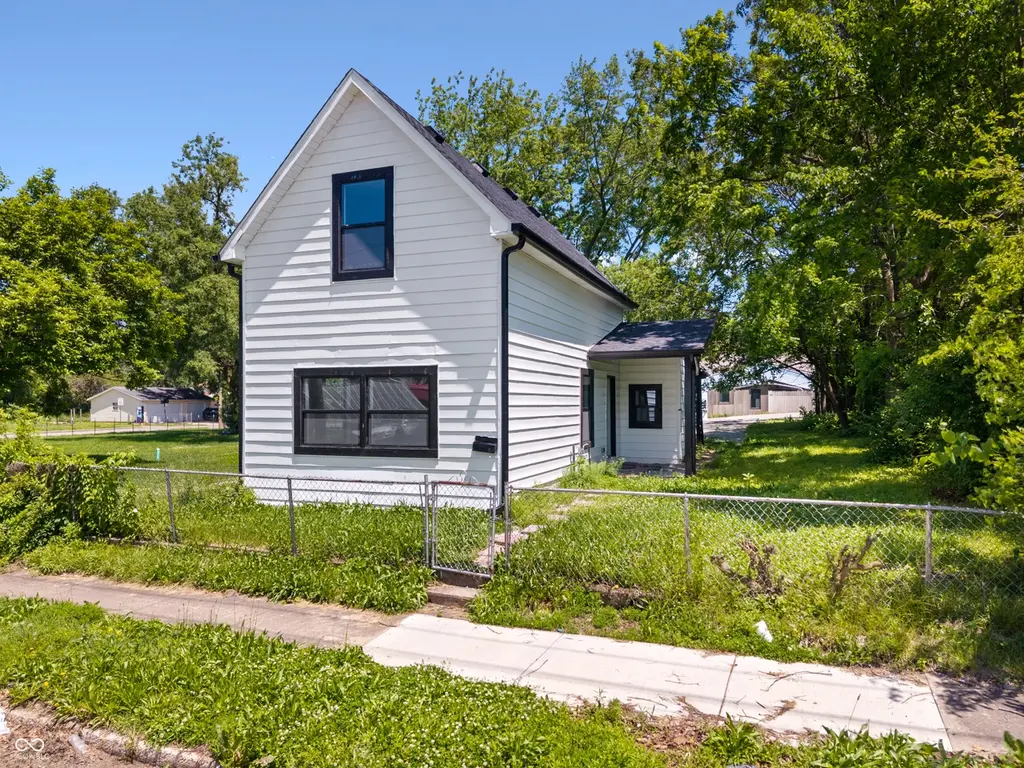
1512 Locust St · Anderson, IN
Flood risk 1/10 · Minimal
- FEMA flood zone
- X (unshaded)
- Chance of flooding over 30 yrs
- 0.0%
- Est. flood insurance / yr
- $507 – $1,088
Fire risk 1/10 · Minimal
- Est. fire insurance / yr
- $717 – $1,331
Heat risk 3/10 · Minor
- Hot days now (above 100°F)
- 7 days/yr
- Hot days in 30 yrs
- 18 days/yr
Wind risk 2/10 · Minimal
- Chance of severe wind over 30 yrs
- —
Air-quality risk 3/10 · Minor
- Unhealthy air days now
- 2 days/yr
- Unhealthy air days in 30 yrs
- 3 days/yr
Risk factors via First Street. Map © Google.
Why this score? — see what drove the C grade
The composite is a weighted blend of 9 inputs, each scored 0–100. Each bar is that input's sub-score; the figure is the points it added to the 100-point composite (weight × sub-score).
- Cash flow +26.3/30.0
- DSCR +8.9/10.0
- 1% rule +5.9/10.0
- Rent growth +4.5/5.0
- ARV discount +4.1/15.0
- Livability +3.0/5.0
- Condition / age +2.5/5.0
- Schools +1.6/10.0
- Appreciation +0.0/10.0
$89,900
🖨 Deal sheet 📄 Offer letter ✓ Due diligence
Listing remarks
Move right in to this fully renovated 3 bedroom, 2 story home. Everything was done in 2024, including a new roof, windows, exterior paint, electrical service, wiring, plumbing, HVAC, and water heater. Enjoy peace of mind with a new kitchen and bathroom, too! Updated flooring and paint. Kitchen appliances included. Covered back porch, plus a gravel parking area in back.
Key facts
- Gravel parking area
- New kitchen
- New bathroom
Tags
Property features AI
Finance
- Other: Lot under 1/4 acre (approximately 0.15 acres)
Exterior
- Utilities: Public water; Municipal sewer connected; Solid waste service available
- Home design: Single-family residence; Updated/remodeled condition; Two levels
- Construction: Aluminum siding; Brick foundation
- Exterior features: No fence
Interior
- Kitchen: Disposal; Over-the-range microwave/hood; Electric oven
- Bedrooms: Three bedrooms total — one on the main level and two on the upper level (Upper bedrooms: 2, Main bedrooms: 1)
- Bathrooms: One full bathroom
- Heating & cooling: Forced air heating (natural gas); Central air conditioning
- Interior features: Eat-in kitchen; Living room; Dining room
Neighborhood map
What this means for you Summary
Snapshot
- This is a 2-bed/1.0-bath single-family listed at $90k.
Deal economics
- At list price, monthly cash flow is $233 ($3k/yr) — positive.
- The deal already cash-flows at list — no discount required.
- Meets the 1% rule at list price ($978 rent vs $90k).
- Recommended offer: $89k (1.5% below list) — sets the bar for market timing.
- Cap rate 9.4% vs local median 6.5% in Anderson — top-decile yield for the area; either an underpriced asset or a hidden risk that comps aren't pricing in. Stress-test before assuming the spread holds.
Location & tenants
- Location reads 60/100 on livability (#521 in IN) — a middle-class / working-renter tenant base. Strengths: cost of living A+, housing A+; Watch: schools F, crime D-, amenities F.
- Anderson Community School Corporation (urban): math 15% / reading 23% proficiency, ranked #280 of 301 in IN (top 93%) — low school quality limits family demand, transient renter base, plan for 1-2y turnover; 70% free/reduced lunch — lower-income household profile, screen leases tightly.
- Market conditions: Rents rising fast (+7.9%/yr); 185 active listings in the ZIP; 40 comparable units currently listed for rent nearby; rentals at typical pace (median 24d on market — plan ~3-4 weeks tenant-placement turnaround); 40% of comp listings sitting > 30 days — soft ceiling on asking rent; lower-income renter base — watch delinquency; 184 units permitted in Madison County in 2024 (0 in 5+ unit buildings).
- This rent runs 33% of the median local income ($36k/yr) — at the standard rent-burdened threshold; future hikes will face affordability resistance.
Forward outlook
- Local home prices are declining (-3.0%/yr); year-one equity from $622 of loan paydown is wiped out by about $3k of value loss. Plan a longer hold.
- Madison County population projected at -14% by 2050 — secular population decline; favor cash flow + early exit over multi-decade hold.
- At projected returns (-3.0% appreciation + 7.9% rent growth), your $25k cash investment doubles in ~8 years — after that, you're playing with house money.
Negotiation context
- It's been on market 20 days — a 2% lower offer ($89k) is reasonable based on typical stale-listing flexibility.
Risks & watch-outs
- Watch-outs: built in 1899 — expect roof / HVAC / electrical / plumbing capex.
Questions for the listing agent
- Built in 1899 — when were the roof, HVAC, electrical panel, plumbing, and water heater last replaced?
- Is there a deadline driving the sale (1031 exchange, divorce, estate, relocation)? That informs how much negotiation room exists.
- Schools are F-rated, which usually means shorter tenancies and higher turnover. Who's the typical renter profile here, and what's been the actual vacancy rate?
- Crime grade is D in this area — have there been break-ins, vandalism, or insurance claims at this property in the last 3 years? What carrier currently insures it and at what premium?
- What's the average days-on-market for RENTAL listings here right now (not sales)? A rising rental-DOM trend means longer vacancies and softer asking-rent achievability than the comps imply.
- What's the recent tenant-quality profile in this submarket — average credit score on applications, eviction rate, late-payment / NSF rate, and stable-employment percentage? A property-management company in the area should have these aggregated.
- How much new for-sale + rental construction is in the pipeline within 1–3 miles? Heavy new supply typically softens prices + rents 12–24 months out; constrained supply supports both.
Investment metrics
- 1% rule
- 1.09% ✓
- Cap rate
- 9.41%
- Cash-on-cash
- 11.12%
- DSCR
- 1.49
- GRM
- 7.7
CMA / ARV
- ARV (on-the-fly)
- $83,658
- Comps found
- 12
Show comp detail 12 sales within ~0.75 mi
| Address | Dist | Beds/Ba | Sqft | Sold | Price | $/sf | Match |
|---|---|---|---|---|---|---|---|
| 1310 W 13th St | 0.20mi | 2/1.0 | 1,178 (+3%) | 1mo | $62,000 | $53 | 85 |
| 1227 W 9th St | 0.43mi | 3/1.0 (+1) | 1,158 (+1%) | 1mo | $84,000 | $73 | 72 |
| 1628 Sherman St | 0.26mi | 2/1.0 | 1,106 (-4%) | 15mo | $55,000 | $50 | 70 |
| 827 W 9th St | 0.50mi | 2/2.0 | 1,221 (+6%) | 8mo | $50,000 | $41 | 55 |
| 1404 Walton St | 0.69mi | 3/1.0 (+1) | 1,090 (-5%) | 8mo | $70,000 | $64 | 48 |
| 416 W 21st St | 0.58mi | 2/1.0 | 1,296 (+13%) | 12mo | $77,000 | $59 | 42 |
| 2226 Hendricks St | 0.51mi | 2/1.0 | 990 (-14%) | 15mo | $70,000 | $71 | 41 |
| 2104 W 16th St | 0.65mi | 3/2.0 (+1) | 1,038 (-9%) | 6mo | $125,000 | $120 | 40 |
| 1632 W 7th St | 0.69mi | 2/1.0 | 1,018 (-11%) | 17mo | $98,000 | $96 | 35 |
| 1430 Walton St | 0.68mi | 3/1.0 (+1) | 988 (-14%) | 13mo | $127,500 | $129 | 29 |
| 2210 Louise St | 0.67mi | 3/1.0 (+1) | 975 (-15%) | 15mo | $128,000 | $131 | 27 |
| 1436 W 5th St | 0.74mi | 3/1.0 (+1) | 975 (-15%) | 14mo | $143,000 | $147 | 24 |
Match score weights: distance 35% · size 25% · config 20% · recency 20%. Top-matched comps best support the ARV.
Projected returns pro-forma
-3.0% appreciation · 7.88% rent growth · sell at horizon
- IRR
- 5.2%
- Equity multiple
- 1.21×
- Total profit
- $5,293
- Equity at exit
- $13,404
- IRR
- 18.3%
- Equity multiple
- 2.85×
- Total profit
- $46,472
- Equity at exit
- $7,773
Cash invested: $25,172 (down + closing). Projections, not guarantees.
Landlord ↔ Tenant lean methodology
- Overall (STATE)
- 90 Strongly Landlord-Friendly
- State Indiana
- 90 Strongly Landlord-Friendly · R+11
- County
- — inherits STATE
- City
- — inherits STATE
ZIP-level market 46016
- Home prices YoY
- -3.5%
- Rents YoY
- 7.9%
- Active inventory
- 185
- Price-to-rent
- 7.7×
Monthly cashflow live
- Estimated rent
- $978 high interval (Pro) →
- Mortgage (P&I)
- −$471
- Tax from tax record
- −$31 /mo · $367/yr
- Insurance
- −$37
- HOA
- −$0
- Vacancy / Maint / Mgmt
- −$205
- Net cashflow
- $233
Break-even live
UW: 25.0% down · 7.5% · 30yr · 1.5% tax · 5.0% vac · 8.0% maint · 8.0% mgmt
Financing live
Cash to close
- Down payment
- $22,475
- Closing costs
- $2,697
- Reserves months
- —
- Total cash needed
- —
Loan-product check · same deal, 3 products live
Conventional
25% down · 7.5% · 30yr
- Down + closing
- —
- Monthly P&I
- —
- Monthly cashflow
- —
- DSCR
- —
- Eligible?
- —
Personal DTI + credit; lowest rate.
DSCR
20% down · 8.5% · 30yr
- Down + closing
- —
- Monthly P&I
- —
- Monthly cashflow
- —
- DSCR
- —
- Eligible?
- —
No personal income docs; deal must DSCR.
Hard money
10% down · 12.0% · 12mo
- Down + closing
- —
- Monthly P&I
- —
- Monthly cashflow
- —
- DSCR
- —
- Eligible?
- —
Short-term bridge; refi at stabilization.
Rent comps 40 comps
| Address | Beds | Baths | Sqft | Rent | $/sqft | DOM | Units | Dist |
|---|---|---|---|---|---|---|---|---|
| 1502 Cedar St Anderson, IN | 2.0 | 1.0 | 1104 | $850 | $0.77 | 43d | 1 | 0.06mi |
| 1310 W 13th St Anderson, IN | 2.0 | 1.0 | 1178 | $895 | $0.76 | 2d | 1 | 0.18mi |
| 1222 Nichol Ave Unit 4 Anderson, IN | 3.0 | 1.0 | 1000 | $1,135 | $1.14 | 7d | 1 | 0.22mi |
| 1616 W 16th St Anderson, IN | 2.0 | 1.0 | 1038 | $1,050 | $1.01 | 43d | 1 | 0.31mi |
| 1640 W 17th St Anderson, IN | 2.0 | 1.0 | 810 | $895 | $1.10 | 20d | 1 | 0.38mi |
| 1720 Nelle St Anderson, IN | 2.0 | 1.0 | 768 | $1,100 | $1.43 | 23d | 1 | 0.49mi |
| 2004 Arrow Ave Anderson, IN | 2.0 | 1.0 | 816 | $1,125 | $1.38 | 23d | 1 | 0.52mi |
| 618 W 22nd St Anderson, IN | 3.0 | 1.0 | 900 | $1,250 | $1.39 | 43d | 1 | 0.54mi |
| 1123 Louise St Anderson, IN | 2.0 | 1.0 | 850 | $850 | $1.00 | 43d | 1 | 0.55mi |
| 1312 W 8th St Unit 1332 F Anderson, IN | 2.0 | 1.0 | 850 | $979 | $1.15 | 43d | 1 | 0.55mi |
| 1312 W 8th St Unit 1308H Anderson, IN | 1.0 | 1.0 | 750 | $999 | $1.33 | 14d | 1 | 0.55mi |
| 1136 Irving Way Anderson, IN | 2.0 | 1.0 | 900 | $895 | $0.99 | 21d | 1 | 0.59mi |
| 2301 Sheridan St Anderson, IN | 2.0 | 1.0 | 900 | $950 | $1.06 | 43d | 1 | 0.60mi |
| 820 W 7th St Apt A Anderson, IN | 2.0 | 2.0 | 1400 | $1,200 | $0.86 | 23d | 1 | 0.60mi |
| 229 W 19th St Anderson, IN | 3.0 | 1.0 | 1200 | $1,000 | $0.83 | 43d | 1 | 0.61mi |
| 2233 Fairview St Anderson, IN | 3.0 | 1.5 | 1452 | $1,195 | $0.82 | 23d | 1 | 0.62mi |
| 1631 W 7th St Anderson, IN | 3.0 | 1.0 | 900 | $1,000 | $1.11 | 43d | 1 | 0.64mi |
| 2411 Hendricks St Anderson, IN | 3.0 | 1.0 | 860 | $1,000 | $1.16 | 23d | 1 | 0.64mi |
| 1212 W 5th St Anderson, IN | 3.0 | 1.0 | 1252 | $1,295 | $1.03 | 12d | 1 | 0.69mi |
| 1404 Walton St Anderson, IN | 3.0 | 1.0 | 1090 | $995 | $0.91 | 43d | 1 | 0.69mi |
| 1532 Walton St Anderson, IN | 3.0 | 1.0 | 1342 | $1,100 | $0.82 | 43d | 1 | 0.69mi |
| 1708 W 7th St Anderson, IN | 1.0 | 1.0 | 700 | $875 | $1.25 | 17d | 1 | 0.70mi |
| 1708 W 7th St Anderson, IN | 1.0 | 1.0 | 700 | $875 | $1.25 | 19d | 1 | 0.70mi |
| 1708 W 7th St Anderson, IN | 1.0 | 1.0 | 700 | $1,000 | $1.43 | 43d | 1 | 0.70mi |
| 924 W 5th St Unit 924 Anderson, IN | 1.0 | 1.0 | 750 | $600 | $0.80 | 23d | 1 | 0.71mi |
| 120 W 10th St Anderson, IN | 1.0–3.0 | 1.0 | 1066 | $1,025 | $0.96 | 1d | 1 | 0.76mi |
| 2324 Chase St Anderson, IN | 2.0 | 1.0 | 783 | $950 | $1.21 | 43d | 1 | 0.79mi |
| 2442 Morton St Anderson, IN | 2.0 | 1.0 | 862 | $1,125 | $1.31 | 23d | 1 | 0.80mi |
| 1317 Main St Anderson, IN | 2.0 | 1.0 | 750 | $800 | $1.07 | 43d | 1 | 0.83mi |
| 1010 W 2nd St Unit 2 Anderson, IN | 2.0 | 1.0 | 875 | $1,025 | $1.17 | 21d | 1 | 0.89mi |
| 1010 W 2nd St Unit 3 Anderson, IN | 3.0 | 1.0 | 1025 | $1,125 | $1.10 | 14d | 1 | 0.89mi |
| 1010 W 2nd St Unit 1 Anderson, IN | 1.0 | 1.0 | 724 | $925 | $1.28 | 23d | 1 | 0.89mi |
| 1529 W 2nd St Anderson, IN | 3.0 | 1.0 | 884 | $1,200 | $1.36 | 23d | 1 | 0.90mi |
| 219 E 13th St Anderson, IN | 3.0 | 1.0 | 882 | $1,000 | $1.13 | 4d | 1 | 0.96mi |
| 2627 Chase St Anderson, IN | 3.0 | 1.0 | 1050 | $850 | $0.81 | 17d | 1 | 0.96mi |
| 2613 Louise St Anderson, IN | 2.0 | 1.0 | 1096 | $950 | $0.87 | 21d | 1 | 0.97mi |
| 2820 Fairview St Unit A Anderson, IN | 2.0 | 1.0 | 850 | $895 | $1.05 | 43d | 1 | 0.98mi |
| 2111 Central Ave Anderson, IN | 3.0 | 1.0 | 1026 | $1,250 | $1.22 | 43d | 1 | 0.99mi |
| 506 W 2nd St Anderson, IN | 3.0 | 1.0 | 964 | $1,095 | $1.14 | 23d | 1 | 0.99mi |
| 602 Meridian St Apt C Anderson, IN | 2.0 | 1.0 | 800 | $900 | $1.12 | 43d | 1 | 1.00mi |
Listing history 13 events
-
2026-06-18days on market $89,900 Active 20 DOM
-
2026-06-17days on market $89,900 Active 19 DOM
-
2026-06-16days on market $89,900 Active 18 DOM
-
2026-06-15days on market $89,900 Active 17 DOM
-
2026-06-13pricedays on market $89,900 Active 15 DOM
-
2026-06-09days on market $98,500 Active 11 DOM
-
2026-06-08days on market $98,500 Active 10 DOM
-
2026-06-07days on market $98,500 Active 9 DOM
-
2026-06-05days on market $98,500 Active 6 DOM
-
2026-06-03days on market $98,500 Active 5 DOM
-
2026-06-02days on market $98,500 Active 4 DOM
-
2026-06-01days on market $98,500 Active 3 DOM
-
2026-05-31days on market $98,500 Active 2 DOM
ⓘ Source: listings_history table (triggers on properties + properties_extension) + one-shot
backfill from property_details.listing_events for pre-trigger history.
Tax reassessment forecast IN · Partial reset (capped growth)
- Current annual tax
- $367 · $31/mo
- Projected year-2 tax
- $565 · $47/mo
- Expected delta
- +$199/yr (+$17/mo · 54.2%)
ⓘ Screening estimate from a state-policy table — verify with the county assessor before closing.
Climate risk First Street
- Flood 1/10 Low FEMA zone X (unshaded) · 0% chance over 30 yrs
- Wildfire 1/10 Low
- Heat 3/10 Moderate 7 d/yr ≥100°F today · 18 d/yr by 30 yrs out
- Wind 2/10 Low
- Air quality 3/10 Moderate 2 unhealthy d/yr today · 3 by 30 yrs out
Nearby sold comps map
Loading sold comps map…
Walkable amenities ~0.75 mi
Loading nearby amenities…
Taxation est. · year 1
- Rental income
- $11,738
- − Mortgage interest
- −$5,036
- − Property taxes
- −$367
- − Insurance
- −$450
- − Repairs & maintenance
- −$939
- − Management
- −$939
- − Depreciation
- −$2,615
- Taxable income
- $1,392
- Est. tax owed @ 24.0%
- −$334
- After-tax cash flow
- $2,465/yr
For passive investors: Depreciation is non-cash, so a rental often shows a tax loss while cash-flowing — sheltering income. Rental losses are passive: they offset passive income freely, and up to $25,000/yr can offset ordinary (W-2) income if you actively participate and your MAGI is under $100k (phasing out to $0 by $150k); unused losses carry forward. On sale, claimed depreciation is recaptured at up to 25%, and gains may owe capital-gains tax (a 1031 exchange can defer both). Figures are a year-1 estimate at your 24.0% rate — not tax advice; consult a CPA.
Schools (NCES district)
- District
- Anderson Community School Corporation
- NCES district ID
- 1800150
- Math proficiency
- 15% ▼ -14.00%
- Reading proficiency
- 23% ▼ -7.00%
- Median HH income
- $38,208
- Composite
- 15.93/100
- National rank
- #9250
- State rank
- #280 of 301 in IN
Livability — Anderson
- Score
- 60/100
- State rank
- #521
- US rank
- #18709
Category grades
Schools grade is shown separately in the Schools card above.
Census & demographics
- Census place
- Anderson, IN
- County
- Madison County · 69,445 people
- City population
- 57,762
- Metro
- Indianapolis-Carmel-Anderson, IN
- Population (ZIP)
- 17,834
- Household income
- $36,029
- Rent vs Own
- Severe rent burden
- 1193.0
Population outlook (Madison County) Hauer SSP2
- Today (2025)
- 125,800 people
- By 2030
- 122,640 · -2.5%
- By 2040
- 115,420 · -8.3%
- By 2050
- 108,148 · -14.0%
- By 2075
- 91,838 · -27.0%
- By 2100
- 75,670 · -39.8%
Race, ethnicity, and origin ACS 2023
- Neighborhood character
- Diverse neighborhood (Simpson 0.58)
- Race & ethnicity
- White 61% Black 18% Hispanic / Latino 13% Two or more races 11% Native American 1%
- Hispanic origin (detail)
- Mexican 10% Puerto Rican 1%
- Common ancestry
- Italian 2% Slovak 1% Iranian 1%
- Foreign-born
- 4% · Canada
- Languages at home
- 86% English-only · Spanish 12%
Political lean MEDSL · Madison
- 2024 margin
- Strong R (+26.9) · D 35.6% · R 62.5% · Other 1.9%
- 2008→2024 swing
- -33.5pp toward R · 2008: 6.5pp · 2024: -26.9pp
- All cycles
- 2024: R+26.9 2020: R+22.6 2016: R+25.7 2012: R+4.5 2008: D+6.5
Not yet ingested
- Civics
- —
Market trends
- HPI YoY
- ▼ -11.12%
- Current HPI
- 302.7437
- Rent YoY
- ▲ 7.88%
- Metro
- Indianapolis-Carmel-Anderson, IN
- State GDP YoY
- ▲ 2.90%
- F500 in state
- 18
Industry mix (Fortune 500 HQ in IN)
| Industry | F500 HQs | Revenue |
|---|---|---|
| Industrial Machinery | 2 | $37B |
|
||
| Healthcare | 1 | $177B |
|
||
| Pharmaceuticals | 1 | $45B |
|
||
| Metals / Steel | 1 | $18B |
|
||
| Agriculture | 1 | $17B |
|
||
| Packaging | 1 | $12B |
|
||
Price history
1 event — show timeline
- 2026-05-29 Listed $98,500 MIBOR as Distributed by MLS Grid
Property tax history
+1.0%/yrLatest (2024): $367 · +7.8% YoY. Source: county tax records.
Cash-flow waterfall
monthlySold comps — $/sqft
last 12 mo · ≤1 miLoading sold comps…